Blog
How To Set Line Properties Using xlwings? – Transparency
Method
You can set or get the line’s transparency using the `Transparency` property of the `LineFormat` object. The value ranges from 0.0 (opaque) to 1.0 (fully transparent).
shp2=sht.api.Shapes.AddLine(100, 125, 400, 125) #Second line segment
shp2.Line.Weight=8 #Line width
shp2.Line.ForeColor.RGB=xw.utils.rgb_to_int((255,0,0)) #Red
shp2.Line.Transparency=0.7 #Transparency 0.7
Sample Code
#Line properties - Transparency

import xlwings as xw    #Import xlwings package

app=xw.App()
bk=app.books.active   #Get the active workbook
sht=bk.sheets.active    #Get the active worksheet

sht.api.Shapes.AddShape(9, 150, 50, 200, 100)    #Elliptical area
shp=sht.api.Shapes.AddLine(100, 75, 400, 75)    #First line segment
shp.Line.Weight=8    #Line width
shp.Line.ForeColor.RGB=xw.utils.rgb_to_int((255,0,0))    #Red

shp2=sht.api.Shapes.AddLine(100, 125, 400, 125)    #Second line segment
shp2.Line.Weight=8    #Line width
shp2.Line.ForeColor.RGB=xw.utils.rgb_to_int((255,0,0))    #Red
shp2.Line.Transparency=0.7    #Transparency 0.7

#bk.save()
#bk.close()
#app.kill()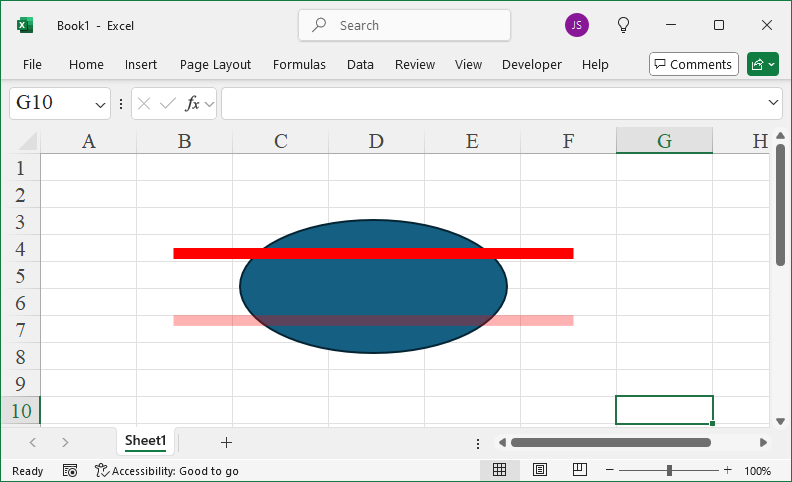
How To Set Line Properties Using xlwings? – Arrows
Method
You can set the line’s color using the `ForeColor` property of the `LineFormat` object. The color can be set using various methods, including RGB, theme colors, and color schemes.
You can set the line style using the `DashStyle` property of the `LineFormat` object. The available line styles are:
|
Name |
Value |
Description |
|
msoLineDash |
4 |
Dashed line |
|
msoLineDashDot |
5 |
Dash-dot line |
|
msoLineDashDotDot |
6 |
Dash-dot-dot line |
|
msoLineDashStyleMixed |
-2 |
Not supported |
|
msoLineLongDash |
7 |
Long dashed line |
|
msoLineLongDashDot |
8 |
Long dash-dot line |
|
msoLineRoundDot |
3 |
Round dotted line |
|
msoLineSolid |
1 |
Solid line |
|
msoLineSquareDot |
2 |
Square dotted line |
You can set the line width using the `Weight` property. This is a single value that determines the thickness of the line.
shp=sht.api.Shapes.AddLine(80, 50, 200, 300) #Create a line segment Shape object
lf=shp.Line #Get the line shape object
lf.Weight=2 #Line width
lf.BeginArrowheadLength=1 #Arrow length at the start point
lf.BeginArrowheadStyle=6 #Arrow style at the start point
lf.BeginArrowheadWidth=1 #Arrow width at the start point
lf.EndArrowheadLength=3 #Arrow length at the endpoint
lf.EndArrowheadStyle=2 #Arrow style at the endpoint
lf.EndArrowheadWidth=3 #Arrow width at the endpoint
Sample Code
#Line properties - Arrow

import xlwings as xw    #Import xlwings package

app=xw.App()
bk=app.books.active   #Get the active workbook
sht=bk.sheets.active    #Get the active worksheet

shp=sht.api.Shapes.AddLine(80, 50, 200, 300)    #Create a line segment Shape object
lf=shp.Line    #Get the line shape object
lf.Weight=2    #Line width
lf.BeginArrowheadLength=1    #Arrow length at the start point
lf.BeginArrowheadStyle=6    #Arrow style at the start point
lf.BeginArrowheadWidth=1    #Arrow width at the start point
lf.EndArrowheadLength=3    #Arrow length at the endpoint
lf.EndArrowheadStyle=2    #Arrow style at the endpoint
lf.EndArrowheadWidth=3    #Arrow width at the endpoint

#bk.save()
#bk.close()
#app.kill()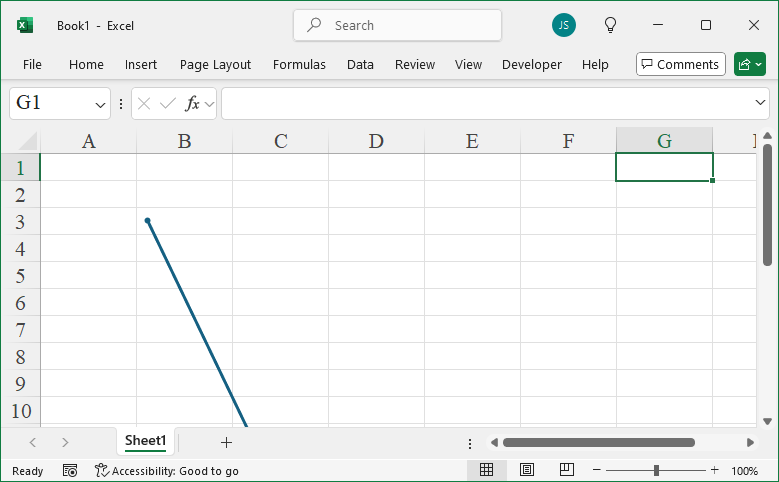
How To Set Line Properties Using xlwings? – Color, Line Style, and Line Width
Method
In Excel, line objects are represented by the `LineFormat` object. The `Line` property of a `Shape` object returns a `LineFormat` object. For example, a straight line, the borders of a rectangle, and a circular region are all represented as `LineFormat` objects.
Once you have the `LineFormat` object, you can use its properties and methods to set various attributes like color, line style, line width, arrows, transparency, and pattern fill.
shp=sht.api.Shapes.AddLine(20, 20, 100, 120)
lf=shp.Line
lf.ForeColor.RGB=xw.utils.rgb_to_int((255,0,0)) #Red
lf.DashStyle=5 #Line style, dotted line
lf.Weight=3 #Line width
shp2=sht.api.Shapes.AddShape(9, 200, 30, 120, 80)
#Line shape in elliptical area, i.e., the boundary of the area
lf2=shp2.Line
lf2.ForeColor.RGB=xw.utils.rgb_to_int((255,0,0)) #Red
lf2.DashStyle=3 #Line style, dotted line with circles
lf2.Weight=4 #Line width
Sample Code
#Line properties

import xlwings as xw    #Import xlwings package

app=xw.App()
bk=app.books.active   #Get the active workbook
sht=bk.sheets.active    #Get the active worksheet

shp=sht.api.Shapes.AddLine(20, 20, 100, 120)
lf=shp.Line
lf.ForeColor.RGB=xw.utils.rgb_to_int((255,0,0))    #Red
lf.DashStyle=5    #Line style, dotted line
lf.Weight=3    #Line width

shp2=sht.api.Shapes.AddShape(9, 200, 30, 120, 80)
#Line shape in elliptical area, i.e., the boundary of the area
lf2=shp2.Line
lf2.ForeColor.RGB=xw.utils.rgb_to_int((255,0,0))    #Red
lf2.DashStyle=3    #Line style, dotted line with circles
lf2.Weight=4    #Line width

#bk.save()
#bk.close()
#app.kill()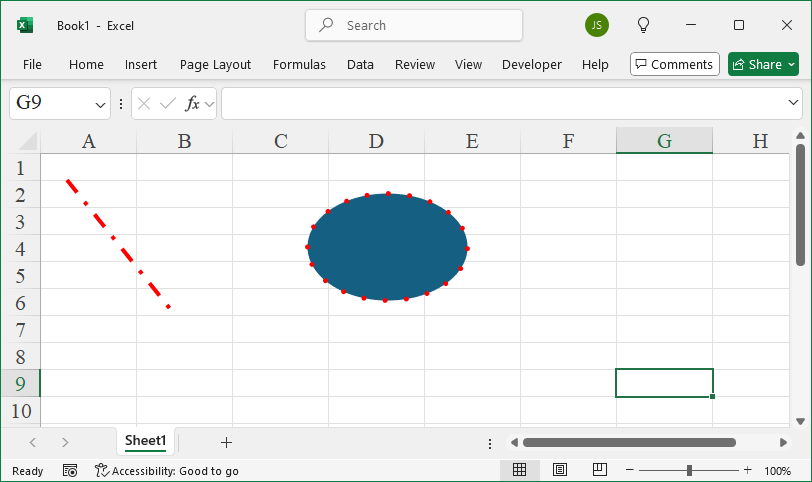
How To Set Color Using xlwings? – Scheme Colors
Method
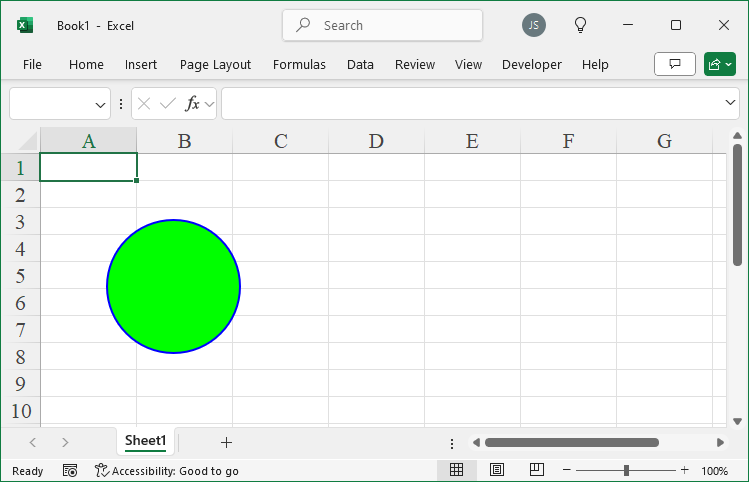
Excel provides a set of colors from its color scheme that can be used to fill graphical objects. For graphical objects, the `ForeColor` and `BackColor` properties return a `ColorFormat` object, which includes a `SchemeColor` property. Each color in the color scheme has an index number, which can be assigned to the `SchemeColor` property.
shp=sht.api.Shapes.AddShape(9, 50, 50, 100, 100)
shp.Fill.ForeColor.SchemeColor=3
shp.Line.ForeColor.SchemeColor=4
Sample Code
#Color - Scheme color

import xlwings as xw    #Import xlwings package

app=xw.App()
bk=app.books.active   #Get the active workbook
sht=bk.sheets.active    #Get the active worksheet

shp=sht.api.Shapes.AddShape(9, 50, 50, 100, 100)
shp.Fill.ForeColor.SchemeColor=3
shp.Line.ForeColor.SchemeColor=4

#bk.save()
#bk.close()
#app.kill()
How To Set Color Using xlwings? – Theme Colors
Method
|
Name |
Value |
Description |
|
xlThemeColorAccent1 |
5 |
Accent1 |
|
xlThemeColorAccent2 |
6 |
Accent2 |
|
xlThemeColorAccent3 |
7 |
Accent3 |
|
xlThemeColorAccent4 |
8 |
Accent4 |
|
xlThemeColorAccent5 |
9 |
Accent5 |
|
xlThemeColorAccent6 |
10 |
Accent6 |
|
xlThemeColorDark1 |
1 |
Dark1 |
|
xlThemeColorDark2 |
3 |
Dark2 |
|
xlThemeColorFollowedHyperlink |
12 |
Followed hyperlink |
|
xlThemeColorHyperlink |
11 |
Hyperlink |
|
xlThemeColorLight1 |
2 |
Light1 |
|
xlThemeColorLight2 |
4 |
Light2 |
shp=sht.api.Shapes.AddShape(9, 50, 50, 100, 100)
shp.Fill.ForeColor.ObjectThemeColor=10
shp.Line.ForeColor.ObjectThemeColor=3
Sample Code
#Color - Theme color

import xlwings as xw    #Import xlwings package

app=xw.App()
bk=app.books.active   #Get the active workbook
sht=bk.sheets.active    #Get the active worksheet

shp=sht.api.Shapes.AddShape(9, 50, 50, 100, 100)
shp.Fill.ForeColor.ObjectThemeColor=10
shp.Line.ForeColor.ObjectThemeColor=3

#bk.save()
#bk.close()
#app.kill()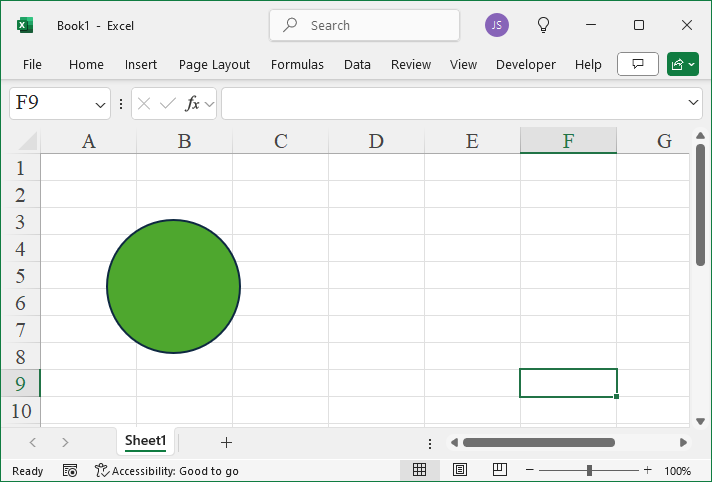
How To Set Color Using xlwings? – Indexed Coloring
Method
Indexed coloring involves using a predefined set of colors, known as a color lookup table, where each color has a unique index number, as shown in the diagram. To apply indexed coloring, simply assign an index number to the corresponding indexed color property.

sht.api.Range(“C3”).Font.ColorIndex=3
sht.api.Range(“C3″).Value=”Hello”
Sample Code
#Color - Index color

import xlwings as xw    #Import xlwings package

app=xw.App()
bk=app.books.active   #Get the active workbook
sht=bk.sheets.active    #Get the active worksheet

sht.api.Range("C3").Font.ColorIndex=3
sht.api.Range("C3").Value="Hello"

#bk.save()
#bk.close()
#app.kill()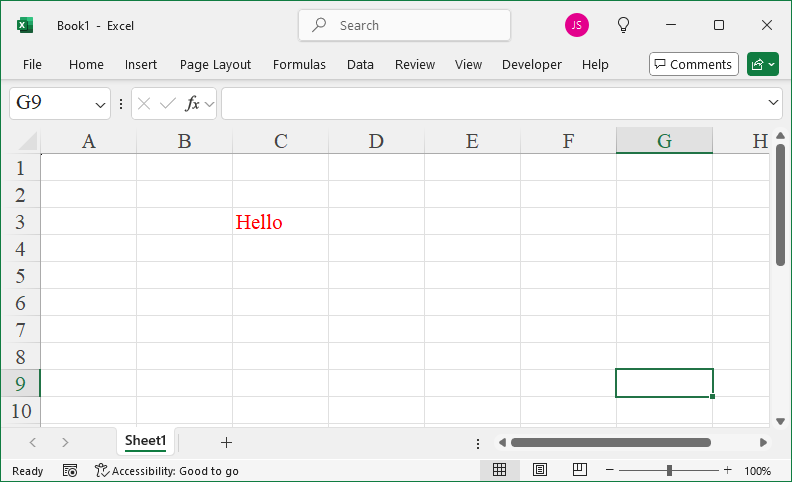
How To Set Color Using xlwings? – RGB
Method
RGB color shading defines a color using the red, green, and blue components. You can set RGB color shading using the `Color` property of graphical objects. If you’re accustomed to specifying RGB components to set the color, you can use the `rgb_to_int` method from the `xlwings.utils` class to convert an RGB tuple, such as (255, 0, 0), into an integer, which can then be assigned to the `Color` property.
shp=sht.api.Shapes.AddShape(9, 50, 50, 100, 100)
shp.Fill.ForeColor.RGB=xw.utils.rgb_to_int((0, 255,0))
shp.Line.ForeColor.RGB=xw.utils.rgb_to_int((0,0,255))
shp.Line.ForeColor.RGB=16711680 # or 0x0000FF
Sample Code
#Color - RGB

import xlwings as xw    #Import xlwings package

app=xw.App()
bk=app.books.active   #Get the active workbook
sht=bk.sheets.active    #Get the active worksheet

shp=sht.api.Shapes.AddShape(9, 50, 50, 100, 100)
#shp.Fill.ForeColor.RGB=xw.utils.rgb_to_int((0, 255,0))
shp.Line.ForeColor.RGB=xw.utils.rgb_to_int((0,0,255))

shp.Fill.ForeColor.RGB=0x0000FF    # or 16711680

#bk.save()
#bk.close()
#app.kill()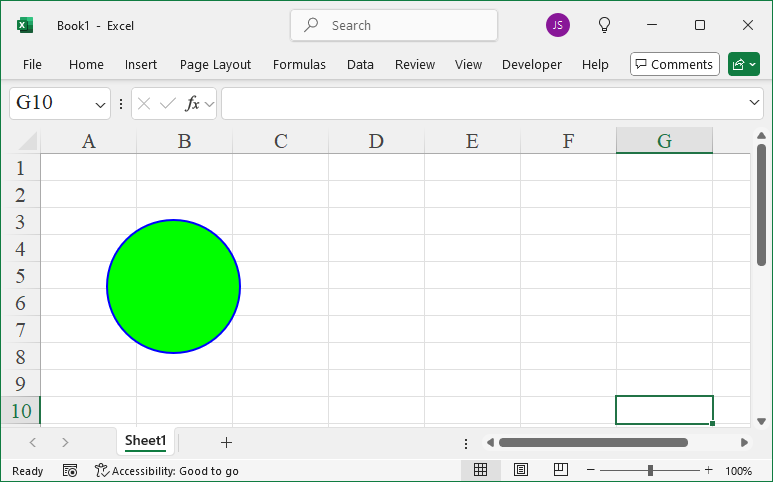
How To Create WordArt Using xlwings?
Method
Use the `AddTextEffect` method of the `Shapes` object to create WordArt. The syntax is:
sht.api.Shapes.AddTextEffect(PresetTextEffect,Text,FontName,FontSize,FontBold,FontItalic, Left, Top)
Where `sht` is the current worksheet. The parameters are explained in the table below.
|
Name |
Required/Optional |
Data Type |
Description |
|
PresetTextEffect |
Required |
MsoPresetTextEffect |
Predefined text effect |
|
Text |
Required |
String |
Text for WordArt |
|
FontName |
Required |
String |
Font name used for WordArt |
|
FontSize |
Required |
Single |
Font size (in points) used in WordArt |
|
FontBold |
Required |
MsoTriState |
Whether the font is bold |
|
FontItalic |
Required |
MsoTriState |
Whether the font is italic |
|
Left |
Required |
Single |
Horizontal coordinate of the upper-left corner |
|
Top |
Required |
Single |
Vertical coordinate of the upper-left corner |
|
Name |
Value |
Description |
|
msoTextEffect1 |
0 |
First text effect |
|
msoTextEffect2 |
1 |
Second text effect |
|
msoTextEffect3 |
2 |
Third text effect |
|
…… |
|
|
sht.api.Shapes.AddTextEffect(9,’Learn Python’,’Arial Black’,36,False,False,10,10)
sht.api.Shapes.AddTextEffect(29,’xlwings’,’Times New Roman’,40,False,False,30,50)
Sample Code
#Drawing WordArt

import xlwings as xw    #Import xlwings package

app=xw.App()
bk=app.books.active   #Get the active workbook
sht=bk.sheets.active    #Get the active worksheet

sht.api.Shapes.AddTextEffect(9,'Learn Python','Arial Black',36,False,False,10,10)
sht.api.Shapes.AddTextEffect(29,'xlwings','Times New Roman',40,False,False,30,50)

#bk.save()
#bk.close()
#app.kill()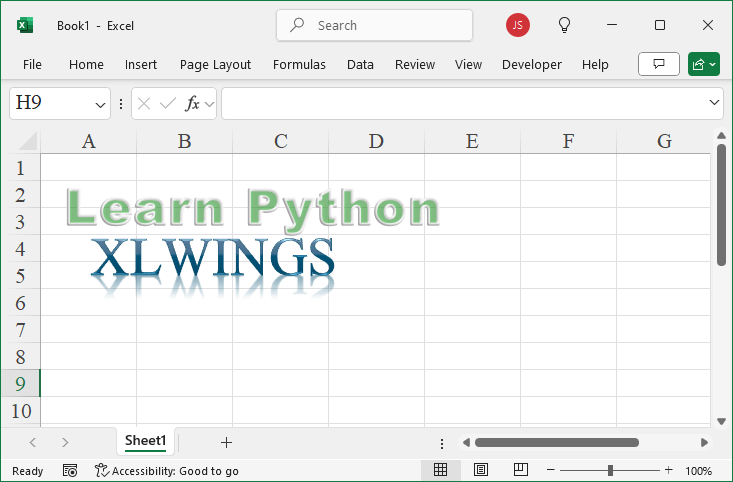
How To Create Chart Using xlwings?
Method
Use the `AddChart2` method of the `Shapes` object to create a chart. The syntax is:
sht.api.Shapes.AddChart2(Style, XlChartType, Left, Top, Width, Height, NewLayout)
Where `sht` is the current worksheet. There are 7 parameters, all optional.
- Style:Chart style, -1 represents the default style for the chart type
- xlChartType:Chart type, using values from the `XlChartType` enumeration, a part of which is listed below
- Left:Left position of the chart, centered horizontally if omitted
- Top:Top position of the chart, centered vertically if omitted
- Width:Width of the chart, default is 354 if omitted
- Height:Height of the chart, default is 210 if omitted
- NewLayout:Determines the chart layout. If `True`, legends are shown only for composite charts
|
Name |
Value |
Description |
|
xlArea |
1 |
Area chart |
|
xlLine |
4 |
Line chart |
|
xlPie |
5 |
Pie chart |
|
xlBarClustered |
57 |
Clustered bar chart |
|
xlBarStacked |
58 |
Stacked bar chart |
|
xlXYScatter |
-4169 |
XY scatter chart |
|
xlBubble |
个 |
Bubble chart |
|
xlSurface |
83 |
3D Surface chart |
|
…… |
sht.api.Range(‘A1’).CurrentRegion.Select()
sht.api.Shapes.AddChart2(-1,xw.constants.ChartType.xlColumnClustered,30,150,300,200,True)
Sample Code
#Drawing charts

import xlwings as xw
import os

root = os.getcwd()
app = xw.App(visible=True, add_book=False)
wb=app.books.open(root+r'/GDP.xlsx',read_only=False)
sht=wb.sheets(1)

sht.api.Range('B1:H7').Select()
sht.api.Shapes.AddChart2(-1,xw.constants.ChartType.xlColumnClustered,30,150,300,200,True)

#bk.save()
#bk.close()
#app.kill()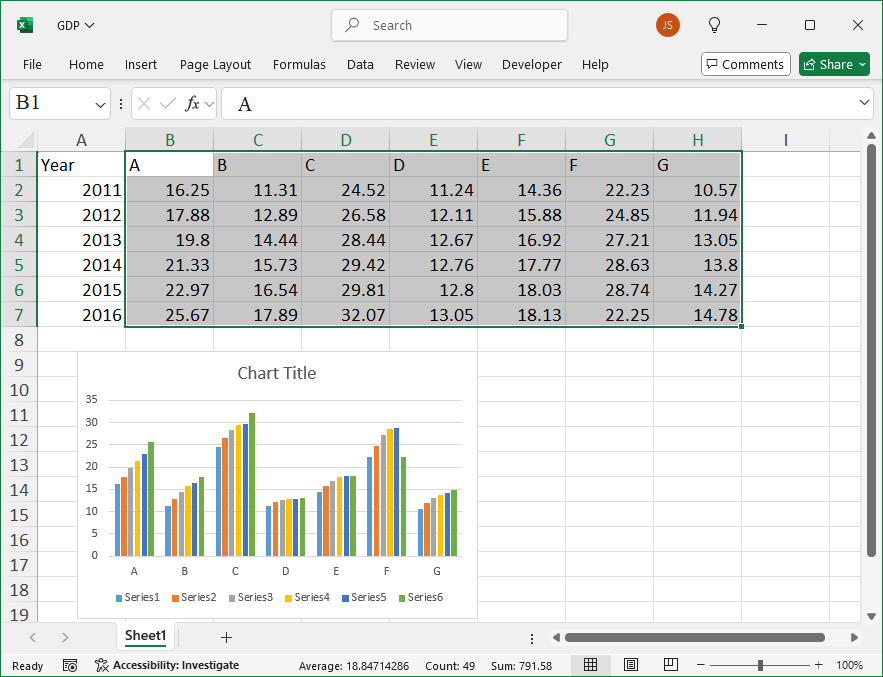
How To Create AutoShapes Using xlwings?
Method
AutoShapes are predefined shapes in Excel. Use the `AddShape` method of the `Shapes` object to create AutoShapes.
|
Name |
Value |
Description |
|
msoShapeOval |
9 |
Oval |
|
msoShapeOvalCallout |
107 |
Oval callout |
|
msoShapeParallelogram |
12 |
Slanted parallelogram |
|
msoShapePie |
142 |
Pie (sector) missing parts |
|
msoShapeQuadArrow |
39 |
Arrows pointing up, down, left, right |
|
msoShapeQuadArrowCallout |
59 |
Callout with directional arrows |
|
msoShapeRectangle |
1 |
Rectangle |
|
msoShapeRectangularCallout |
105 |
Rectangular callout |
|
msoShapeRightArrow |
33 |
Right arrow |
|
msoShapeRightArrowCallout |
53 |
Callout with right arrow |
|
msoShapeRightBrace |
32 |
Right brace |
|
msoShapeRightBracket |
30 |
Right bracket |
|
msoShapeRightTriangle |
utf-8 |
Right-angle triangle |
|
msoShapeRound1Rectangle |
151 |
Rectangle with one rounded corner |
|
msoShapeRound2DiagRectangle |
157 |
Rectangle with two rounded corners diagonally opposite |
|
msoShapeRound2SameRectangle |
152 |
Rectangle with two rounded corners on the same side |
|
msoShapeRoundedRectangle |
5 |
Rounded rectangle |
|
msoShapeRoundedRectangularCallout |
106 |
Rounded rectangular callout |
|
…… |
|
|
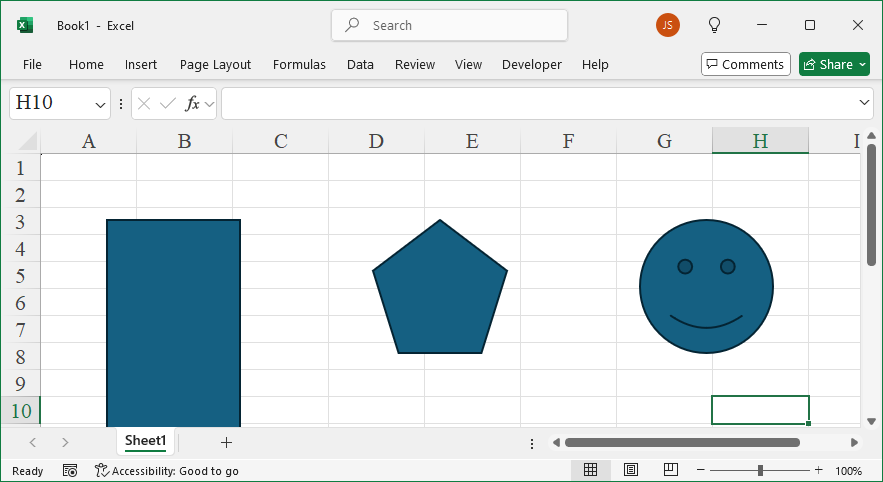
sht.api.Shapes.AddShape(1, 50, 50, 100, 200)
sht.api.Shapes.AddShape(12, 250, 50, 100, 100)
sht.api.Shapes.AddShape(17, 450, 50, 100, 100)
Sample Code
#Drawing shapes

import xlwings as xw    #Import xlwings package

app=xw.App()
bk=app.books.active   #Get the active workbook
sht=bk.sheets.active    #Get the active worksheet

sht.api.Shapes.AddShape(1, 50, 50, 100, 200)
sht.api.Shapes.AddShape(12, 250, 50, 100, 100)
sht.api.Shapes.AddShape(17, 450, 50, 100, 100)

#bk.save()
#bk.close()
#app.kill()