Blog
How to use Application.EditDirectlyInCell in the xlwings API way
The Application.EditDirectlyInCell property in Excel is a Boolean value that controls whether in-cell editing is enabled for the active workbook. When set to True, users can directly edit cell contents by clicking on the cell, which is the default behavior in most Excel environments. When set to False, editing must be done through the formula bar, which can be useful in scenarios where you want to prevent accidental edits or guide users to a specific input method. This property is part of the Excel Application object model and can be accessed via xlwings to programmatically manage editing behavior in automation scripts.
In xlwings, the Application object is represented by the app object when you connect to an Excel instance. The EditDirectlyInCell property can be accessed as an attribute of the app object. The syntax for using this property in xlwings is straightforward: it involves getting or setting the property value to control in-cell editing. Specifically, you can retrieve the current setting or change it by assigning a Boolean value. The property does not take any parameters; it is a simple read/write property that returns or accepts True or False. For example, to check the current state, you can read app.EditDirectlyInCell, and to disable in-cell editing, you can set app.EditDirectlyInCell = False. This allows for dynamic control over the user interface during automation tasks, such as when preparing a workbook for data entry by external users or locking down editing during a macro execution.
A practical use case for EditDirectlyInCell in xlwings is in automated reporting workflows where you need to ensure data integrity. For instance, if you are generating a report and want to force users to review changes in the formula bar before committing, you can disable in-cell editing temporarily. Below is a code example that demonstrates how to use this property with xlwings. First, ensure you have xlwings installed and an Excel instance running. The code connects to Excel, disables in-cell editing, performs some operations, and then re-enables it. This helps prevent accidental modifications while the script is manipulating cells. After running, you can verify that clicking on cells does not allow direct edits until the property is reset to True.
Example xlwings API code:
import xlwings as xw

# Connect to the active Excel instance
app = xw.apps.active

# Get the current EditDirectlyInCell setting
current_setting = app.EditDirectlyInCell
print(f"Current EditDirectlyInCell setting: {current_setting}")

# Disable in-cell editing
app.EditDirectlyInCell = False
print("In-cell editing disabled.")

# Perform some Excel operations, e.g., write data to a cell
wb = app.books.active
ws = wb.sheets[0]
ws.range('A1').value = "Edit this in formula bar only"

# Re-enable in-cell editing after operations
app.EditDirectlyInCell = True
print("In-cell editing re-enabled.")

# Optionally, save and close
wb.save()
app.quit()How to use Application.DisplayStatusBar in the xlwings API way
The DisplayStatusBar property of the Application object in Excel is a key feature for controlling the visibility of the status bar at the bottom of the Excel application window. This status bar provides useful information such as the current mode (e.g., “Ready” or “Edit”), the sum or average of selected cells, and other contextual details. In xlwings, a powerful Python library for automating Excel, you can programmatically get or set the DisplayStatusBar property to show or hide the status bar, enhancing user experience or streamlining automated workflows. This is particularly useful when creating custom Excel applications or scripts where you want to control the Excel interface dynamically.
In xlwings, the DisplayStatusBar property is accessed through the app object, which represents the Excel application. The property is a boolean value: setting it to True makes the status bar visible, while False hides it. The syntax is straightforward, as xlwings mirrors the Excel object model closely. You can retrieve the current state or modify it as needed. Note that changes to this property affect the entire Excel application instance, so it will apply to all open workbooks under that instance. This property is read-write, allowing full control over its state.
The syntax for using DisplayStatusBar in xlwings is simple. To get the current visibility, use app.display_status_bar. To set it, assign a boolean value like app.display_status_bar = True or app.display_status_bar = False. There are no parameters for this property; it directly reflects or changes the status bar’s display state. In terms of Excel’s object model, this corresponds to the Application.DisplayStatusBar property, which xlwings exposes in a Pythonic way. It’s important to ensure that the Excel application is properly connected via xlwings, typically by instantiating an App object or using the active app.
Here are some practical xlwings code examples to illustrate the usage of DisplayStatusBar:
- Checking the current status bar visibility:
import xlwings as xw
# Connect to the active Excel instance
app = xw.apps.active
# Get the current display state
is_visible = app.display_status_bar
print(f"Status bar is visible: {is_visible}")
This code snippet retrieves and prints whether the status bar is currently shown.
- Hiding the status bar:
import xlwings as xw
# Start a new Excel instance or connect to an existing one
app = xw.App(visible=True) # Ensure Excel is visible
# Hide the status bar
app.display_status_bar = False
# Perform some tasks, like opening a workbook
wb = app.books.open('example.xlsx')
# The status bar will remain hidden during operations
This example hides the status bar when launching Excel, which can be useful for a cleaner interface in automated reports.
- Toggling the status bar based on conditions:
import xlwings as xw
app = xw.apps.active
# Toggle the status bar: if visible, hide it; if hidden, show it
app.display_status_bar = not app.display_status_bar
# This can be integrated into a larger script to adjust the UI dynamically
This demonstrates how to toggle the status bar, which might be used in response to user actions or specific workflow steps.
- Restoring the status bar after automation:
import xlwings as xw
app = xw.App(visible=True)
original_state = app.display_status_bar # Save the original state
app.display_status_bar = False # Hide for automation
# Execute data processing or other tasks
wb = app.books.add()
wb.sheets[0].range('A1').value = 'Data processed'
# Restore the original state
app.display_status_bar = original_state
app.quit() # Close ExcelHow to use Application.DisplayScrollBars in the xlwings API way
The DisplayScrollBars property of the Application object in Excel controls the visibility of scroll bars in workbook windows. This feature is particularly useful when creating custom dashboards or reports where you want to minimize interface distractions or ensure a clean layout. By manipulating this property, developers can programmatically show or hide both horizontal and vertical scroll bars across all open workbooks, enhancing the user experience in automated Excel applications.
In xlwings, the DisplayScrollBars property is accessed through the app object, which represents the Excel application. The property is a boolean value that can be set to True to display scroll bars or False to hide them. The syntax is straightforward: app.display_scroll_bars = value, where value is either True or False. It’s important to note that this setting applies globally to the Excel instance, affecting all workbooks currently open. There are no additional parameters or arguments for this property, making it simple to implement.
For example, consider a scenario where you are generating a financial report and want to hide scroll bars to prevent users from accidentally scrolling away from the main data view. You can use the following xlwings code:
import xlwings as xw

# Connect to the active Excel instance or start a new one
app = xw.apps.active

# Hide the scroll bars
app.display_scroll_bars = False

# Perform other operations, such as writing data or formatting
# ...

# To show the scroll bars again, set it to True
app.display_scroll_bars = True
Another common use case is in a script that prepares multiple workbooks for presentation. You might want to ensure scroll bars are hidden consistently across all files. Here’s a more comprehensive example:
import xlwings as xw

# Start Excel if not already running
app = xw.App(visible=True)

# Hide scroll bars for a cleaner look
app.display_scroll_bars = False

# Open or create workbooks and manipulate them as needed
wb = app.books.add()
sheet = wb.sheets[0]
sheet.range('A1').value = 'Sample Data'

# After completing tasks, you can restore scroll bars if desired
app.display_scroll_bars = True

# Save and close
wb.save('report.xlsx')
wb.close()
app.quit()How to use Application.DisplayRecentFiles in the xlwings API way
The DisplayRecentFiles property of the Application object in Excel’s object model controls whether the list of recently used files is shown in the Excel application’s backstage view (accessible via the File menu). In xlwings, a Python library for interacting with Excel, you can access and manipulate this property to customize the user interface experience programmatically. This can be useful in automation scripts where you want to streamline the Excel environment by hiding or showing recent files based on specific workflows or user preferences.
Functionality:
The DisplayRecentFiles property is a Boolean value that determines the visibility of the recent files list. When set to True, Excel displays the list of recently opened documents; when set to False, the list is hidden. This property affects the Excel application globally, meaning it applies to all workbooks open in that instance of Excel. It is part of the application-level settings and can be used to enhance security or reduce clutter in user interfaces, especially in controlled corporate environments or automated reporting tools.
Syntax in xlwings:
In xlwings, you access the Application object through the app property of a workbook or by creating an instance of the Excel application. The DisplayRecentFiles property is exposed as an attribute that can be read or written. The syntax is straightforward:
import xlwings as xw

# Connect to the active Excel instance or start a new one
app = xw.apps.active # or xw.App() for a new instance

# Get the current value of DisplayRecentFiles
current_setting = app.api.DisplayRecentFiles

# Set DisplayRecentFiles to a new value
app.api.DisplayRecentFiles = False # Hides the recent files list
Note: The api property in xlwings provides direct access to the underlying Excel object model, allowing you to use properties and methods as defined in Excel’s VBA documentation. For DisplayRecentFiles, no parameters are required—it is a simple read/write property.
Code Examples:
Here are practical xlwings API code snippets demonstrating the use of DisplayRecentFiles:
- Check and Report the Current Setting:
This example retrieves the current state ofDisplayRecentFilesand prints a message based on its value.
import xlwings as xw

# Connect to Excel
app = xw.apps.active

# Get the property value
is_displayed = app.api.DisplayRecentFiles
if is_displayed:
    print("The recent files list is currently visible in Excel.")
else:
print("The recent files list is hidden.")- Toggle the Visibility of Recent Files:
This script toggles theDisplayRecentFilessetting, switching it from its current state to the opposite. It can be used in a macro or automated task to dynamically adjust the UI.
import xlwings as xw

app = xw.apps.active
# Toggle the property
app.api.DisplayRecentFiles = not app.api.DisplayRecentFiles
print(f"DisplayRecentFiles toggled to: {app.api.DisplayRecentFiles}")- Hide Recent Files for a Clean Interface:
In an automation scenario where you want to present a distraction-free Excel environment—for instance, when generating reports—you can setDisplayRecentFilestoFalseat the start and restore it later.
import xlwings as xw

app = xw.apps.active
# Save the original setting
original_setting = app.api.DisplayRecentFiles

# Hide the recent files list
app.api.DisplayRecentFiles = False
print("Recent files list hidden. Perform your tasks here...")

# Restore the original setting (optional)
app.api.DisplayRecentFiles = original_setting
print("Original setting restored.")How to use Application.DisplayPasteOptions in the xlwings API way
The Application.DisplayPasteOptions property in Excel is a member of the Application object model that controls the visibility of the Paste Options button, which appears after a paste operation in the Excel user interface. This button provides users with a dropdown menu of context-specific paste formatting choices, such as keeping source formatting, matching destination formatting, or pasting values only. In xlwings, a powerful Python library for automating Excel, you can access and manipulate this property to either show or hide this button programmatically, allowing for a cleaner or more guided user experience during automation scripts. This is particularly useful when you want to suppress the button to prevent user distraction or ensure consistency in automated reports.
Functionality
The primary function of DisplayPasteOptions is to toggle the display of the Paste Options button (also known as the “smart tag”) that appears after performing a paste action in Excel. When enabled, users can click this button to select various paste special options. When disabled, the button does not appear, which can streamline the interface during automated processes. In xlwings, you can get or set this property to control this behavior directly from your Python code.
Syntax in xlwings
The property is accessed through the app object, which represents the Excel Application. The syntax is straightforward:
app.display_paste_optionsThis property is a Boolean value. You can read it to check the current state or assign a value to change it.
- Getting the property:
current_state = app.display_paste_options - Setting the property:
app.display_paste_options = False(to hide the button) orapp.display_paste_options = True(to show the button).
Parameters and Values
The property does not take additional parameters. It simply accepts or returns a Boolean:
True: The Paste Options button will be displayed after a paste operation.False: The Paste Options button will not be displayed.
Code Examples
Here are practical examples using xlwings to work with the DisplayPasteOptions property:
- Check the Current Setting:
import xlwings as xw

# Connect to the active Excel instance
app = xw.apps.active

# Get the current state of DisplayPasteOptions
status = app.display_paste_options
print(f"Paste Options button is currently displayed: {status}")- Hide the Paste Options Button:
import xlwings as xw

# Start a new Excel instance (or connect to active)
app = xw.App(visible=True)

# Hide the Paste Options button
app.display_paste_options = False

# Now perform some paste operation (e.g., via Range.copy and Range.paste)
wb = app.books.add()
sheet = wb.sheets[0]
sheet.range('A1').value = 'Source Data'
sheet.range('A1').copy(sheet.range('B1'))
# After this paste, the Paste Options button will not appear

# Keep Excel open for observation
input("Press Enter to close...")
wb.close()
app.quit()- Toggle Based on Condition:
import xlwings as xw

app = xw.apps.active

# Suppose we want to hide the button only if a specific condition is met
if some_condition: # Replace with your actual condition
    app.display_paste_options = False
else:
    app.display_paste_options = True

# This allows dynamic control during a script's execution.How to use Application.DisplayNoteIndicator in the xlwings API way
The DisplayNoteIndicator property of the Application object in Excel is a setting that controls whether comment indicators (small red triangles) are displayed in cells that contain comments. This property is particularly useful for managing the visual clutter in a worksheet, especially when dealing with a large number of comments. By toggling this setting, users can choose to show or hide these indicators, which can improve readability and focus on the data itself. In xlwings, this property is accessed through the Application object, allowing for programmatic control over the display of comment indicators across the entire Excel application instance.
Syntax in xlwings:
app.display_note_indicatorThis property is a read/write Boolean value. When set to True, comment indicators are displayed in cells containing comments. When set to False, these indicators are hidden. Note that hiding the indicators does not delete the comments themselves; they remain accessible via other means, such as hovering over the cell (if enabled) or through the Review tab in the Excel interface.
Parameters:
The property does not accept parameters directly. It is a simple Boolean attribute that can be set or retrieved.
Example Usage:
Here is a practical example demonstrating how to use the DisplayNoteIndicator property in xlwings. This script connects to an existing Excel instance, toggles the display of comment indicators, and prints the current state.
import xlwings as xw

# Connect to the active Excel application
app = xw.apps.active

# Get the current state of DisplayNoteIndicator
current_setting = app.display_note_indicator
print(f"Current DisplayNoteIndicator setting: {current_setting}")

# Toggle the setting: if it's True, set to False, and vice versa
app.display_note_indicator = not current_setting
print(f"DisplayNoteIndicator toggled to: {app.display_note_indicator}")

# Example: Hide comment indicators
app.display_note_indicator = False
print("Comment indicators are now hidden.")

# Example: Show comment indicators
app.display_note_indicator = True
print("Comment indicators are now visible.")How To Create Jittered Scatter Plot Using xlwings? 2
【Example】

【Code】
import xlwings as xw
import numpy as np
import os

def set_style(cht):
    cht.ChartArea.Format.Line.Visible=False
    cht.PlotArea.Format.Fill.Visible = False
    cht.PlotArea.Format.Line.Visible = True
    cht.PlotArea.Format.Line.ForeColor.RGB=xw.utils.rgb_to_int((200,200,200))
    #cht.PlotArea.Format.Line.ForeColor.ObjectThemeColor = msoThemeColorText1
    ax1 = cht.Axes(1)
    ax2 = cht.Axes(2)
    ax1.HasTitle = True
    ax1.AxisTitle.Text = 'Categories'
    ax1.AxisTitle.Font.Size = 10
    ax1.TickLabels.Font.Size = 8
    #ax1.TickLabels.NumberFormat = '0.00'
    ax1.HasMajorGridlines = True
    ax2.HasTitle = True
    ax2.AxisTitle.Text = 'Values'
    ax2.AxisTitle.Font.Size = 10
    ax2.TickLabels.Font.Size = 8
    ax2.HasMajorGridlines = True
    cht.HasTitle = True
    #cht.ChartTitle.Caption = 'Plot'
    #cht.ChartTitle.Font.Size = 12
    cht.HasLegend=False

root=os.getcwd()
app=xw.App(visible=True,add_book=False)
wb=app.books.open(root+r'/data.xlsx',read_only=False)
sht=wb.sheets('Sheet1')

#sht.api.Range('A1:B7').Select()  #数据
shp=sht.api.Shapes.AddChart2()
shp.Left=20
cht=shp.Chart  #添加图表
cht.ChartType=xw.constants.ChartType.xlXYScatter
ax1=cht.Axes(1)
ax2=cht.Axes(2)
ax1.MinimumScale=0.5
ax1.MaximumScale=4.5
ax2.MinimumScale=0
ax2.MaximumScale=0.35

set_style(cht)

data=sht.range('B2:E21').value
rd=[0 for _ in range(20)]
y=[0 for _ in range(20)]
for i in range(4):
    cht.SeriesCollection().NewSeries()
    for j in range(20):
        rd[j]=i+0.75+0.5*np.random.rand(1)[0]
        y[j]=data[j][i]
    cht.SeriesCollection(i+1).XValues=rd
    cht.SeriesCollection(i+1).Values=y

cht.Export(root+'/cht.jpg')
cht.Export(root+'/cht.svg')
cht.ExportAsFixedFormat(0,root+'/cht.pdf')

#wb.save()
#app.kill()
How to use Application.DisplayInsertOptions in the xlwings API way
The DisplayInsertOptions property of the Application object in Excel is a boolean setting that controls whether Excel displays the “Insert Options” button. This button appears when you insert cells, rows, or columns into a worksheet, offering a small drop-down menu with formatting choices (like “Format Same As Left” or “Clear Formatting”) to quickly adjust the formatting of the newly inserted cells. By default, this feature is enabled in Excel. Using the xlwings API, you can programmatically check the current state of this setting or turn it on or off, which can be useful for creating a cleaner user interface during automated processes or for ensuring consistent behavior in your macros.
Syntax in xlwings:
The property is accessed through the app object, which represents the Excel application.
app.display_insert_optionsThis property is both readable and writable. It expects a boolean value (True or False).
- Getting the current value:
current_state = app.display_insert_options - Setting the value:
app.display_insert_options = False
Parameters:
The property itself does not take parameters. When setting it, you assign a boolean value directly.
Code Examples:
- Checking the Current Setting:
This code checks if the Insert Options button is currently enabled and prints its status.
import xlwings as xw

# Connect to the active Excel instance
app = xw.apps.active

# Get the current state of DisplayInsertOptions
is_enabled = app.display_insert_options
print(f"The 'Insert Options' button is currently enabled: {is_enabled}")

# Optional: Close the connection
app.quit()- Disabling the Insert Options Button:
This script turns off the display of the Insert Options button. This is often done at the start of an automation script to prevent the button from appearing and potentially interfering with the visual flow of the macro.
import xlwings as xw

app = xw.apps.active

# Disable the Insert Options button
app.display_insert_options = False
print("Insert Options button has been disabled.")

# ... Perform other tasks like inserting rows/cells ...
# Example: Insert a row at the top of the active sheet
app.books.active.sheets.active.range('1:1').insert()

# Remember to re-enable it if desired for the user later
# app.display_insert_options = True- Toggling the Setting Based on a Condition:
This example shows a more practical use case where you might store the original setting, change it for your operations, and then restore it afterwards, ensuring the user’s preference is maintained.
import xlwings as xw

def run_clean_insertion():
app = xw.apps.active
original_setting = app.display_insert_options # Store original state

try:
    app.display_insert_options = False # Turn off for our operations

    # Perform a series of insertions without the button appearing
    sheet = app.books.active.sheets.active
    sheet.range('A5').insert('down') # Insert a cell, shifting down
    sheet.range('C:C').insert() # Insert a column

finally:
    app.display_insert_options = original_setting # Restore original state
    print(f"Insert Options setting restored to: {original_setting}")

if __name__ == '__main__':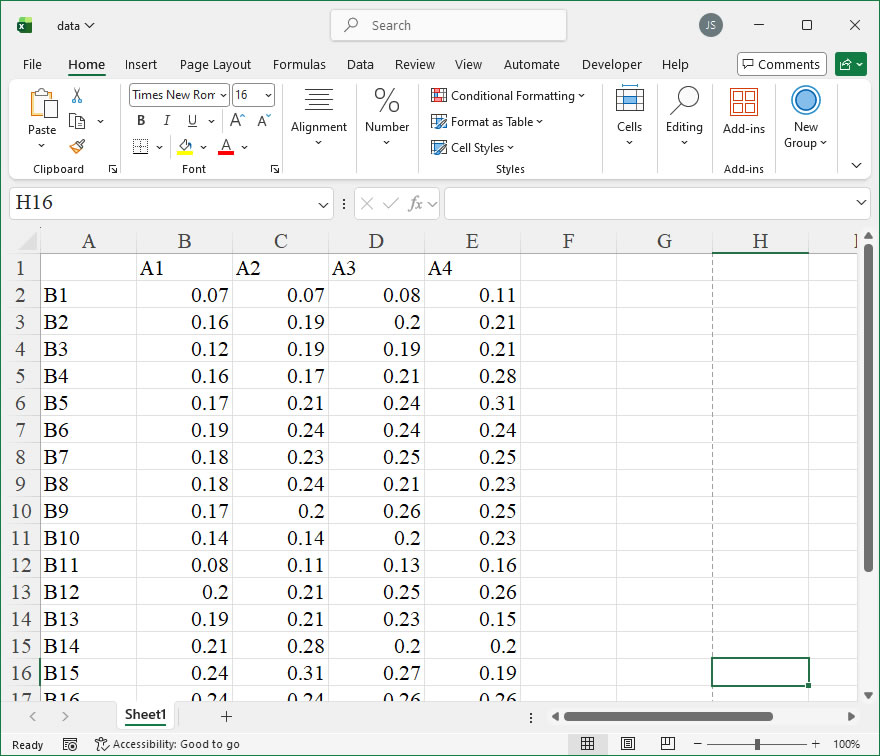
run_clean_insertion()How To Create Jittered Scatter Plot Using xlwings?
【Example】
【Code】
import xlwings as xw
import os

def set_style(cht):
    cht.ChartArea.Format.Line.Visible=False
    cht.PlotArea.Format.Fill.Visible = False
    cht.PlotArea.Format.Line.Visible = True
    cht.PlotArea.Format.Line.ForeColor.RGB=xw.utils.rgb_to_int((200,200,200))
    #cht.PlotArea.Format.Line.ForeColor.ObjectThemeColor = msoThemeColorText1
    ax1 = cht.Axes(1)
    ax2 = cht.Axes(2)
    ax1.HasTitle = True
    ax1.AxisTitle.Text = 'Categories'
    ax1.AxisTitle.Font.Size = 10
    ax1.TickLabels.Font.Size = 8
    #ax1.TickLabels.NumberFormat = '0.00'
    ax1.HasMajorGridlines = True
    ax2.HasTitle = True
    ax2.AxisTitle.Text = 'Values'
    ax2.AxisTitle.Font.Size = 10
    ax2.TickLabels.Font.Size = 8
    ax2.HasMajorGridlines = True
    cht.HasTitle = True
    #cht.ChartTitle.Caption = 'Plot'
    #cht.ChartTitle.Font.Size = 12
    cht.HasLegend=False


root=os.getcwd()
app=xw.App(visible=True,add_book=False)
wb=app.books.open(root+r'/data.xlsx',read_only=False)
sht=wb.sheets('Sheet1')

#sht.api.Range('A1:B7').Select()  #数据
shp=sht.api.Shapes.AddChart2()
shp.Left=20
cht=shp.Chart  #添加图表
cht.ChartType=xw.constants.ChartType.xlXYScatter
ax1=cht.Axes(1)
ax2=cht.Axes(2)
ax1.MinimumScale=0.5
ax1.MaximumScale=4.5
ax2.MinimumScale=0
ax2.MaximumScale=0.35

set_style(cht)

data=sht.range('B2:E21').value
rd=[0 for _ in range(20)]
y=[0 for _ in range(20)]
for i in range(4):
    cht.SeriesCollection().NewSeries()
    for j in range(20):
        rd[j]=i+1
        y[j]=data[j][i]
    cht.SeriesCollection(i+1).XValues=rd
    cht.SeriesCollection(i+1).Values=y

cht.Export(root+'/cht.jpg')
cht.Export(root+'/cht.svg')
cht.ExportAsFixedFormat(0,root+'/cht.pdf')

#wb.save()
#app.kill()
How to use Application.DisplayFunctionToolTips in the xlwings API way
Functionality
The DisplayFunctionToolTips property of the Excel Application object controls whether function tooltips are displayed. A function tooltip is the small, yellow pop-up box that appears as you begin typing a function into a formula bar or a cell. It provides a brief syntax guide and description for the function’s arguments. When DisplayFunctionToolTips is set to True, these helpful prompts are shown; when set to False, they are suppressed. This property is part of the user interface customization options and can be useful for streamlining the Excel environment for advanced users or in automated applications where pop-ups might interfere with other processes.
Syntax
In xlwings, you access this property through the Application object. The property is a read/write Boolean.
- Get the current state:
current_state = xw.apps[app_key].display_function_tooltipsapp_key: The key identifier for the Excel application instance. This can be an integer index (e.g.,0for the first instance) or the PID of the process. If you have a single instance or are usingxw.Book, you can often usexw.apps.active.- Set the state:
xw.apps[app_key].display_function_tooltips = new_statenew_state: A Boolean value (TrueorFalse).
Code Examples
- Checking and Reporting the Current Setting:
This example connects to the active Excel instance, reads the currentDisplayFunctionToolTipssetting, and prints its status.
import xlwings as xw

# Connect to the active Excel application
app = xw.apps.active

# Get the current state of function tooltips
tooltips_enabled = app.display_function_tooltips

# Report the status
if tooltips_enabled:
    print("Function tooltips are currently ENABLED.")
else:
print("Function tooltips are currently DISABLED.")- Temporarily Disabling Tooltips for a Task:
This pattern is useful when performing automated data entry or manipulation where pop-ups are not needed. It saves the original state, disables tooltips, performs its task, and then restores the original setting, ensuring the user’s preference is maintained.
import xlwings as xw

# Connect to the active Excel application and workbook
app = xw.apps.active
wb = app.books.active

# 1. Store the original setting
original_setting = app.display_function_tooltips

try:
    # 2. Disable function tooltips
    app.display_function_tooltips = False
    print("Function tooltips disabled for automation.")

    # 3. Perform automated tasks (e.g., writing formulas)
    # This example writes a simple SUM formula. No tooltip will appear.
    ws = wb.sheets[0]
    ws.range("A1").value = "Data"
    ws.range("B1").value = 10
    ws.range("B2").value = 20
    ws.range("B3").formula = "=SUM(B1:B2)"

    print(f"Formula written to B3: {ws.range('B3').formula}")

finally:
    # 4. Restore the original setting reliably
    app.display_function_tooltips = original_setting
print(f"Function tooltips restored to: {original_setting}")- Ensuring Tooltips are Enabled for User Interaction:
This example explicitly enables function tooltips, which can be part of a setup routine to ensure a user-friendly environment before handing control over to a person.
import xlwings as xw

# Start or connect to Excel
app = xw.App(visible=True) # or xw.apps.active
wb = app.books.add()

# Ensure function tooltips are turned ON
app.display_function_tooltips = True
print("Function tooltips have been enabled for user interaction.")

# Guide the user (simulated here by a formula placeholder)
ws = wb.sheets[0]
ws.range("A1").value = "Enter a function (e.g., =VLOOKUP() ) in cell B1 to see the tooltip."

# The application is now ready. Tooltips will appear as the user types.
# app.visible = True # Ensure Excel is visible if it wasn't already