Blog
How To Create Univariate Histogram Using xlwings?
【Example】
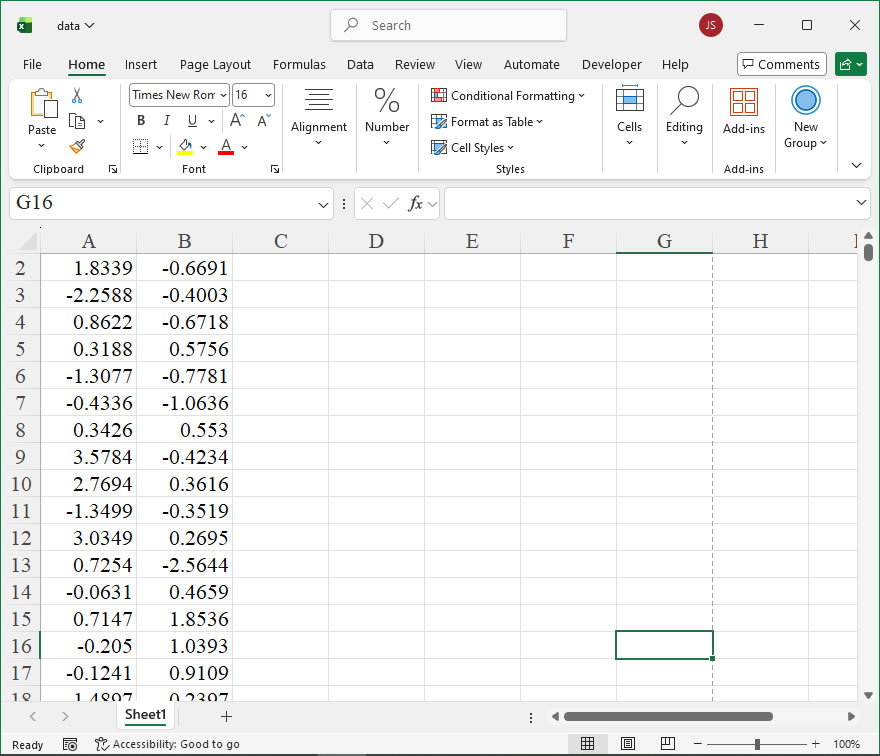
【Code】
import xlwings as xw
import os

def set_style(cht):
    cht.ChartArea.Format.Line.Visible=False
    cht.PlotArea.Format.Fill.Visible = False
    cht.PlotArea.Format.Line.Visible = True
    cht.PlotArea.Format.Line.ForeColor.RGB=xw.utils.rgb_to_int((200,200,200))
    #cht.PlotArea.Format.Line.ForeColor.ObjectThemeColor = msoThemeColorText1
    ax1 = cht.Axes(1)
    ax2 = cht.Axes(2)
    ax1.HasTitle = True
    ax1.AxisTitle.Text = 'Categories'
    ax1.AxisTitle.Font.Size = 10
    ax1.TickLabels.Font.Size = 8
    ax1.TickLabels.NumberFormat = '0.00'
    ax1.HasMajorGridlines = False
    ax2.HasTitle = True
    ax2.AxisTitle.Text = 'Values'
    ax2.AxisTitle.Font.Size = 10
    ax2.TickLabels.Font.Size = 8
    ax2.HasMajorGridlines = False
    cht.HasTitle = True
    #cht.ChartTitle.Caption = 'Plot'
    #cht.ChartTitle.Font.Size = 12

def draw_hist(sht,n):
    #频数分析
    x=sht.range('A1:A1000').value
    xi=[0 for _ in range(11)]
    xi2=[0 for _ in range(10)]
    count=[0 for _ in range(10)]
    bx=10
    minx=9999
    maxx=-9999
    for i in range(n):
        if minx>x[i]:
            minx=x[i]
        if maxx<x[i]:
            maxx=x[i]
    difx=maxx-minx
    stepx=difx/bx
    for i in range(10):
        count[i]=0
    xi[0]=minx
    xi2[0]=minx+stepx/2
    for i in range(1,11):
        xi[i]=xi[i-1]+stepx
        if i!=10:
            xi2[i]=xi[i]+stepx/2
    for i in range(n):
        for j in range(10):
            if x[i]>=xi[j] and x[i]<xi[j+1]:
                count[j]+=1

    #根据频数绘制直方图
    sht.api.Range('D3').Select()
    shp=sht.api.Shapes.AddChart2()
    shp.Left=20
    cht=shp.Chart
    for i in range(cht.SeriesCollection().Count,0,-1):
        cht.SeriesCollection(i).Delete()

    cht.SeriesCollection().NewSeries()
    cht.SeriesCollection(1).ChartType=xw.constants.ChartType.xlColumnClustered
    cht.SeriesCollection(1).XValues=xi2
    cht.SeriesCollection(1).Values=count
    cht.ChartGroups(1).GapWidth=0
    cht.GapDepth=0

    fl=cht.SeriesCollection(1).Format.Fill
    fl.ForeColor.ObjectThemeColor=5    #msoThemeColorAccent1
    #fl.ForeColor.TintAndShade=0
    fl.ForeColor.Brightness=0
    fl.Solid()

    ln=cht.SeriesCollection(1).Format.Line
    ln.Visible=True
    ln.ForeColor.ObjectThemeColor=13    #msoThemeColorText1
    #ln.ForeColor.TintAndShade=0
    ln.ForeColor.Brightness=0.0500000007

    return cht

root=os.getcwd()
app=xw.App(visible=True,add_book=False)
wb=app.books.open(root+r'/data.xlsx',read_only=False)
sht=wb.sheets('Sheet1')
cht=draw_hist(sht,1000)
set_style(cht)

cht.Export(root+'/cht.jpg')
cht.Export(root+'/cht.svg')
cht.ExportAsFixedFormat(0,root+'/cht.pdf')

#wb.save()
#app.kill()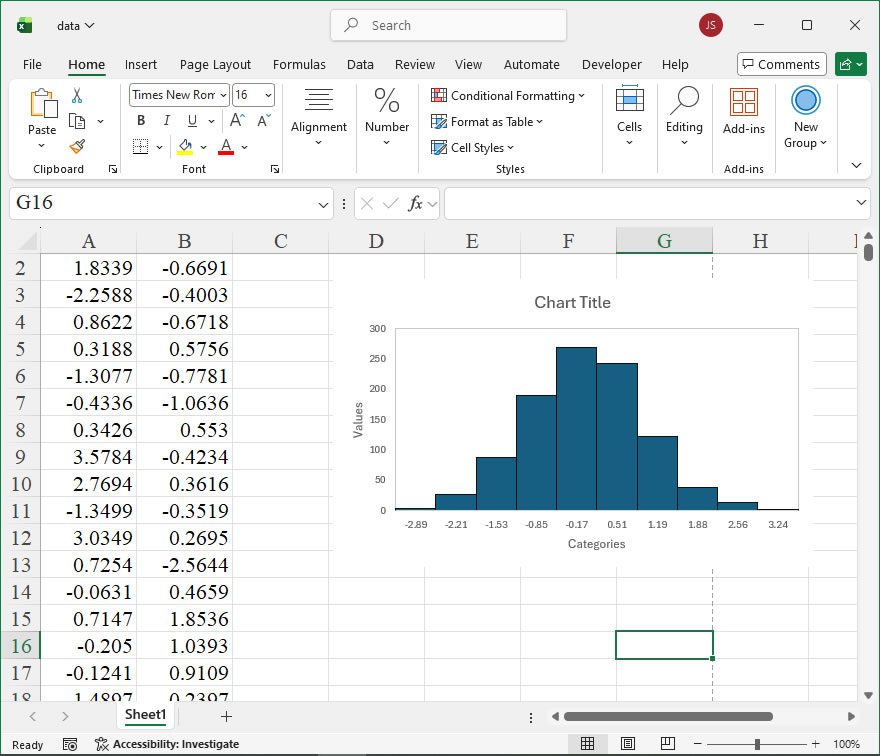
How to use Application.DisplayAlerts in the xlwings API way
The DisplayAlerts property of the Application object in Excel is a crucial setting for controlling how Excel handles user prompts and alert messages during automated operations. When automating tasks with xlwings, managing these alerts can significantly streamline your code by preventing interruptions that require manual responses. By setting DisplayAlerts to False, you can suppress common dialog boxes—such as those asking for confirmation to save changes, overwrite files, or delete sheets—allowing your script to run uninterrupted. This is particularly useful in batch processing or when integrating Excel automation into larger workflows where user interaction is not desired. However, it’s important to use this property judiciously; turning off alerts means Excel will take default actions without warning, which could lead to unintended data loss if not handled carefully. Always ensure your code includes proper error handling and saving logic when DisplayAlerts is disabled.
In xlwings, you can access the DisplayAlerts property through the App object, which represents the Excel application. The syntax for setting or getting this property is straightforward. To set it, you assign a boolean value; to retrieve the current state, you simply read the property. The property accepts True or False values, where True enables alerts (the default Excel behavior) and False disables them. There are no additional parameters required. For reference:
- Property Type: Read/write boolean.
- Default Value:
True(alerts are displayed). - Usage: Control the display of alert messages and prompts.
Here is the basic xlwings API call format:
import xlwings as xw

# Connect to an existing Excel instance or start a new one
app = xw.apps.active # Or use xw.App() for a new instance

# Disable alerts
app.display_alerts = False

# Enable alerts
app.display_alerts = True

# Check the current status
current_status = app.display_alerts
print(f"DisplayAlerts is set to: {current_status}")
Below are practical examples demonstrating the use of DisplayAlerts in xlwings:
Example 1: Suppressing Save Prompts
When closing a workbook without saving, Excel typically prompts the user to save changes. By disabling alerts, you can avoid this prompt and close the workbook directly. This example opens a workbook, makes a change, and closes it without saving, using DisplayAlerts to bypass the confirmation dialog.
import xlwings as xw

# Start Excel and open a workbook
app = xw.App(visible=False) # Run in background
wb = app.books.open('example.xlsx')

# Disable alerts to suppress save prompts
app.display_alerts = False

# Modify the workbook (e.g., write a value)
wb.sheets[0].range('A1').value = 'Test'

# Close without saving; no prompt will appear
wb.close()

# Re-enable alerts if needed for subsequent operations
app.display_alerts = True
app.quit()
Example 2: Overwriting Files Without Confirmation
When saving a workbook with SaveAs to an existing file, Excel usually asks for confirmation to overwrite. Setting DisplayAlerts to False allows the overwrite to occur silently. This example saves a workbook to a path that may already have a file, ensuring no interruption.
import xlwings as xw

# Connect to an active Excel instance
app = xw.apps.active
wb = app.books.active

# Turn off alerts to avoid overwrite confirmation
app.display_alerts = False

# Save to a location; if file exists, it will be overwritten automatically
wb.save(r'C:\path\to\existing_file.xlsx')

# Restore alert display
app.display_alerts = True
Example 3: Deleting Sheets Without Warning
Excel prompts for confirmation when deleting a worksheet. With DisplayAlerts disabled, the sheet deletion proceeds without user intervention. This example removes a specific sheet from a workbook seamlessly.
import xlwings as xw

# Access the current Excel application
app = xw.apps.active
wb = app.books.active

# Disable alerts to suppress delete confirmation
app.display_alerts = False

# Delete a sheet by name; no dialog will pop up
if 'SheetToDelete' in [sheet.name for sheet in wb.sheets]:
    wb.sheets['SheetToDelete'].delete()

# Re-enable alerts after the operation
app.display_alerts = TrueHow To Create Lollipop Plot Using xlwings?
【Example】
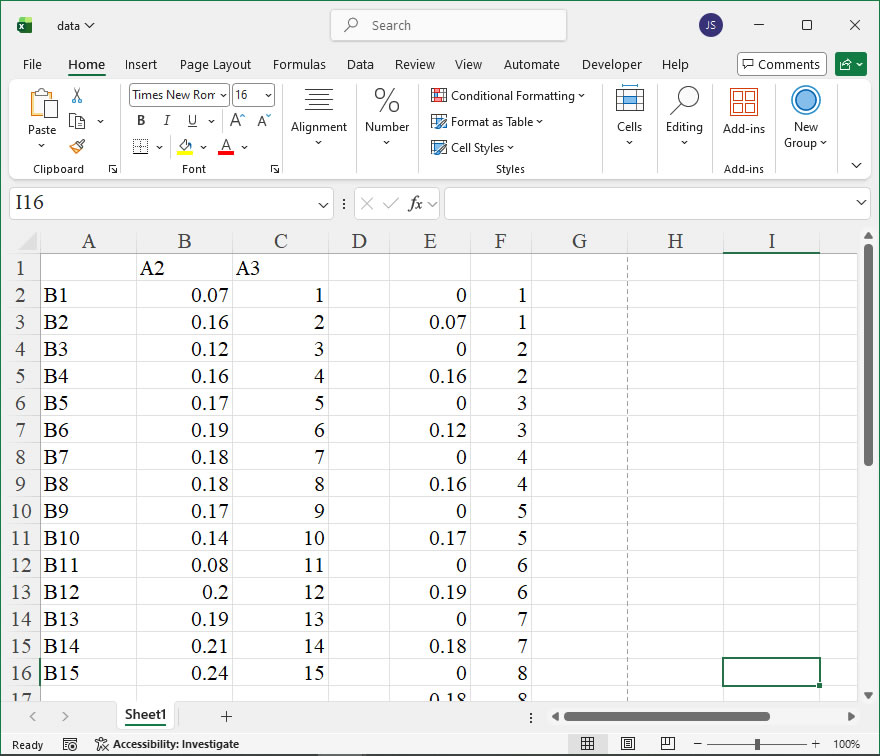
【Code】
import xlwings as xw
import numpy as np
import os

def set_style(cht):
    cht.ChartArea.Format.Line.Visible=False
    cht.PlotArea.Format.Fill.Visible = False
    cht.PlotArea.Format.Line.Visible = True
    cht.PlotArea.Format.Line.ForeColor.RGB=xw.utils.rgb_to_int((200,200,200))
    #cht.PlotArea.Format.Line.ForeColor.ObjectThemeColor = msoThemeColorText1
    ax1 = cht.Axes(1)
    ax2 = cht.Axes(2)
    ax1.HasTitle = True
    ax1.AxisTitle.Text = 'Values'
    ax1.AxisTitle.Font.Size = 10
    ax1.TickLabels.Font.Size = 8
    #ax1.TickLabels.NumberFormat = '0.00'
    ax1.HasMajorGridlines = True
    ax1.HasMinorGridlines = True
    ax2.HasTitle = True
    ax2.AxisTitle.Text = 'Categories'
    ax2.AxisTitle.Font.Size = 10
    ax2.TickLabels.Font.Size = 8
    ax2.HasMajorGridlines = True
    ax2.HasMinorGridlines = True
    cht.HasTitle = True
    #cht.ChartTitle.Caption = 'Plot'
    #cht.ChartTitle.Font.Size = 12

def draw_rnd_scatter(cht,x,y,n,r,g,b):
    '''绘制散点图
    x: X坐标    y(0 to n-1): Y坐标
    '''
    ser=cht.SeriesCollection().NewSeries()
    ser.ChartType=xw.constants.ChartType.xlXYScatter
    ser.XValues=x
    ser.Values=y
    ser.Format.Line.ForeColor.RGB=xw.utils.rgb_to_int((0,0,0))
    ser.Format.Fill.ForeColor.RGB=xw.utils.rgb_to_int((r,g,b))
    ser.MarkerSize=22
    for i in range(n):
        lf=shape_x(cht,x[i]-0.04)
        tp=shape_y(cht,y[i]+0.3)
        wd=cht.PlotArea.InsideWidth/(cht.Axes(1).MaximumScale-cht.Axes(1).MinimumScale)*0.08
        ht=cht.PlotArea.InsideHeight/(cht.Axes(2).MaximumScale-cht.Axes(2).MinimumScale)*0.6
        shp=cht.Shapes.AddLabel(1,lf,tp,wd,ht)
        shp.TextFrame2.TextRange.Characters.Text=str(x[i])
        shp.TextFrame2.TextRange.Characters.Font.Size=8
        shp.TextFrame.HorizontalAlignment=xw.constants.HAlign.xlHAlignCenter
        shp.TextFrame.VerticalAlignment=xw.constants.VAlign.xlVAlignCenter


root=os.getcwd()
app=xw.App(visible=True,add_book=False)
wb=app.books.open(root+r'/data.xlsx',read_only=False)
sht=wb.sheets('Sheet1')

shp=sht.api.Shapes.AddChart2()
shp.Left=20
shp.Top=20
shp.Width=220
shp.Height=320
cht=shp.Chart    #添加图表
cht.ChartType=xw.constants.ChartType.xlXYScatter
ax1=cht.Axes(1)
ax2=cht.Axes(2)
ax1.MinimumScale=0
ax1.MaximumScale=0.28
ax2.MinimumScale=0
ax2.MaximumScale=11

set_style(cht)

data=sht.range('B2:C11').value
dt=np.transpose(data)
dt1=dt[0]
dt2=dt[1]

#绘线形图
for i in range(10):
    ser=cht.SeriesCollection().NewSeries()
    ser.ChartType=xw.constants.ChartType.xlXYScatterLinesNoMarkers
    ser.XValues=[0,dt1[i]]
    ser.Values=[dt2[i],dt2[i]]
    ser.Format.Line.ForeColor.RGB=xw.utils.rgb_to_int((0,0,255))
    ser.Format.Line.Weight=1

#绘散点图
draw_rnd_scatter(cht,dt1,dt2,10,255,128,0)

cht.HasLegend=False

cht.Export(root+'/cht.jpg')
cht.Export(root+'/cht.svg')
cht.ExportAsFixedFormat(0,root+'/cht.pdf')

#wb.save()
#app.kill()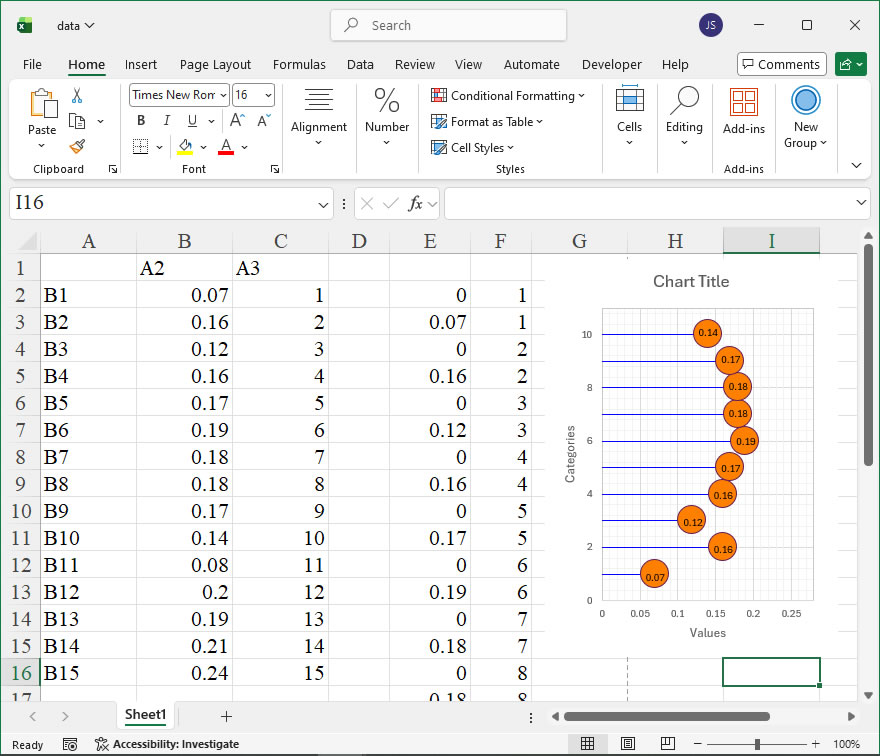
How to use Application.Dialogs in the xlwings API way
The Dialogs member of the Application object in xlwings provides programmatic access to many of Excel’s built-in dialog boxes. This feature allows developers to display standard Excel dialogs, retrieve user input from them, and execute the corresponding actions without manually interacting with the Excel interface. It is particularly useful for automating tasks that require user interaction in a familiar Excel dialog format, such as opening files, saving workbooks, or printing settings.
Functionality:
The Dialogs collection represents the various dialog boxes available in Excel. By using the Dialogs property, you can show a specific dialog, wait for user input, and then proceed based on the user’s actions. This can streamline workflows in automated scripts where some steps require manual input or confirmation via Excel’s native UI elements.
Syntax:
In xlwings, you access the Dialogs member through the Application object. The general syntax to show a dialog is:
app.api.Dialogs[Index].Show()Here, app is an xlwings App instance representing the Excel application. The api property provides access to the underlying Excel object model. Index is a constant or value that specifies which dialog to display. The Show() method displays the dialog and returns a Boolean value: True if the user clicks OK (or equivalent), and False if the user cancels or closes the dialog.
The Index parameter corresponds to Excel’s built-in dialog constants. In xlwings, you can use integer values or constants from the win32com.client.constants module if on Windows. For example, common dialog indices include:
1: Open dialog (xlDialogOpen)2: Save As dialog (xlDialogSaveAs)8: Print dialog (xlDialogPrint)9: Printer setup dialog (xlDialogPrinterSetup)54: Font dialog (xlDialogFont)
To find the index for a specific dialog, refer to Excel’s VBA object model documentation or use online resources listing Excel dialog constants.
Example Usage:
Below is an xlwings code example that demonstrates using the Dialogs member to display the Open and Print dialogs, handling user responses:
import xlwings as xw

# Connect to the active Excel instance or start a new one
app = xw.apps.active if xw.apps.active else xw.App()

try:
    # Show the Open dialog (Index = 1)
    result_open = app.api.Dialogs[1].Show()
    if result_open:
        print("User selected a file to open via the Open dialog.")
    else:
        print("User canceled the Open dialog.")

    # Show the Print dialog (Index = 8)
    result_print = app.api.Dialogs[8].Show()
    if result_print:
        print("User confirmed printing via the Print dialog.")
    else:
        print("User canceled the Print dialog.")

except Exception as e:
    print(f"An error occurred: {e}")

finally:
    # Ensure proper cleanup if needed
    if not xw.apps.active:
app.quit()How To Create Stem Chart Using xlwings?
【Example】
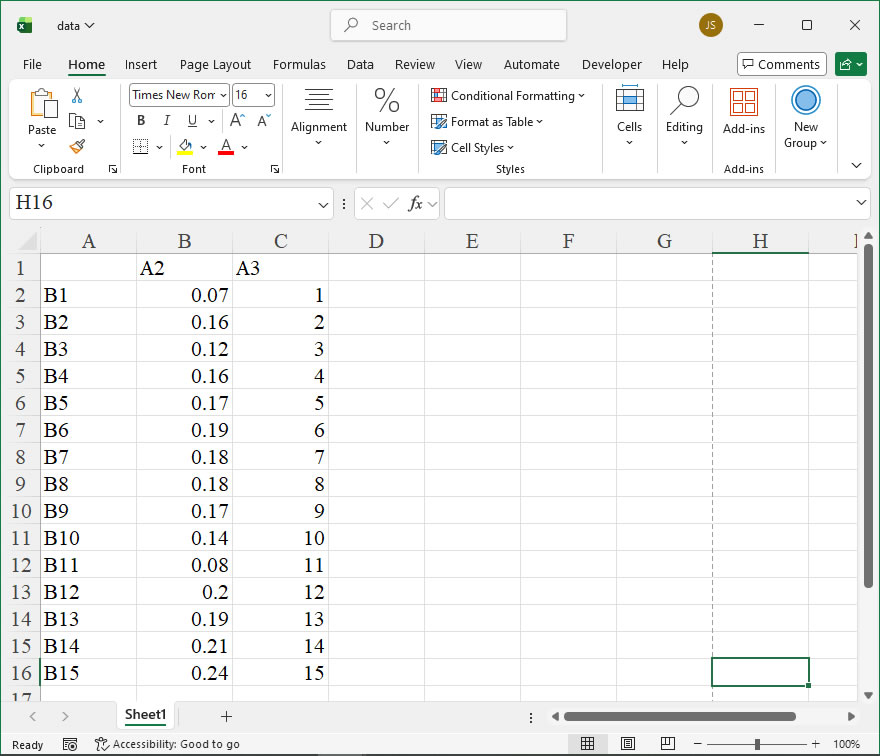
【Code】
import xlwings as xw
import numpy as np
import os

def set_style(cht):
    cht.ChartArea.Format.Line.Visible=False
    cht.PlotArea.Format.Fill.Visible = False
    cht.PlotArea.Format.Line.Visible = True
    cht.PlotArea.Format.Line.ForeColor.RGB=xw.utils.rgb_to_int((200,200,200))
    #cht.PlotArea.Format.Line.ForeColor.ObjectThemeColor = msoThemeColorText1
    ax1 = cht.Axes(1)
    ax2 = cht.Axes(2)
    ax1.HasTitle = True
    ax1.AxisTitle.Text = 'Values'
    ax1.AxisTitle.Font.Size = 10
    ax1.TickLabels.Font.Size = 8
    #ax1.TickLabels.NumberFormat = '0.00'
    ax1.HasMajorGridlines = True
    ax1.HasMinorGridlines = True
    ax2.HasTitle = True
    ax2.AxisTitle.Text = 'Categories'
    ax2.AxisTitle.Font.Size = 10
    ax2.TickLabels.Font.Size = 8
    ax2.HasMajorGridlines = True
    ax2.HasMinorGridlines = True
    cht.HasTitle = True
    #cht.ChartTitle.Caption = 'Plot'
    #cht.ChartTitle.Font.Size = 12

def draw_rnd_scatter(cht,x,y,r,g,b):
    '''绘制散点图
    x: X坐标    y(0 to n-1): Y坐标
    '''
    ser=cht.SeriesCollection().NewSeries()
    ser.ChartType=xw.constants.ChartType.xlXYScatter
    ser.XValues=x
    ser.Values=y
    ser.Format.Line.ForeColor.RGB=xw.utils.rgb_to_int((0,0,0))
    ser.Format.Fill.ForeColor.RGB=xw.utils.rgb_to_int((r,g,b))
    ser.MarkerSize=6


root=os.getcwd()
app=xw.App(visible=True,add_book=False)
wb=app.books.open(root+r'/data.xlsx',read_only=False)
sht=wb.sheets('Sheet1')

shp=sht.api.Shapes.AddChart2()
shp.Left=20
shp.Top=20
shp.Width=220
shp.Height=320
cht=shp.Chart    #添加图表
cht.ChartType=xw.constants.ChartType.xlXYScatter
ax1=cht.Axes(1)
ax2=cht.Axes(2)
ax1.MinimumScale=0
ax1.MaximumScale=0.3
ax2.MinimumScale=0
ax2.MaximumScale=16

set_style(cht)

data=sht.range('B2:C16').value
dt=np.transpose(data)
dt1=dt[0]
dt2=dt[1]

#绘线形图
for i in range(15):
    ser=cht.SeriesCollection().NewSeries()
    ser.ChartType=xw.constants.ChartType.xlXYScatterLinesNoMarkers
    ser.XValues=[0,dt1[i]]
    ser.Values=[dt2[i],dt2[i]]
    ser.Format.Line.ForeColor.RGB=xw.utils.rgb_to_int((0,0,255))
    ser.Format.Line.Weight=1

#绘散点图
draw_rnd_scatter(cht,dt1,dt2,0,0,255)

cht.HasLegend=False

cht.Export(root+'/cht.jpg')
cht.Export(root+'/cht.svg')
cht.ExportAsFixedFormat(0,root+'/cht.pdf')

#wb.save()
#app.kill()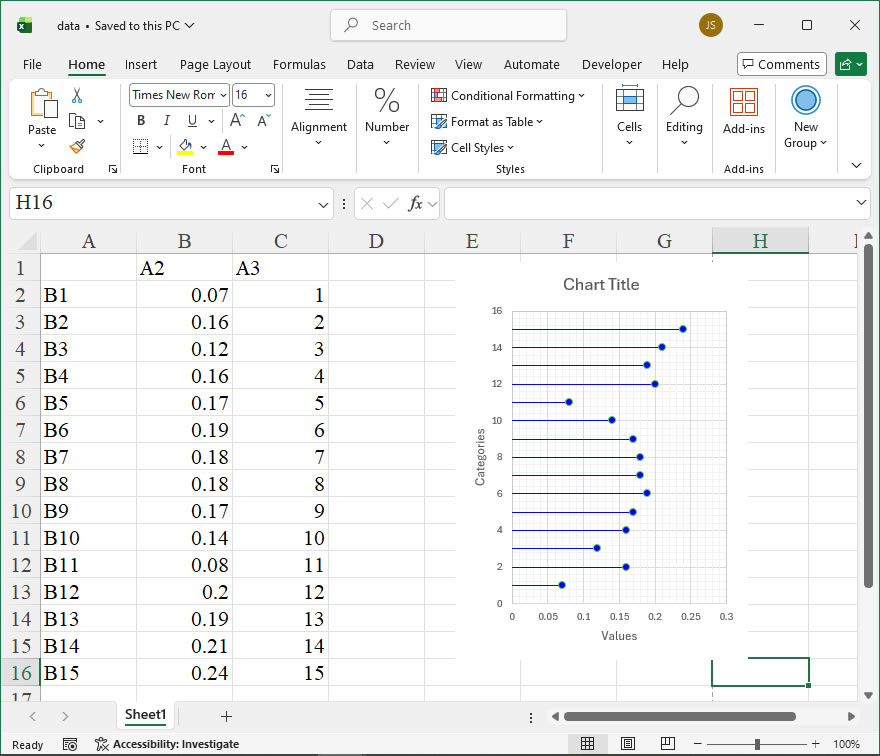
How to use Application.DeferAsyncQueries in the xlwings API way
The DeferAsyncQueries property of the Application object in Excel is a Boolean value that controls whether asynchronous queries (such as those from Power Query or external data connections) are deferred during the workbook’s opening process. When set to True, Excel postpones the execution of these queries until after the workbook has fully opened, which can significantly improve the initial load time, especially for workbooks with complex data connections. When set to False (the default), asynchronous queries run as usual during the opening sequence. This property is particularly useful for automating the opening of large workbooks in xlwings scripts, allowing you to manage performance and data refresh timing programmatically.
Syntax in xlwings:
The property is accessed through the xlwings App object, which represents the Excel Application. The syntax is straightforward:
app.api.DeferAsyncQueriesThis property is both readable and writable. You can assign a Boolean value (True or False) to it to change its state.
- Get the current value:
current_state = app.api.DeferAsyncQueries - Set the value:
app.api.DeferAsyncQueries = True
There are no parameters for this property itself. Its behavior is simply toggled by the Boolean assignment.
Code Example:
The following xlwings code demonstrates a practical use case. It opens a workbook with heavy external data connections, defers the queries to speed up the opening process, performs some other operations, and then manually triggers a refresh of all connections.
import xlwings as xw

# Start Excel application (visible for demonstration)
app = xw.App(visible=True)

# Enable deferral of asynchronous queries before opening the workbook
app.api.DeferAsyncQueries = True

# Open the target workbook
wb = app.books.open(r'C:\Path\To\Your\Large_Workbook.xlsx')

# At this point, the workbook is open, but queries are not yet run.
# Perform other operations, such as reading static data or writing formulas.
sheet = wb.sheets['Report']
summary_value = sheet.range('A1').value
print(f"Initial summary value: {summary_value}")

# Now, disable deferral and refresh all external data connections.
app.api.DeferAsyncQueries = False
wb.api.RefreshAll()

# Wait a moment for refresh to complete, then get updated data.
import time
time.sleep(5) # Simple pause; in production, consider checking query status.
updated_value = sheet.range('A1').value
print(f"Refreshed summary value: {updated_value}")

# Save and close
wb.save()
wb.close()
app.quit()How To Create Dumbbell Plot Using xlwings?
【Example】
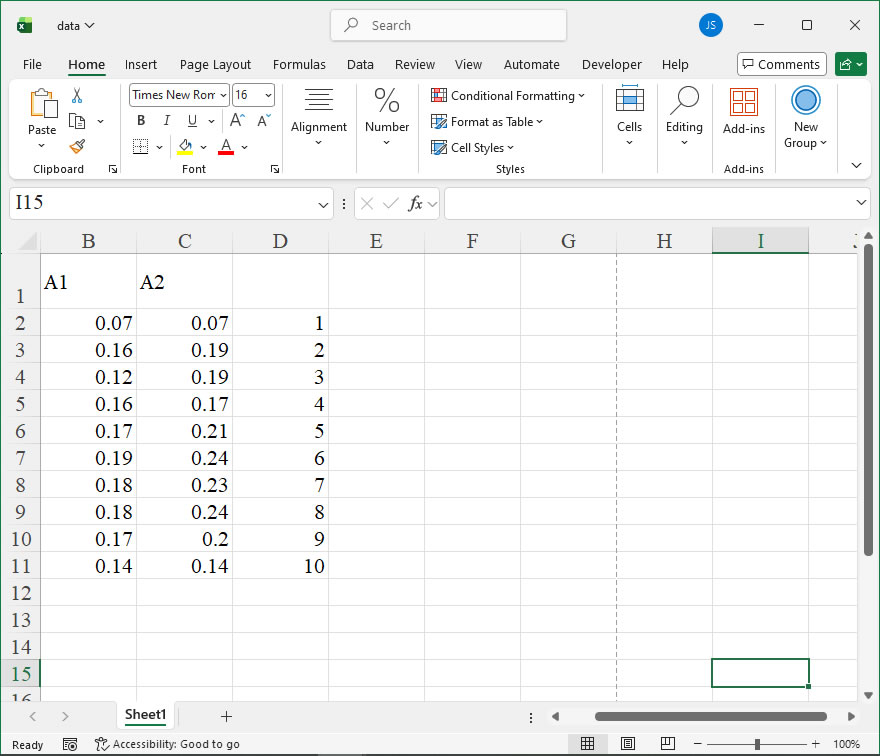
【Code】
import xlwings as xw
import numpy as np
import os

def set_style(cht):
    cht.ChartArea.Format.Line.Visible=False
    cht.PlotArea.Format.Fill.Visible = False
    cht.PlotArea.Format.Line.Visible = True
    cht.PlotArea.Format.Line.ForeColor.RGB=xw.utils.rgb_to_int((200,200,200))
    #cht.PlotArea.Format.Line.ForeColor.ObjectThemeColor = msoThemeColorText1
    ax1 = cht.Axes(1)
    ax2 = cht.Axes(2)
    ax1.HasTitle = True
    ax1.AxisTitle.Text = 'Values'
    ax1.AxisTitle.Font.Size = 10
    ax1.TickLabels.Font.Size = 8
    #ax1.TickLabels.NumberFormat = '0.00'
    ax1.HasMajorGridlines = True
    ax1.HasMinorGridlines = True
    ax2.HasTitle = True
    ax2.AxisTitle.Text = 'Categories'
    ax2.AxisTitle.Font.Size = 10
    ax2.TickLabels.Font.Size = 8
    ax2.HasMajorGridlines = True
    ax2.HasMinorGridlines = True
    cht.HasTitle = True
    #cht.ChartTitle.Caption = 'Plot'
    #cht.ChartTitle.Font.Size = 12

def draw_rnd_scatter(cht,x,y,r,g,b):
    '''绘制散点图
    x: X坐标    y(0 to n-1): Y坐标
    '''
    ser=cht.SeriesCollection().NewSeries()
    ser.ChartType=xw.constants.ChartType.xlXYScatter
    ser.XValues=x
    ser.Values=y
    ser.Format.Line.ForeColor.RGB=xw.utils.rgb_to_int((r,g,b))
    ser.Format.Fill.ForeColor.RGB=xw.utils.rgb_to_int((r,g,b))
    ser.MarkerSize=6


root=os.getcwd()
app=xw.App(visible=True,add_book=False)
wb=app.books.open(root+r'/data.xlsx',read_only=False)
sht=wb.sheets('Sheet1')

shp=sht.api.Shapes.AddChart2()
shp.Left=20
shp.Top=20
shp.Width=250
shp.Height=320
cht=shp.Chart    #添加图表
cht.ChartType=xw.constants.ChartType.xlXYScatter
ax1=cht.Axes(1)
ax2=cht.Axes(2)
ax1.MinimumScale=0
ax1.MaximumScale=0.25
ax2.MinimumScale=0
ax2.MaximumScale=11

set_style(cht)

data=sht.range('B2:D11').value
dt=np.transpose(data)
dt1=dt[0]
dt2=dt[1]
dt3=dt[2]

#绘线形图
for i in range(10):
    ser=cht.SeriesCollection().NewSeries()
    ser.ChartType=xw.constants.ChartType.xlXYScatterLinesNoMarkers
    ser.XValues=[dt1[i],dt2[i]]
    ser.Values=[dt3[i],dt3[i]]
    ser.Format.Line.ForeColor.RGB=xw.utils.rgb_to_int((0,0,255))
    ser.Format.Line.Weight=1.5

#绘散点图
draw_rnd_scatter(cht,dt1,dt3,0,0,255)
draw_rnd_scatter(cht,dt2,dt3,255,128,0)

cht.Export(root+'/cht.jpg')
cht.Export(root+'/cht.svg')
cht.ExportAsFixedFormat(0,root+'/cht.pdf')

#wb.save()
#app.kill()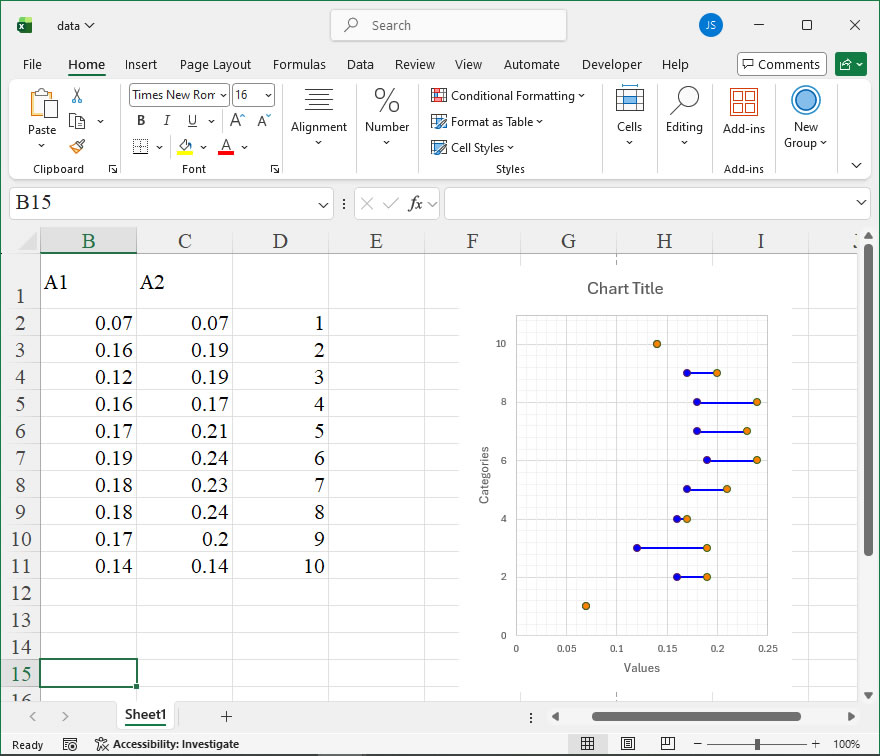
How to use Application.DefaultWebOptions in the xlwings API way
The Application.DefaultWebOptions property in Excel’s object model provides access to a DefaultWebOptions object, which contains global settings for how Excel handles web-related features, such as saving workbooks as web pages or interacting with web queries. Through xlwings, you can access and modify these settings to control the default behavior for web publishing, encoding, and other web-specific options. This is particularly useful when automating the generation of web content from Excel data or ensuring consistency in web output formats.
Functionality:
The DefaultWebOptions object allows you to set properties that affect web-related operations. Key properties include:
Encoding: Specifies the character encoding for web pages (e.g.,utf-8,gb2312).PixelsPerInch: Controls the screen resolution for images in web pages.OrganizeInFolder: Determines whether supporting files are saved in a separate folder when saving as a web page.TargetBrowser: Sets the target browser version for compatibility.DownloadComponents: Specifies whether to download Office Web Components.
Syntax in xlwings:
In xlwings, you access DefaultWebOptions via the Application object. Since xlwings uses the underlying Excel object model through COM, the syntax mirrors VBA but is adapted for Python. The general format is:
app = xw.apps.active # Get the active Excel application
web_options = app.api.DefaultWebOptions
Once you have the web_options object, you can get or set its properties. For example, to set the encoding:
web_options.Encoding = "utf-8"Note that DefaultWebOptions is a property, not a method, so it doesn’t take parameters directly. However, its properties may have specific values. For instance, TargetBrowser can be set using constants like xlBrowserV4 (for older browsers) or xlBrowserIE6 (for Internet Explorer 6). In xlwings, you can use the integer equivalents or import constants from win32com.client.constants if available.
Example Usage:
Here is a code example that demonstrates how to configure DefaultWebOptions using xlwings to prepare a workbook for web publishing. This script sets various properties and then saves the active workbook as a web page with the specified settings.
import xlwings as xw

# Connect to the active Excel application
app = xw.apps.active

# Access the DefaultWebOptions object
web_options = app.api.DefaultWebOptions

# Configure web properties
web_options.Encoding = "utf-8" # Set character encoding to UTF-8
web_options.PixelsPerInch = 96 # Set screen resolution for images
web_options.OrganizeInFolder = True # Save supporting files in a separate folder
web_options.TargetBrowser = 3 # Use constant for Internet Explorer 6 (value 3)
web_options.DownloadComponents = False # Disable downloading Office Web Components

# Save the active workbook as a web page with these settings
workbook = app.books.active
workbook.api.SaveAs(Filename="C:\\Output\\webpage.html", FileFormat=44) # FileFormat 44 is for web pageHow To Create Sliding Bead Chart Using xlwings? 3
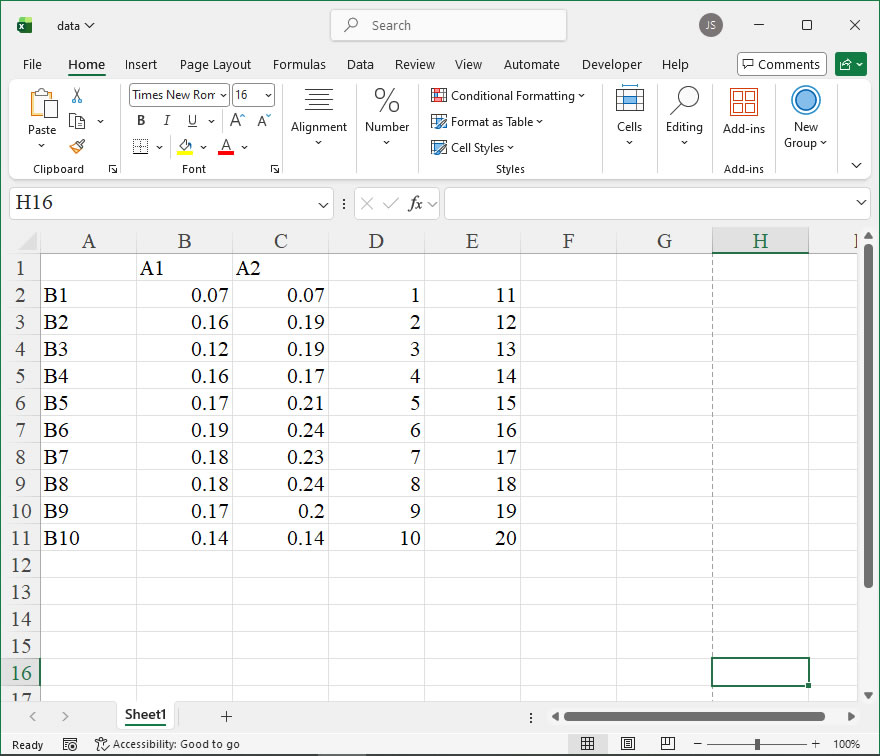
【Example】
【Code】
import xlwings as xw
import os

def set_style(cht):
    cht.ChartArea.Format.Line.Visible=False
    cht.PlotArea.Format.Fill.Visible = False
    cht.PlotArea.Format.Line.Visible = True
    cht.PlotArea.Format.Line.ForeColor.RGB=xw.utils.rgb_to_int((200,200,200))
    #cht.PlotArea.Format.Line.ForeColor.ObjectThemeColor = msoThemeColorText1
    ax1 = cht.Axes(1)
    ax2 = cht.Axes(2)
    ax1.HasTitle = True
    ax1.AxisTitle.Text = 'Categories'
    ax1.AxisTitle.Font.Size = 10
    ax1.TickLabels.Font.Size = 8
    #ax1.TickLabels.NumberFormat = '0.00'
    ax1.HasMajorGridlines = True
    ax1.HasMinorGridlines = True
    ax2.HasTitle = True
    ax2.AxisTitle.Text = 'Values'
    ax2.AxisTitle.Font.Size = 10
    ax2.TickLabels.Font.Size = 8
    ax2.HasMajorGridlines = True
    ax2.HasMinorGridlines = True
    cht.HasTitle = True
    #cht.ChartTitle.Caption = 'Plot'
    #cht.ChartTitle.Font.Size = 12

root=os.getcwd()
app=xw.App(visible=True,add_book=False)
wb=app.books.open(root+r'/data.xlsx',read_only=False)
sht=wb.sheets('Sheet1')

sht.api.Range('B2:C11').Select()  #数据
shp=sht.api.Shapes.AddChart2(-1, xw.constants.ChartType.xlXYScatter, 30, 20, 230, 380, True)
cht=shp.Chart  #添加图表

count=cht.SeriesCollection().Count
if count>0:
    for i in range(count,0,-1):
        cht.SeriesCollection(i).Delete()

cht.SeriesCollection().NewSeries()
cht.SeriesCollection(1).ChartType=xw.constants.ChartType.xlXYScatter
cht.SeriesCollection(1).XValues=sht.api.Range("B2:B11")
cht.SeriesCollection(1).Values=sht.api.Range("D2:D11")

cht.SeriesCollection().NewSeries()
cht.SeriesCollection(2).ChartType=xw.constants.ChartType.xlXYScatter
cht.SeriesCollection(2).XValues=sht.api.Range("C2:C11")
cht.SeriesCollection(2).Values=sht.api.Range("E2:E11")

cht.Axes(1).MinimumScale=0.04
cht.Axes(1).MaximumScale=0.28
cht.Axes(2).MinimumScale=0
cht.Axes(2).MaximumScale=21

set_style(cht)

cht.Export(root+'/cht.jpg')
cht.Export(root+'/cht.svg')
cht.ExportAsFixedFormat(0,root+'/cht.pdf')

#wb.save()
#app.kill()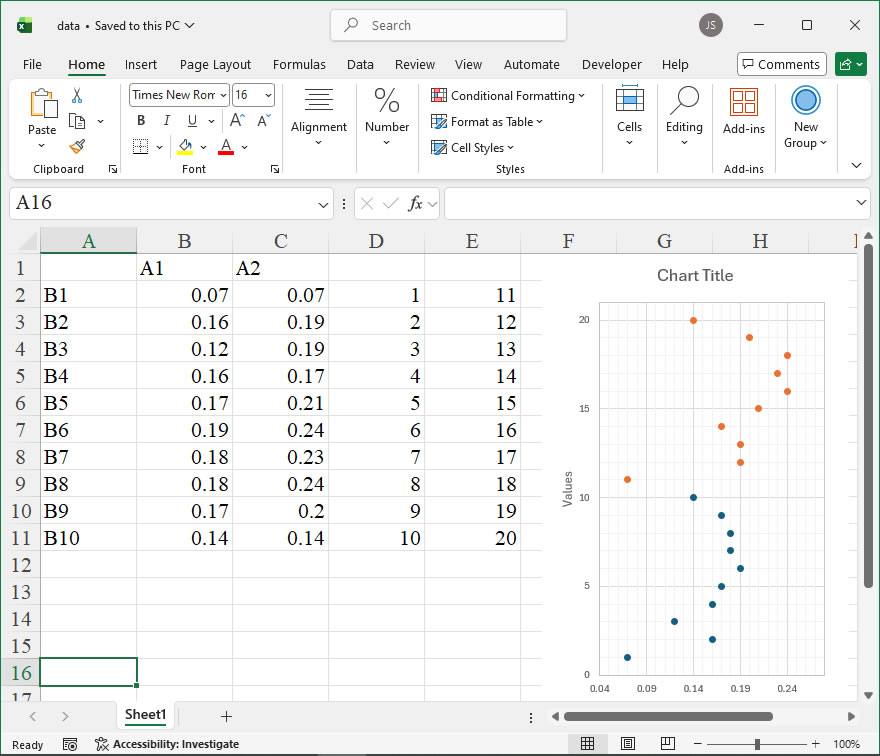
How to use Application.DefaultSheetDirection in the xlwings API way
The Application.DefaultSheetDirection property in Excel’s object model allows developers to set or retrieve the default direction in which new worksheets are laid out within a workbook. This property influences whether the sheet content is displayed from left-to-right (typical for languages like English) or right-to-left (common for languages such as Arabic or Hebrew). It is particularly useful in internationalized applications where the user interface must adapt to different reading orientations. In xlwings, this property can be accessed and modified through the api property of the App object, providing a programmatic way to control sheet direction directly from Python.
Syntax in xlwings:
app.api.DefaultSheetDirectionThis property is both readable and writable. It accepts integer values that correspond to specific direction settings:
xlLTR(value:-5003): Sets the default direction to left-to-right.xlRTL(value:-5004): Sets the default direction to right-to-left.
These constants are part of the Excel enumeration XlSheetDirection. In xlwings, you can use the integer values directly or import the constants from the win32com.client.constants module if working on Windows with COM support, though xlwings typically abstracts this. The property applies at the application level, meaning it affects all new workbooks and sheets created during the session until changed.
Code Examples:
- Reading the Current Default Sheet Direction:
import xlwings as xw
app = xw.App(visible=False)
current_direction = app.api.DefaultSheetDirection
print(f"Default sheet direction: {current_direction}") # Output: -5003 for left-to-right
app.quit()
This example retrieves the current setting, which defaults to left-to-right in most installations.
- Setting the Default Sheet Direction to Right-to-Left:
import xlwings as xw
app = xw.App(visible=False)
app.api.DefaultSheetDirection = -5004 # xlRTL for right-to-left
# Create a new workbook to see the effect
wb = app.books.add()
ws = wb.sheets[0]
print(f"New sheet direction set to: {app.api.DefaultSheetDirection}")
wb.save('right_to_left_sheet.xlsx')
app.quit()
After setting the property, any new worksheets will adopt the right-to-left layout, affecting text alignment and sheet navigation.
- Toggling Between Directions Based on User Input:
import xlwings as xw
def set_sheet_direction(direction='LTR'):
app = xw.App(visible=False)
if direction.upper() == 'RTL':
    app.api.DefaultSheetDirection = -5004
else:
    app.api.DefaultSheetDirection = -5003
    wb = app.books.add()
    print(f"Sheet direction configured for {direction}.")
app.quit()
set_sheet_direction('RTL')