Blog
How to use Application.DefaultSaveFormat in the xlwings API way
The Application.DefaultSaveFormat property in Excel’s object model is a read/write property that determines the default file format used when saving a new workbook. This property influences the file format (e.g., .xlsx, .xls, .csv) that Excel will default to in the “Save As” dialog for a new, unsaved workbook. It does not change the format of already saved workbooks. In xlwings, this property is accessed via the Application object, allowing automation scripts to programmatically set or retrieve the default save format, ensuring consistency in file operations across automated Excel processes.
Syntax in xlwings:
The property is accessed through the app object (an instance of xlwings’ App). The syntax is straightforward, as it maps directly to the Excel object model:
- To get the current default save format:
default_format = app.api.DefaultSaveFormat- To set a new default save format:
app.api.DefaultSaveFormat = format_valueHere, app refers to the xlwings App instance (e.g., app = xw.App() or xw.apps.active). The format_value is an integer corresponding to the Excel file format constant. xlwings uses the Excel object model’s constants, which can be referenced via the app.api interface. Common values include:
51: xlOpenXMLWorkbook (.xlsx, without macros)52: xlOpenXMLWorkbookMacroEnabled (.xlsm, with macros)50: xlExcel12 (Excel Binary Workbook .xlsb)6: xlCSV (CSV format)-4143: xlWorkbookNormal (legacy .xls format in older Excel versions)
These constants are part of the Excel enumerationXlFileFormat. In xlwings, you can use the integer values directly or, for clarity, define them as variables (e.g.,xlOpenXMLWorkbook = 51). Note that the property is specific to the Excel application instance, so changes apply to all workbooks under that instance.
Examples:
Below are practical xlwings API code examples demonstrating how to use the DefaultSaveFormat property.
- Retrieving the Current Default Save Format:
This example connects to the active Excel instance and prints the current default save format.
import xlwings as xw

# Connect to the active Excel application
app = xw.apps.active

# Get the default save format
current_format = app.api.DefaultSaveFormat
print(f"Current default save format value: {current_format}")
Output might show an integer like 51, indicating .xlsx is the default.
- Setting the Default Save Format to .xlsm:
This example sets the default save format to Excel Macro-Enabled Workbook (.xlsm) for new workbooks.
import xlwings as xw

# Start a new Excel instance (or use active)
app = xw.App(visible=False) # Run in background

# Define the format value for .xlsm
xlOpenXMLWorkbookMacroEnabled = 52

# Set the default save format
app.api.DefaultSaveFormat = xlOpenXMLWorkbookMacroEnabled

# Verify the change
print(f"Default save format set to: {app.api.DefaultSaveFormat}")

# Clean up: close the app without saving
app.quit()
After running this, any new workbook created in this Excel instance will default to .xlsm when saved for the first time.
- Using DefaultSaveFormat in a Workflow:
This example integrates DefaultSaveFormat into a script that creates a workbook and saves it, leveraging the default format.
import xlwings as xw

# Launch Excel and set default to CSV for data export tasks
app = xw.App(visible=True)
app.api.DefaultSaveFormat = 6 # xlCSV

# Add a new workbook
wb = app.books.add()
sheet = wb.sheets[0]
sheet.range('A1').value = [['Data', 'Value'], [1, 100], [2, 200]]

# Save the workbook; it will default to CSV in the Save As dialog
# Note: This property doesn't auto-save; it sets the dialog default.
wb.save('new_data') # User may see .csv as default in the dialog

# Close
wb.close()
app.quit()How To Create Sliding Bead Chart Using xlwings?
【Example】
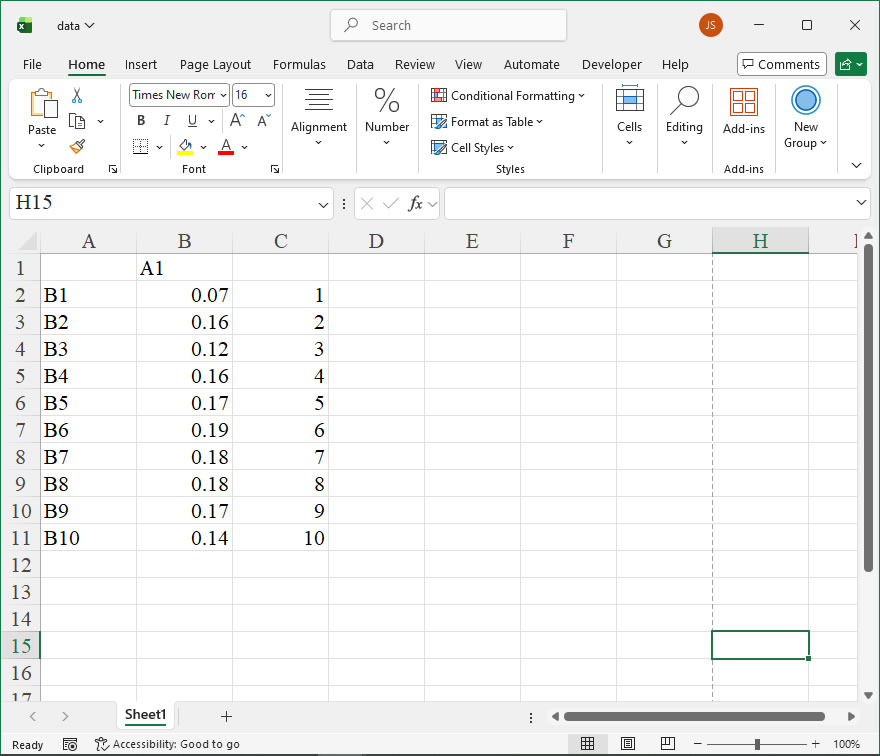
【Code】
import xlwings as xw
import os

def set_style(cht):
    cht.ChartArea.Format.Line.Visible=False
    cht.PlotArea.Format.Fill.Visible = False
    cht.PlotArea.Format.Line.Visible = True
    cht.PlotArea.Format.Line.ForeColor.RGB=xw.utils.rgb_to_int((200,200,200))
    #cht.PlotArea.Format.Line.ForeColor.ObjectThemeColor = msoThemeColorText1
    ax1 = cht.Axes(1)
    ax2 = cht.Axes(2)
    ax1.HasTitle = True
    ax1.AxisTitle.Text = 'Categories'
    ax1.AxisTitle.Font.Size = 10
    ax1.TickLabels.Font.Size = 8
    #ax1.TickLabels.NumberFormat = '0.00'
    ax1.HasMajorGridlines = True
    ax1.HasMinorGridlines = True
    ax2.HasTitle = True
    ax2.AxisTitle.Text = 'Values'
    ax2.AxisTitle.Font.Size = 10
    ax2.TickLabels.Font.Size = 8
    ax2.HasMajorGridlines = True
    ax2.HasMinorGridlines = True
    cht.HasTitle = True
    #cht.ChartTitle.Caption = 'Plot'
    #cht.ChartTitle.Font.Size = 12

root=os.getcwd()
app=xw.App(visible=True,add_book=False)
wb=app.books.open(root+r'/data.xlsx',read_only=False)
sht=wb.sheets('Sheet1')

sht.api.Range('B2:C11').Select()  #数据
shp=sht.api.Shapes.AddChart2(-1,xw.constants.ChartType.xlXYScatter,30,20,200,300,True)
cht=shp.Chart  #添加图表
cht.Axes(1).MinimumScale=0.04
cht.Axes(1).MaximumScale=0.22
cht.Axes(2).MinimumScale=0
cht.Axes(2).MaximumScale=11

set_style(cht)

cht.Export(root+'/cht.jpg')
cht.Export(root+'/cht.svg')
cht.ExportAsFixedFormat(0,root+'/cht.pdf')

#wb.save()
#app.kill()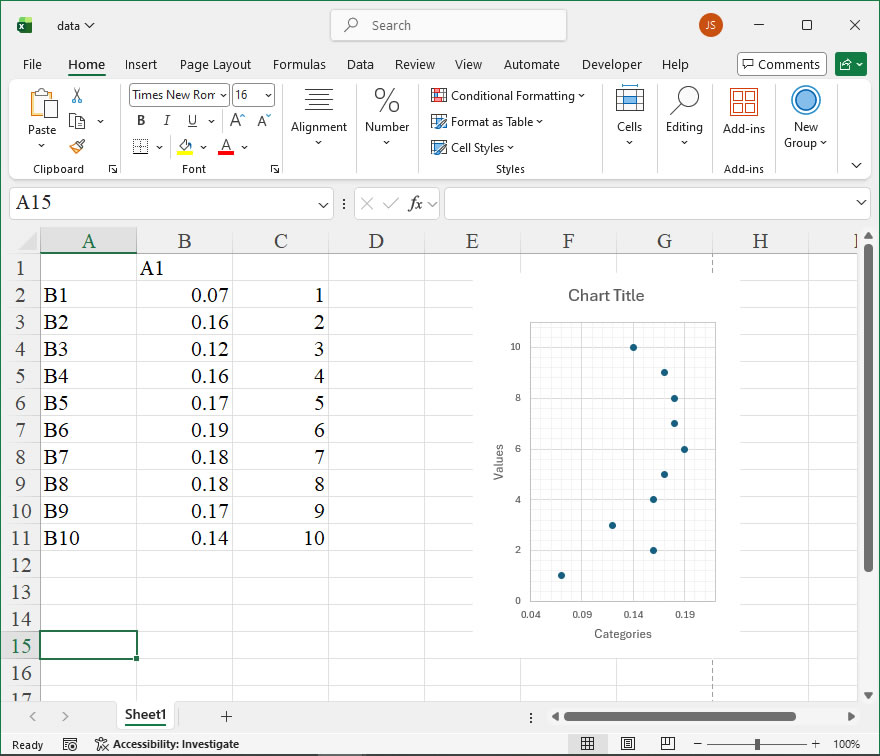
How to use Application.DefaultFilePath in the xlwings API way
The DefaultFilePath property of the Application object in Excel’s object model is a crucial setting for managing file paths. In xlwings, this property allows you to get or set the default folder path that Excel uses when opening or saving files through its standard dialog boxes. This is particularly useful for automating workflows where you need to ensure that Excel points to a specific directory by default, enhancing consistency and efficiency in file operations.
Functionality:
The DefaultFilePath property controls the initial directory displayed in the Open and Save As dialog boxes within Excel. By setting this property, you can direct users or automated scripts to a predefined location, reducing errors from manual navigation. It does not affect the current workbook’s path but influences the default behavior of Excel’s file dialogs.
Syntax in xlwings:
In xlwings, you access the DefaultFilePath property through the app object, which represents the Excel application. The syntax is straightforward:
- To get the current default file path:
app.api.DefaultFilePath - To set a new default file path:
app.api.DefaultFilePath = "your_path_here"
Here, app is an instance of xw.App in xlwings, and .api provides direct access to the underlying Excel object model. The property is a string representing the full path to the directory. For example, on Windows, it might look like "C:\\Users\\Username\\Documents". Ensure the path exists and is accessible; otherwise, setting it may cause errors.
Parameters:
The DefaultFilePath property does not take parameters directly. When setting it, assign a string value with the desired path. The path can be absolute or relative, but it’s recommended to use absolute paths for reliability. In Excel, this property corresponds to the setting found under File > Options > Save > Default local file location.
Code Examples:
Here are practical examples using xlwings to work with the DefaultFilePath property:
- Getting the current default file path:
import xlwings as xw

# Connect to the active Excel instance or start a new one
app = xw.apps.active if xw.apps.active else xw.App()
# Get the current default file path
current_path = app.api.DefaultFilePath
print(f"Current default file path: {current_path}")
# Close the app if it was started in this script
if not xw.apps.active:
app.quit()- Setting a new default file path:
import xlwings as xw

# Start a new Excel instance
app = xw.App(visible=False) # Run in background for automation
# Set the default file path to a specific directory
new_path = "C:\\MyProjects\\ExcelFiles"
app.api.DefaultFilePath = new_path
print(f"Default file path set to: {new_path}")
# Verify by getting the path again
verified_path = app.api.DefaultFilePath
print(f"Verified path: {verified_path}")
# Save or open a file to see the effect in dialogs (optional)
app.quit()- Using in a script to standardize file operations:
import xlwings as xw
import os

# Connect to Excel
app = xw.apps.active if xw.apps.active else xw.App(visible=False)
# Set default path to a project directory
project_dir = os.path.expanduser("~\\Documents\\MyExcelWork")
if not os.path.exists(project_dir):
    os.makedirs(project_dir) # Create directory if it doesn't exist
    app.api.DefaultFilePath = project_dir
    # Now, any Open or Save As dialog will start in this folder
    print(f"Default path configured for: {project_dir}")
# Example: Open a workbook (this would use the default path in dialog)
# wb = app.books.open('example.xlsx') # Uncomment to test
app.quit()How To Set Geometric Transformations of Images Using xlwings?
【Example】
【Code】
import xlwings as xw
import os

def set_style(cht):
    cht.ChartArea.Format.Line.Visible=False
    cht.PlotArea.Format.Fill.Visible = False
    cht.PlotArea.Format.Line.Visible = True
    cht.PlotArea.Format.Line.ForeColor.RGB=xw.utils.rgb_to_int((200,200,200))
    #cht.PlotArea.Format.Line.ForeColor.ObjectThemeColor = msoThemeColorText1
    ax1 = cht.Axes(1)
    ax2 = cht.Axes(2)
    ax1.HasTitle = True
    ax1.AxisTitle.Text = 'Categories'
    ax1.AxisTitle.Font.Size = 10
    ax1.TickLabels.Font.Size = 8
    #ax1.TickLabels.NumberFormat = '0.00'
    ax1.HasMajorGridlines = False
    ax2.HasTitle = True
    ax2.AxisTitle.Text = 'Values'
    ax2.AxisTitle.Font.Size = 10
    ax2.TickLabels.Font.Size = 8
    ax2.HasMajorGridlines = False
    cht.HasTitle = True
    #cht.ChartTitle.Caption = 'Plot'
    #cht.ChartTitle.Font.Size = 12

root=os.getcwd()
app=xw.App(visible=True,add_book=False)
wb=app.books.open(root+r'/data.xlsx',read_only=False)
sht=wb.sheets('Sheet1')

shp=sht.api.Shapes.AddChart2()
shp.Left=20
cht=shp.Chart
cht.ChartType=xw.constants.ChartType.xlXYScatter
ax1=cht.Axes(1)
ax2=cht.Axes(2)
ax1.MinimumScale=0
ax1.MaximumScale=250
ax2.MinimumScale=0
ax2.MaximumScale=200

set_style(cht)

cht.SeriesCollection().NewSeries()

shp2=cht.Shapes.AddPicture(r'd:\picpy.jpg',True,True,100,50,100,100)
shp2.IncrementRotation(30)
shp2.Flip(0)

#wb.save()
#app.kill()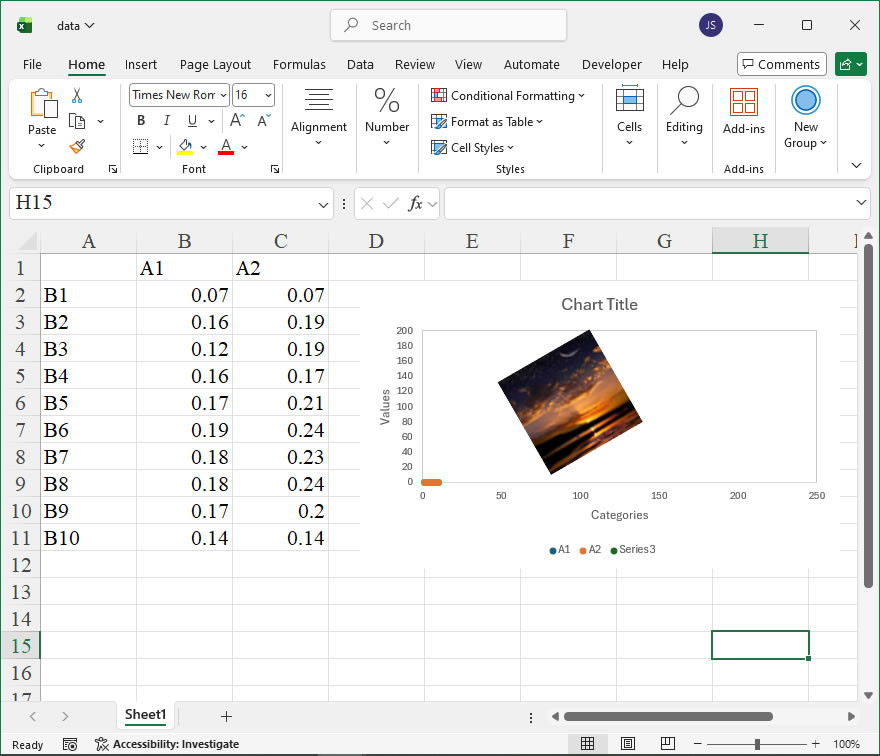
How to use Application.DecimalSeparator in the xlwings API way
The Application.DecimalSeparator property in Excel’s object model is a crucial setting for controlling how decimal numbers are formatted and interpreted in a spreadsheet. In xlwings, this property can be accessed and modified to ensure that numerical data is handled correctly according to regional or specific formatting requirements. This is particularly important when dealing with international datasets or when automating processes that must adhere to a particular decimal notation standard, such as using a comma instead of a period in many European locales.
Functionality
The DecimalSeparator property determines the character used to separate the integer part from the fractional part of a number in Excel. By default, this is often a period (.) in systems with English regional settings, but it can be changed to a comma (,) or another character. Adjusting this property affects how numbers are displayed in cells and can influence the parsing of text into numbers. This is a member of the Application object, which represents the entire Excel application instance, allowing global control over decimal formatting.
Syntax
In xlwings, the API provides a direct way to interact with Excel’s COM interface, enabling access to the Application.DecimalSeparator property. The syntax for using this property is straightforward, as it can be both read and written. The property is accessed through the app object, which represents the Excel application.
- To get the current decimal separator:
decimal_separator = app.api.DecimalSeparatorThis returns a string representing the current decimal separator character.
- To set a new decimal separator:
app.api.DecimalSeparator = ","This changes the decimal separator to a comma. The value must be a single-character string.
The property does not require any parameters, as it is a simple string attribute. However, when setting it, ensure the character is valid and supported by Excel to avoid unexpected behavior. Note that changing this property may affect other formatting settings, so it’s advisable to test in a controlled environment.
Code Examples
Here are practical examples of using the DecimalSeparator property with xlwings:
- Retrieving the Current Decimal Separator:
This example demonstrates how to read the current decimal separator setting from an Excel application instance.
import xlwings as xw

# Connect to the active Excel instance or start a new one
app = xw.apps.active

# Get the current decimal separator
current_separator = app.api.DecimalSeparator
print(f"The current decimal separator is: '{current_separator}'")- Changing the Decimal Separator and Formatting Numbers:
In this example, we change the decimal separator to a comma and then enter a number into a cell to see the effect.
import xlwings as xw

# Start a new Excel instance
app = xw.App()
wb = app.books.add()
sheet = wb.sheets[0]

# Set the decimal separator to a comma
app.api.DecimalSeparator = ","

# Enter a number in a cell
sheet.range("A1").value = 1234.56

# Check the displayed value in the cell (it may show as 1234,56 depending on formatting)
displayed_value = sheet.range("A1").value
print(f"The value in A1 is displayed as: {displayed_value}")

# Close the workbook and quit Excel
wb.close()
app.quit()- Resetting to Default Separator:
This example shows how to revert to the default decimal separator, typically a period, after making changes.
import xlwings as xw

app = xw.apps.active

# Assume the separator was previously changed to a comma
app.api.DecimalSeparator = ","

# Reset to the default (period)
app.api.DecimalSeparator = "."

# Verify the change
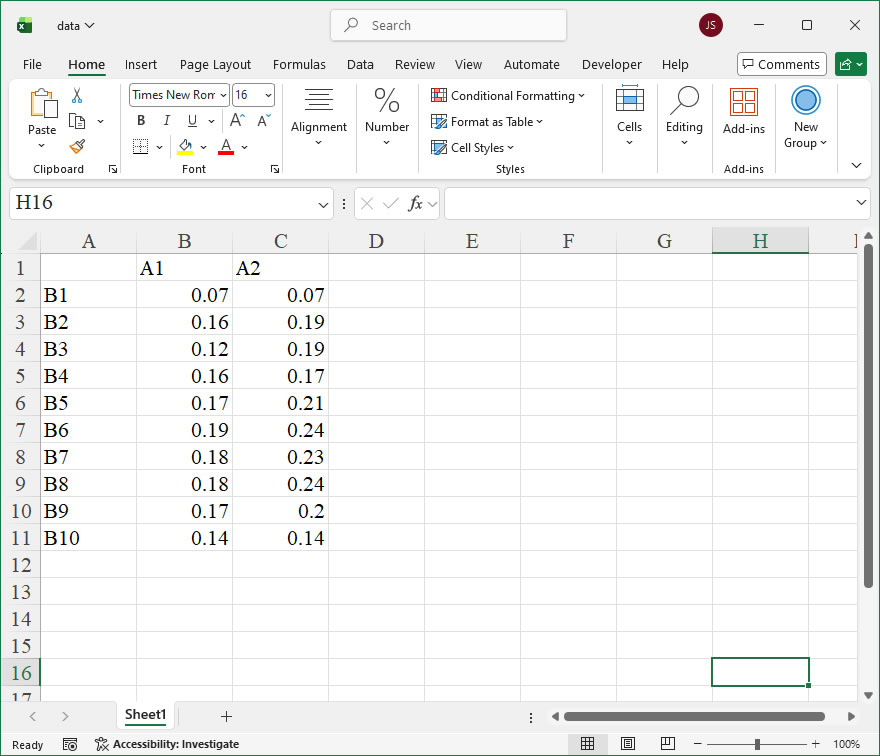
print(f"Decimal separator reset to: '{app.api.DecimalSeparator}'")How To Add Image To a Chart Using xlwings?
【Example】
【Code】
import xlwings as xw
import os

def set_style(cht):
    cht.ChartArea.Format.Line.Visible=False
    cht.PlotArea.Format.Fill.Visible = False
    cht.PlotArea.Format.Line.Visible = True
    cht.PlotArea.Format.Line.ForeColor.RGB=xw.utils.rgb_to_int((200,200,200))
    #cht.PlotArea.Format.Line.ForeColor.ObjectThemeColor = msoThemeColorText1
    ax1 = cht.Axes(1)
    ax2 = cht.Axes(2)
    ax1.HasTitle = True
    ax1.AxisTitle.Text = 'Categories'
    ax1.AxisTitle.Font.Size = 10
    ax1.TickLabels.Font.Size = 8
    #ax1.TickLabels.NumberFormat = '0.00'
    ax1.HasMajorGridlines = False
    ax2.HasTitle = True
    ax2.AxisTitle.Text = 'Values'
    ax2.AxisTitle.Font.Size = 10
    ax2.TickLabels.Font.Size = 8
    ax2.HasMajorGridlines = False
    cht.HasTitle = True
    #cht.ChartTitle.Caption = 'Plot'
    #cht.ChartTitle.Font.Size = 12


root = os.getcwd()
app = xw.App(visible=True, add_book=False)
wb=app.books.open(root+r'/data.xlsx',read_only=False)
sht=wb.sheets('Sheet1')

shp=sht.api.Shapes.AddChart2()
shp.Left=20
cht=shp.Chart
cht.ChartType=xw.constants.ChartType.xlXYScatter
ax1=cht.Axes(1)
ax2=cht.Axes(2)
ax1.MinimumScale=0
ax1.MaximumScale=250
ax2.MinimumScale=0
ax2.MaximumScale=200

set_style(cht)

cht.SeriesCollection().NewSeries()

cht.Shapes.AddPicture(r'd:\picpy.jpg',True,True,100,50,100,100)

#wb.save()
#app.kill()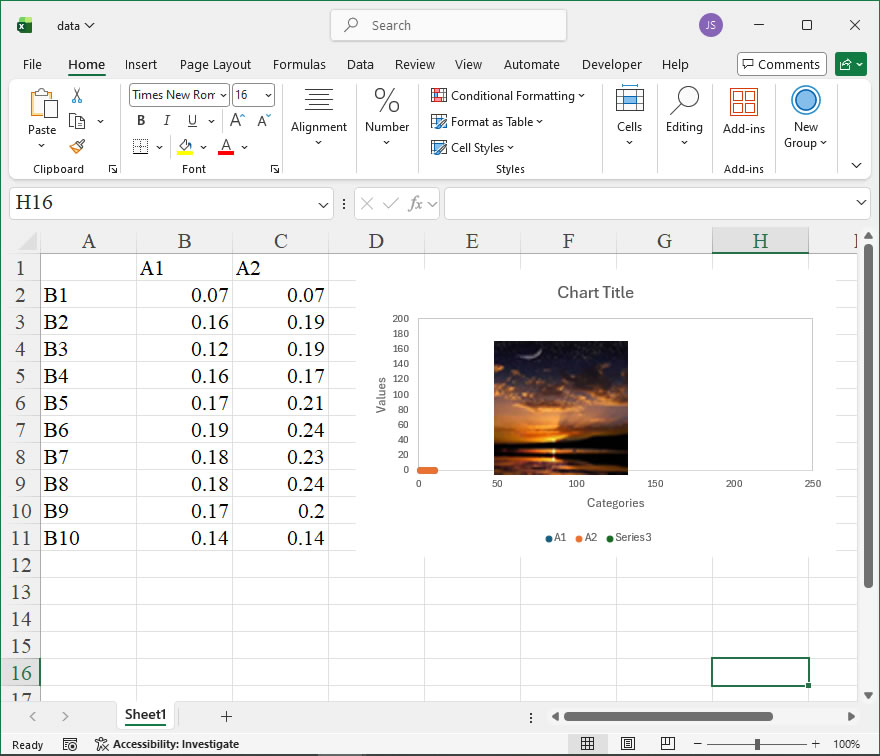
How to use Application.DDEAppReturnCode in the xlwings API way
The DDEAppReturnCode property of the Application object in Excel is a read-only property that returns the status code from the last Dynamic Data Exchange (DDE) operation. DDE is an older inter-process communication protocol that allows applications to exchange data. While modern automation typically uses other methods like COM (which xlwings utilizes), this property can be useful for debugging or maintaining legacy Excel applications that interact with DDE servers. The returned integer code indicates success or the specific type of error that occurred during the DDE conversation.
In xlwings, you access this property through the api property of the main App or Book objects, which exposes the raw Excel VBA object model. The syntax is straightforward as it takes no arguments.
Syntax:
xlwings.App.api.DDEAppReturnCodeor, if you have a specific workbook instance:
wb.api.Application.DDEAppReturnCodeWhere:
- The property is accessed directly and returns an Integer value.
The meaning of the return codes is defined by the DDE protocol and the applications involved. Common codes include:
| Code | Typical Meaning |
|---|---|
| 0 | Success / No Error |
| 1 | The topic was not understood by the server. |
| 2 | The server did not respond. |
| 7 | Unknown error. |
Important Note: The exact meaning of non-zero codes can vary depending on the DDE server application. You should consult the documentation for the specific application you are communicating with.
Example:
The following xlwings code initiates a DDE operation (a very legacy example) and then checks the return code to see if it was successful.
import xlwings as xw

# Start Excel application
app = xw.App(visible=False)
wb = app.books.add()

# Attempt a legacy DDE operation (e.g., initiating a conversation with "MyServer" on topic "System")
# Note: This is a pseudo-example, as modern xlwings doesn't have direct DDE methods.
# You would typically use the Excel VBA object model via .api for such calls.
try:
    # Simulating a DDE operation using the Excel object model
    # In VBA, this might be: channel = Application.DDEInitiate(app:="MyServer", topic:="System")
    # In xlwings, you would use:
    channel = app.api.DDEInitiate("MyServer", "System")
    print(f"DDE channel opened: {channel}")
except Exception as e:
    print(f"An error occurred during DDEInitiate: {e}")
finally:
    # Check the status code of the last DDE operation
    return_code = app.api.DDEAppReturnCode
    print(f"DDEAppReturnCode: {return_code}")

# Interpret the code
if return_code == 0:
    print("Last DDE operation was successful.")
else:
    print(f"Last DDE operation failed with error code: {return_code}")

# Clean up: Close the channel if it was opened, then quit Excel
if 'channel' in locals():
    app.api.DDETerminate(channel)
wb.close()
app.quit()How to use Application.DataEntryMode in the xlwings API way
In Excel VBA, the Application.DataEntryMode property is a legacy feature that determines whether Excel is in data entry mode. When enabled, Excel restricts user interaction to only the active data form, preventing access to other parts of the workbook. This is particularly useful for creating controlled data input interfaces, such as custom forms, where you want to limit user actions to specific fields. However, it’s important to note that this property is part of the older Excel object model and may not be widely used in modern applications, as more advanced methods like UserForms or custom dialog boxes are now preferred for data entry tasks.
In xlwings, which provides a Pythonic interface to Excel’s object model, you can access the DataEntryMode property through the Application object. The syntax for accessing this property is straightforward, as it is a read-write property that returns or sets an integer value representing the data entry mode. The values are typically: 0 for normal mode (not in data entry) and 1 for data entry mode. However, the exact behavior and supported values might vary depending on the Excel version, so it’s advisable to refer to Microsoft’s official documentation for detailed specifications.
To use Application.DataEntryMode in xlwings, you first need to establish a connection to an Excel instance or a specific workbook. Here’s the basic syntax:
import xlwings as xw

# Connect to the active Excel application
app = xw.apps.active

# Get the current data entry mode
current_mode = app.api.DataEntryMode
print(f"Current DataEntryMode: {current_mode}")

# Set the data entry mode to 1 (enable data entry mode)
app.api.DataEntryMode = 1

# Perform data entry tasks, then disable data entry mode
app.api.DataEntryMode = 0
In this code, app.api.DataEntryMode is used to interact with the property. The .api attribute in xlwings provides direct access to the underlying Excel object model, allowing you to use properties and methods as defined in VBA. When setting the property, ensure that you are in a context where data entry mode is applicable, such as when a data form is active. Otherwise, setting it might not have any effect or could lead to unexpected behavior.
For a practical example, suppose you are automating a data entry process in Excel where you want to lock the interface to a specific form. You can enable data entry mode to restrict user interactions. Here’s a sample code snippet:
import xlwings as xw
import time

# Start Excel and open a workbook
wb = xw.Book('data_entry.xlsx')
app = wb.app

# Assume a data form is active; enable data entry mode
app.api.DataEntryMode = 1
print("Data entry mode enabled. User restricted to the active form.")

# Simulate data entry tasks, such as filling fields
# For demonstration, wait for 5 seconds to mimic user input
time.sleep(5)

# Disable data entry mode after completion
app.api.DataEntryMode = 0
print("Data entry mode disabled. Normal interaction restored.")

# Save and close the workbook
wb.save()
wb.close()How to use Application.CutCopyMode in the xlwings API way
The Application.CutCopyMode property in Excel VBA is a property of the Application object that returns or sets the status of the Cut or Copy mode. This property is useful for programmatically determining if a cut or copy operation is currently active, or to cancel such an operation. In xlwings, this property is accessed through the api property of the App object, which provides direct access to the underlying Excel object model. Understanding this property is essential for automating tasks that involve clipboard operations, ensuring that your macros run without interference from pending cut/copy actions.
Functionality:
The primary function of the CutCopyMode property is to manage the state of cut and copy operations within Excel. It can have three possible values:
- False (or 0): Indicates that no cut or copy operation is currently in progress.
- True (or 1): Indicates that a copy operation is active. The source range is highlighted with a moving border.
- xlCut (or 2): Indicates that a cut operation is active. The source range is also highlighted.
By reading this property, your script can check for an active operation before performing actions that might conflict, such as pasting or clearing the clipboard. Setting this property to False is the programmatic equivalent of pressing the ESC key, which cancels the moving border and clears the clipboard state.
Syntax in xlwings:
In xlwings, you interact with this property via the Excel Application object’s COM interface.
- To Get the current mode:
current_mode = xw.apps[<app_index>].api.CutCopyMode
This returns an integer corresponding to the current state. - To Set the mode (typically to cancel):
xw.apps[<app_index>].api.CutCopyMode = False
Parameter & Return Values:
The property is read/write. Its value can be set or returned as a Long integer or a Boolean. The standard values are:
| Value | Constant (VBA) | Description |
|---|---|---|
| 0 | False | No cut or copy mode is active. |
| 1 | True | Copy mode is active. |
| 2 | xlCut | Cut mode is active. |
When setting the property, only False (0) is typically used to cancel the mode. Attempting to set it to True or xlCut does not initiate a new cut/copy operation.
Code Examples:
- Checking and Reporting the Current Mode:
This example checks the status and prints a descriptive message.
import xlwings as xw

# Connect to the active Excel instance
app = xw.apps.active

# Get the current CutCopyMode
mode = app.api.CutCopyMode

if mode == 0:
    print("No cut or copy operation is active.")
elif mode == 1:
    print("A copy operation is in progress.")
elif mode == 2:
    print("A cut operation is in progress.")
else:
print(f"Unknown mode value: {mode}")- Cancelling an Active Cut/Copy Operation:
This is a common practice to ensure a clean state before executing other operations.
import xlwings as xw

app = xw.apps.active

# Check if a cut/copy mode is active
if app.api.CutCopyMode:
    print("Cancelling the active cut/copy mode.")
    app.api.CutCopyMode = False # Equivalent to pressing ESC

# Now it's safe to proceed, e.g., with a paste operation
# app.api.Selection.PasteSpecial() # Example follow-up action- Integrating into a Larger Workflow:
This example copies a range, performs a check, and then cancels the mode.
import xlwings as xw

app = xw.apps.active
wb = app.books.active
sheet = wb.sheets[0]

# Perform a copy operation (this activates Copy mode)
sheet.range("A1:B2").copy()

# Verify the mode was activated
if app.api.CutCopyMode == 1:
    print("Range copied successfully. Copy mode is active.")

# ... Perform other tasks ...

# Cancel the copy mode explicitly when done
app.api.CutCopyMode = False
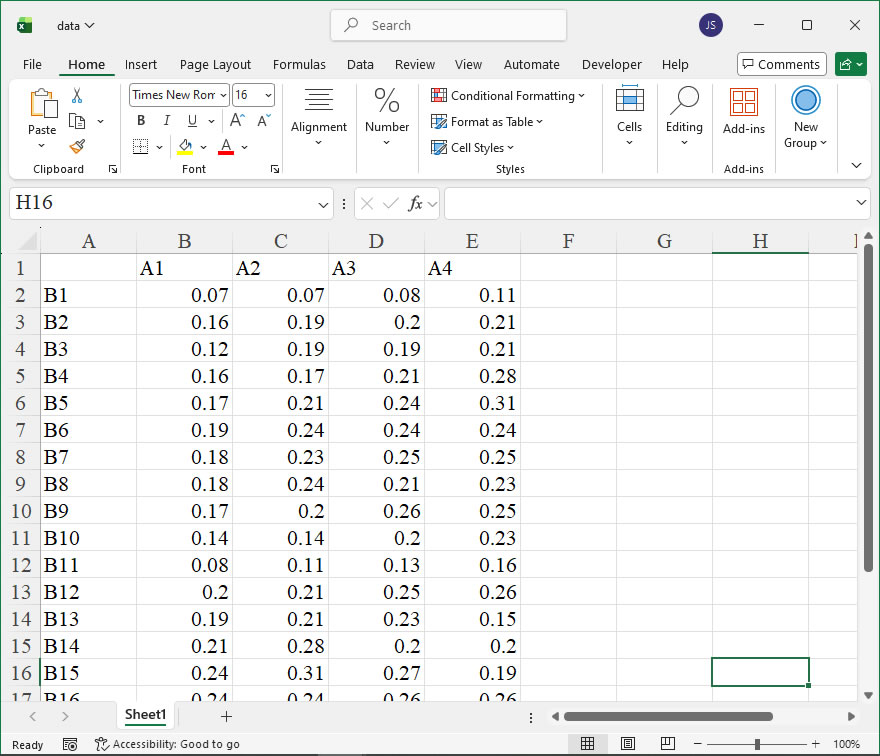
print("Copy mode cleared.")How To Create New Chart: Combine Existing Charts Using xlwings?
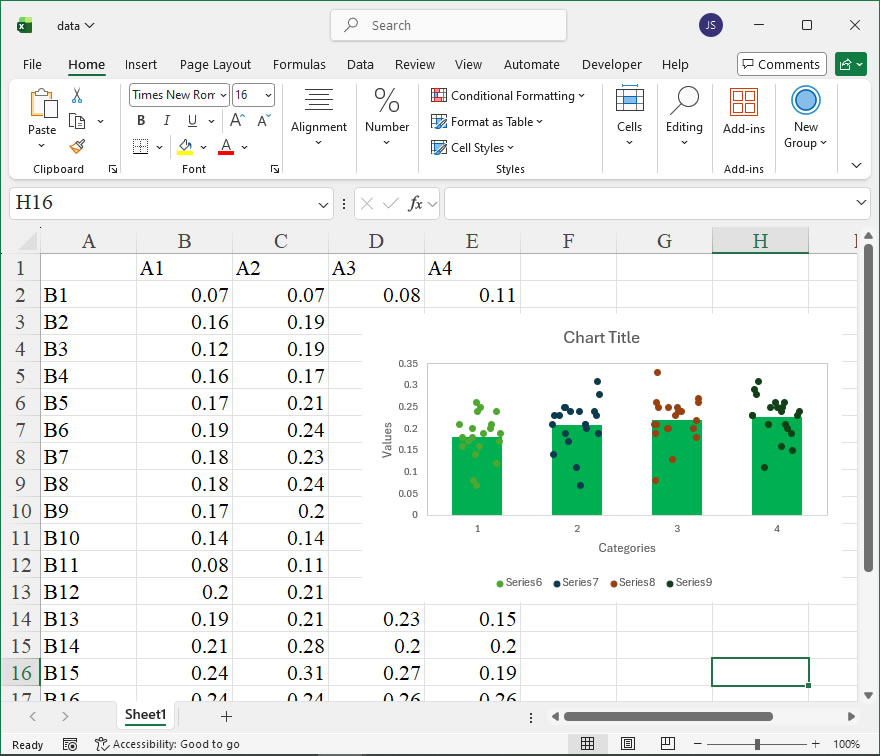
【Example】
【Code】
import xlwings as xw
import numpy as np
import os

def set_style(cht):
    cht.ChartArea.Format.Line.Visible=False
    cht.PlotArea.Format.Fill.Visible = False
    cht.PlotArea.Format.Line.Visible = True
    cht.PlotArea.Format.Line.ForeColor.RGB=xw.utils.rgb_to_int((200,200,200))
    #cht.PlotArea.Format.Line.ForeColor.ObjectThemeColor = msoThemeColorText1
    ax1 = cht.Axes(1)
    ax2 = cht.Axes(2)
    ax1.HasTitle = True
    ax1.AxisTitle.Text = 'Categories'
    ax1.AxisTitle.Font.Size = 10
    ax1.TickLabels.Font.Size = 8
    #ax1.TickLabels.NumberFormat = '0.00'
    ax1.HasMajorGridlines = False
    ax2.HasTitle = True
    ax2.AxisTitle.Text = 'Values'
    ax2.AxisTitle.Font.Size = 10
    ax2.TickLabels.Font.Size = 8
    ax2.HasMajorGridlines = False
    cht.HasTitle = True
    #cht.ChartTitle.Caption = 'Plot'
    #cht.ChartTitle.Font.Size = 12

def draw_rnd_scatter(cht,x,y,n,w):
    cht.SeriesCollection().NewSeries()
    count=cht.SeriesCollection().Count
    rd=[]
    for i in range(n):
        rd.append(x-w/2+w*np.random.rand(1)[0])
    cht.SeriesCollection(count).ChartType=-4169
    cht.SeriesCollection(count).XValues=rd
    cht.SeriesCollection(count).Values=y

root=os.getcwd()
app=xw.App(visible=True,add_book=False)
wb=app.books.open(root+r'/data.xlsx',read_only=False)
sht=wb.sheets('Sheet1')

shp=sht.api.Shapes.AddChart2()
shp.Left=20
cht=shp.Chart
cht.ChartType=xw.constants.ChartType.xlXYScatter
ax1=cht.Axes(1)
ax2=cht.Axes(2)
ax1.MinimumScale=0.5
ax1.MaximumScale=4.5
ax2.MinimumScale=0
ax2.MaximumScale=0.35

set_style(cht)

data=sht.range('B2:E21').value
dt=np.transpose(data)
dt1=dt[0]
dt2=dt[1]
dt3=dt[2]
dt4=dt[3]
aveg=[0 for _ in range(4)]
aveg[0]=app.api.WorksheetFunction.Average(dt1)
aveg[1]=app.api.WorksheetFunction.Average(dt2)
aveg[2]=app.api.WorksheetFunction.Average(dt3)
aveg[3]=app.api.WorksheetFunction.Average(dt4)

cht.SeriesCollection().NewSeries()
n=cht.SeriesCollection().Count
cht.SeriesCollection(n).ChartType=xw.constants.ChartType.xlColumnClustered
cht.SeriesCollection(n).XValues=[1,2,3,4]
cht.SeriesCollection(n).Values=aveg
cht.SeriesCollection(n).Format.Fill.ForeColor.RGB=xw.utils.rgb_to_int((76,200,132))
cht.ChartGroups(1).GapWidth=100

draw_rnd_scatter(cht,1,dt1,20,0.5)
draw_rnd_scatter(cht, 2, dt2, 20, 0.5)
draw_rnd_scatter(cht, 3, dt3, 20, 0.5)
draw_rnd_scatter(cht, 4, dt4, 20, 0.5)

#wb.save()
#app.kill()