Blog
How to use Application.CursorMovement in the xlwings API way
In the xlwings library, the Application object’s CursorMovement property provides control over the movement of the cell cursor after pressing the Enter key in Microsoft Excel. This property is particularly useful for customizing user interaction within a workbook, enhancing data entry efficiency by dictating the direction in which the selection moves post-data entry.
Functionality:
The CursorMovement property determines the direction in which the active cell moves when the Enter key is pressed. This can be set to move down, up, left, or right, depending on the user’s preference or the specific workflow requirements. By default, Excel moves the cursor down, but this can be adjusted programmatically via xlwings to streamline repetitive data entry tasks, such as filling rows horizontally or navigating vertically in a structured manner.
Syntax:
In xlwings, the CursorMovement property is accessed through the Application object. The property can be both read and set. The syntax is as follows:
app = xw.App()
app.api.CursorMovement
Here, app.api provides access to the underlying Excel object model. The CursorMovement property accepts integer values that correspond to specific movement directions, as defined in the Excel enumeration xlDirection. The primary values are:
xlDown(value: -4121): Moves the cursor down.xlUp(value: -4162): Moves the cursor up.xlToLeft(value: -4159): Moves the cursor to the left.xlToRight(value: -4161): Moves the cursor to the right.
To set the property, assign one of these integer values. For example, to move the cursor to the right, use:
app.api.CursorMovement = -4161 # xlToRightExample Usage:
Below are practical xlwings code examples demonstrating how to use the CursorMovement property:
- Setting Cursor Movement to Move Right:
This example opens an Excel workbook and configures the cursor to move right after pressing Enter, which is useful for entering data across rows.
import xlwings as xw
app = xw.App(visible=True)
workbook = app.books.open('example.xlsx')
app.api.CursorMovement = -4161 # Set to move right
print(f"Cursor movement set to: {app.api.CursorMovement}")
# Perform data entry or other operations
app.quit()- Reading and Changing Cursor Movement Dynamically:
This example reads the current cursor movement setting, changes it based on a condition, and then restores the original setting.
import xlwings as xw
app = xw.App(visible=False)
original_movement = app.api.CursorMovement
print(f"Original cursor movement: {original_movement}")

if original_movement == -4121: # If currently moving down
    app.api.CursorMovement = -4162 # Change to move up
    print("Cursor movement changed to move up.")
else:
    app.api.CursorMovement = -4121 # Default to move down
    print("Cursor movement changed to move down.")

# Restore original setting after operations
app.api.CursorMovement = original_movement
app.quit()- Using Cursor Movement in a Data Entry Loop:
This example simulates a data entry scenario where the cursor movement is set to move down, and then a loop enters sample data into a column.
import xlwings as xw
app = xw.App(visible=True)
workbook = app.books.add()
sheet = workbook.sheets[0]
app.api.CursorMovement = -4121 # Move down

# Enter data into cells A1 through A5
for i in range(1, 6):
    sheet.range(f'A{i}').value = f'Data {i}'
    # In a real scenario, pressing Enter would move the cursor down automatically

print("Data entry complete with cursor moving down.")
app.quit()How To Create New Chart: Fill The Area Between Two Lines Using xlwings? 2
【Example】
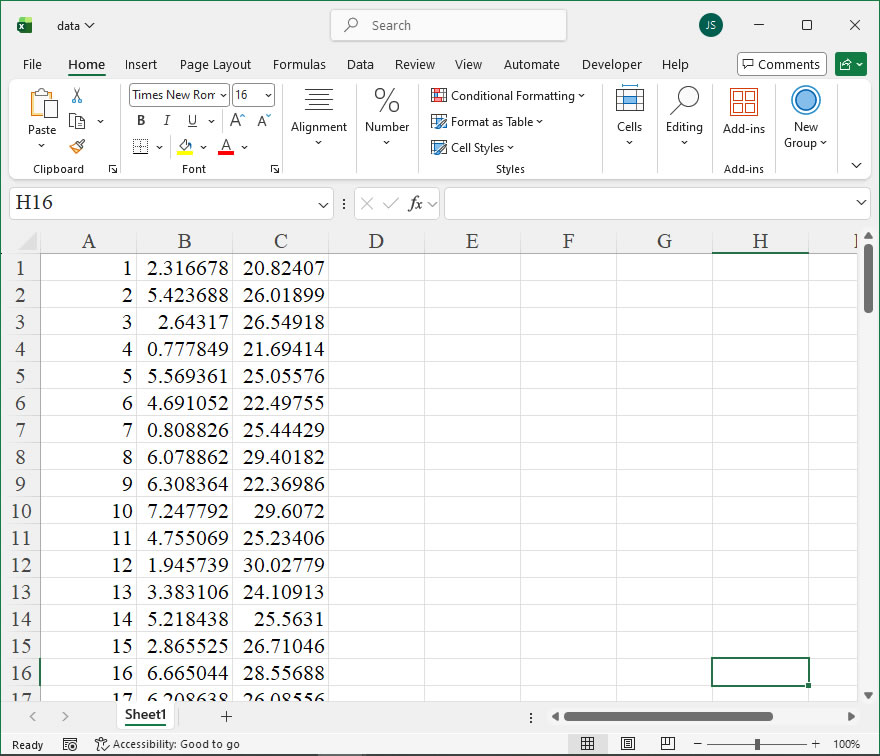
【Code】
import xlwings as xw
import os

def set_style(cht):
    cht.ChartArea.Format.Line.Visible=False
    cht.PlotArea.Format.Fill.Visible = False
    cht.PlotArea.Format.Line.Visible = True
    cht.PlotArea.Format.Line.ForeColor.RGB=xw.utils.rgb_to_int((200,200,200))
    #cht.PlotArea.Format.Line.ForeColor.ObjectThemeColor = msoThemeColorText1
    ax1 = cht.Axes(1)
    ax2 = cht.Axes(2)
    ax1.HasTitle = True
    ax1.AxisTitle.Text = 'Categories'
    ax1.AxisTitle.Font.Size = 10
    ax1.TickLabels.Font.Size = 8
    #ax1.TickLabels.NumberFormat = '0.00'
    ax1.HasMajorGridlines = False
    ax2.HasTitle = True
    ax2.AxisTitle.Text = 'Values'
    ax2.AxisTitle.Font.Size = 10
    ax2.TickLabels.Font.Size = 8
    ax2.HasMajorGridlines = False
    cht.HasTitle = True
    #cht.ChartTitle.Caption = 'Plot'
    #cht.ChartTitle.Font.Size = 12

root=os.getcwd()
app=xw.App(visible=True,add_book=False)
wb=app.books.open(root+r'/data.xlsx',read_only=False)
sht=wb.sheets('Sheet1')
data=sht.range('A1:C100').value
app.kill()

from comtypes.client import CreateObject
app2=CreateObject("Excel.Application")
app2.Visible=True
app2.ScreenUpdating=False
wb2=app2.Workbooks.Open(root+r'/data.xlsx')
sht2=wb2.Sheets('Sheet1')

shp=sht2.Shapes.AddChart2()
shp.Left=20
cht=shp.Chart
cht.ChartType=-4169
ax1=cht.Axes(1)
ax2=cht.Axes(2)
ax1.MinimumScale=0
ax1.MaximumScale=101
ax2.MinimumScale=0
ax2.MaximumScale=120

set_style(cht)

cht.SeriesCollection().NewSeries()

pt=[[0 for _ in range(2)] for _ in range(201)]
for i in range(100):
    pt[i][0]=shape_x(cht,100-i)
    pt[i][1]=shape_y(cht,data[100-i-1][1])
for i in range(100,200):
    pt[i][0]=shape_x(cht,i-100)
    pt[i][1]=shape_y(cht,data[i-100][2])
pt[200][0]=pt[0][0]
pt[200][1]=pt[0][1]

shp=cht.Shapes.AddPolyline(pt)
shp.Fill.ForeColor.RGB=xw.utils.rgb_to_int((255,128,0))
shp.Fill.OneColorGradient(1,1,1)
shp.Fill.GradientStops.Insert(xw.utils.rgb_to_int((0,255,0)),0.5)
shp.Fill.GradientStops.Delete(2)
shp.Fill.GradientStops.Insert(xw.utils.rgb_to_int((0,0,255)),1)
shp.Line.Visible = False

app2.ScreenUpdating=True

#wb2.Save()
#os.system('taskkill /f /im EXCEL.EXE')
How to use Application.Cursor in the xlwings API way
In the Excel object model, the Application.Cursor property is a member of the top-level Application object, which represents the entire Excel application. This property controls the visual appearance of the mouse cursor (pointer) in Excel. It is particularly useful in automation scenarios where you want to provide visual feedback to users, such as indicating that a long-running operation is in progress. By changing the cursor, you can enhance the user experience by signaling that the application is busy or that a specific action is required.
Functionality:
The Application.Cursor property allows you to get or set the mouse cursor shape displayed in Excel. It can be used to change the cursor to standard shapes like an arrow, an I-beam for text selection, or a wait cursor (e.g., an hourglass or spinning wheel) during lengthy operations. This helps in making automated processes more user-friendly by visually communicating the application’s state.
Syntax:
In xlwings, you can access the Application.Cursor property through the app object, which represents the Excel application. The property is used to get or set the cursor type. The syntax is as follows:
- To get the current cursor:
current_cursor = app.api.Cursor - To set the cursor to a new value:
app.api.Cursor = cursor_value
Here, app is an instance of the xlwings App class, typically created with xw.App() or accessed via xw.apps. The api attribute provides direct access to the underlying Excel object model. The cursor_value is an integer or enumeration constant that specifies the cursor shape. In Excel VBA, these values are defined by the XlMousePointer enumeration. Common values include:
xlDefault(or 0): The default cursor (usually an arrow).xlWait(or 1): A wait cursor (e.g., hourglass), indicating that Excel is busy.xlIBeam(or 3): An I-beam cursor, used for text selection.xlNorthwestArrow(or 2): A northwest arrow cursor.
To use these in xlwings, you can define constants or use the integer values directly. For example, xlWait corresponds to the integer 1.
Example:
Below is an xlwings code example that demonstrates how to use the Application.Cursor property to change the mouse cursor during a time-consuming operation, such as processing data in a worksheet. This example shows setting the cursor to a wait state, performing a task, and then resetting it to the default.
import xlwings as xw
import time

# Connect to the active Excel application or start a new one
app = xw.apps.active if xw.apps.active else xw.App()

# Set the cursor to wait (hourglass) to indicate busy state
app.api.Cursor = 1 # Using integer value for xlWait
print("Cursor set to wait state. Processing data...")

# Simulate a long-running task, e.g., iterating through cells
try:
    # Access the active workbook and worksheet
    wb = app.books.active
    ws = wb.sheets.active

    # Example operation: sum values in a range (this could be any intensive task)
total = 0
    for cell in ws.range("A1:A10"): # Process a range of cells
        if cell.value is not None:
            total += cell.value
            time.sleep(0.1) # Simulate delay for demonstration

            print(f"Total sum from A1:A10 is: {total}")

finally:
    # Always reset the cursor to default after the operation
    app.api.Cursor = 0 # Using integer value for xlDefault
    print("Cursor reset to default state.")

# Optional: Close the app if it was started in this script
# app.quit()How To Create New Chart: Fill The Area Between Two Lines Using xlwings?
【Example】
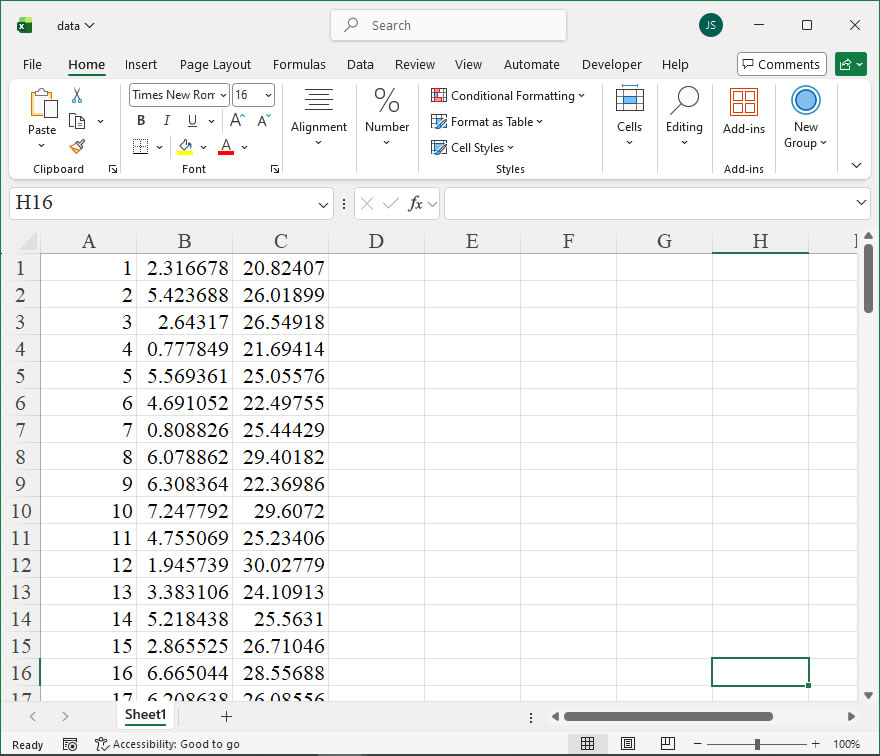
【Code】
import xlwings as xw
import os

def set_style(cht):
    cht.ChartArea.Format.Line.Visible=False
    cht.PlotArea.Format.Fill.Visible = False
    cht.PlotArea.Format.Line.Visible = True
    cht.PlotArea.Format.Line.ForeColor.RGB=xw.utils.rgb_to_int((200,200,200))
    #cht.PlotArea.Format.Line.ForeColor.ObjectThemeColor = msoThemeColorText1
    ax1 = cht.Axes(1)
    ax2 = cht.Axes(2)
    ax1.HasTitle = True
    ax1.AxisTitle.Text = 'Categories'
    ax1.AxisTitle.Font.Size = 10
    ax1.TickLabels.Font.Size = 8
    #ax1.TickLabels.NumberFormat = '0.00'
    ax1.HasMajorGridlines = False
    ax2.HasTitle = True
    ax2.AxisTitle.Text = 'Values'
    ax2.AxisTitle.Font.Size = 10
    ax2.TickLabels.Font.Size = 8
    ax2.HasMajorGridlines = False
    cht.HasTitle = True
    #cht.ChartTitle.Caption = 'Plot'
    #cht.ChartTitle.Font.Size = 12


root=os.getcwd()
app=xw.App(visible=True,add_book=False)
wb=app.books.open(root+r'/data.xlsx',read_only=False)
sht=wb.sheets('Sheet1')
data=sht.range('A1:C100').value
app.kill()

from comtypes.client import CreateObject
app2=CreateObject("Excel.Application")
app2.Visible=True
app2.ScreenUpdating=False
wb2=app2.Workbooks.Open(root+r'/data.xlsx')
sht2=wb2.Sheets('Sheet1')

shp=sht2.Shapes.AddChart2()
shp.Left=20
cht=shp.Chart
cht.ChartType=-4169
ax1=cht.Axes(1)
ax2=cht.Axes(2)
ax1.MinimumScale=0
ax1.MaximumScale=101
ax2.MinimumScale=0
ax2.MaximumScale=120

set_style(cht)

cht.SeriesCollection().NewSeries()

pt=[[0 for _ in range(2)] for _ in range(201)]
for i in range(100):
    pt[i][0]=shape_x(cht,100-i)
    pt[i][1]=shape_y(cht,data[100-i-1][1])
for i in range(100,200):
    pt[i][0]=shape_x(cht,i-100)
    pt[i][1]=shape_y(cht,data[i-100][2])
pt[200][0]=pt[0][0]
pt[200][1]=pt[0][1]

shp=cht.Shapes.AddPolyline(pt)
shp.Fill.ForeColor.RGB=xw.utils.rgb_to_int((76,200,132))
shp.Line.Visible=False
shp.Fill.Transparency=0.3

app2.ScreenUpdating=True

#wb2.Save()
#os.system('taskkill /f /im EXCEL.EXE')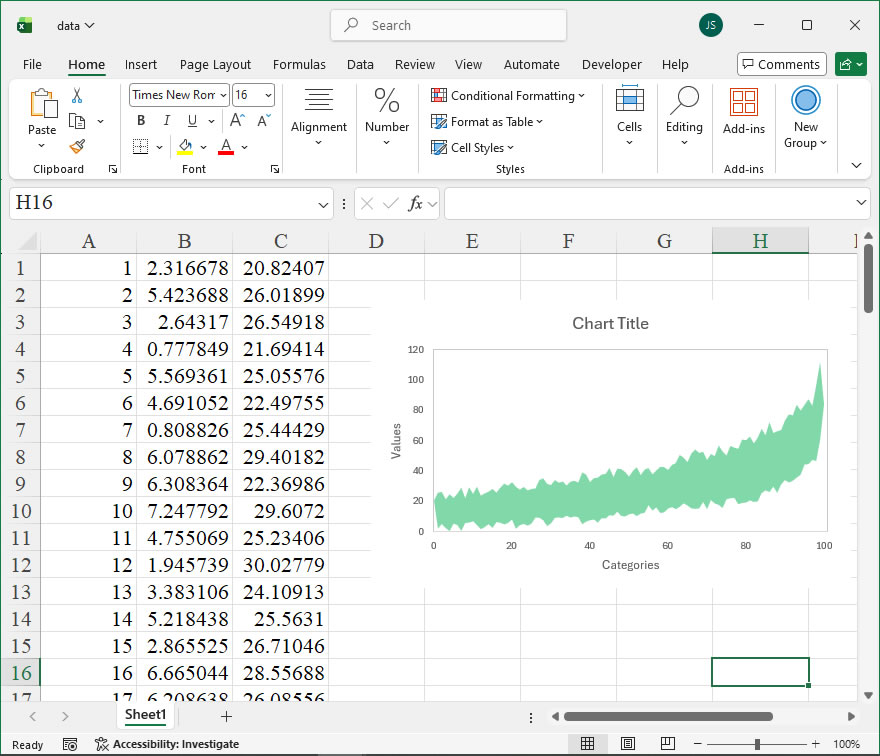
How to use Application.Creator in the xlwings API way
The Creator property of the Application object in Excel’s object model is a read-only attribute that returns a 32-bit integer representing the application that created the file. In Excel, this value is typically used to identify whether the file was created by Microsoft Excel or another application, such as a third-party tool or a different version of Excel. In xlwings, the Creator property can be accessed to retrieve this identifier, which can be useful for compatibility checks, file validation, or logging purposes when automating Excel tasks.
Functionality:
The Creator property helps determine the origin application of an Excel file. For instance, if a file was created by Excel, the Creator value will correspond to Microsoft Excel’s identifier. This can be essential in scenarios where you need to ensure that files are processed only from specific sources or to troubleshoot issues related to file creation.
Syntax in xlwings:
In xlwings, you can access the Creator property through the app object, which represents the Excel application. The syntax is straightforward, as it is a property without parameters. Here’s the general format:
creator_value = app.api.Creatorapp: This is the xlwingsAppinstance connected to Excel.api: This attribute provides access to the underlying Excel object model, allowing direct interaction with properties likeCreator.Creator: The property that returns an integer representing the creator application.
The returned value is an integer. For Microsoft Excel, the typical value is 1480803660 (which corresponds to the hexadecimal 0x5843454C, representing “XCEL” in ASCII). Other applications may have different values. You can compare this integer to known constants to identify the creator.
Example Usage:
Below is a code example that demonstrates how to use the Creator property in xlwings to check if the current Excel file was created by Microsoft Excel. This example assumes you have an Excel application open and connected via xlwings.
import xlwings as xw

# Connect to the active Excel application
app = xw.apps.active

# Access the Creator property
creator_code = app.api.Creator

# Define known creator codes (example for Microsoft Excel)
EXCEL_CREATOR = 1480803660 # This is the standard value for Excel

# Check the creator and print the result
if creator_code == EXCEL_CREATOR:
    print("The file was created by Microsoft Excel.")
else:
    print(f"The file was created by another application. Creator code: {creator_code}")

# You can also convert the code to a hexadecimal string for easier interpretation
hex_creator = hex(creator_code)
print(f"Creator code in hexadecimal: {hex_creator}")How To Create Custom Inverted Triangle Column Chart Using xlwings?
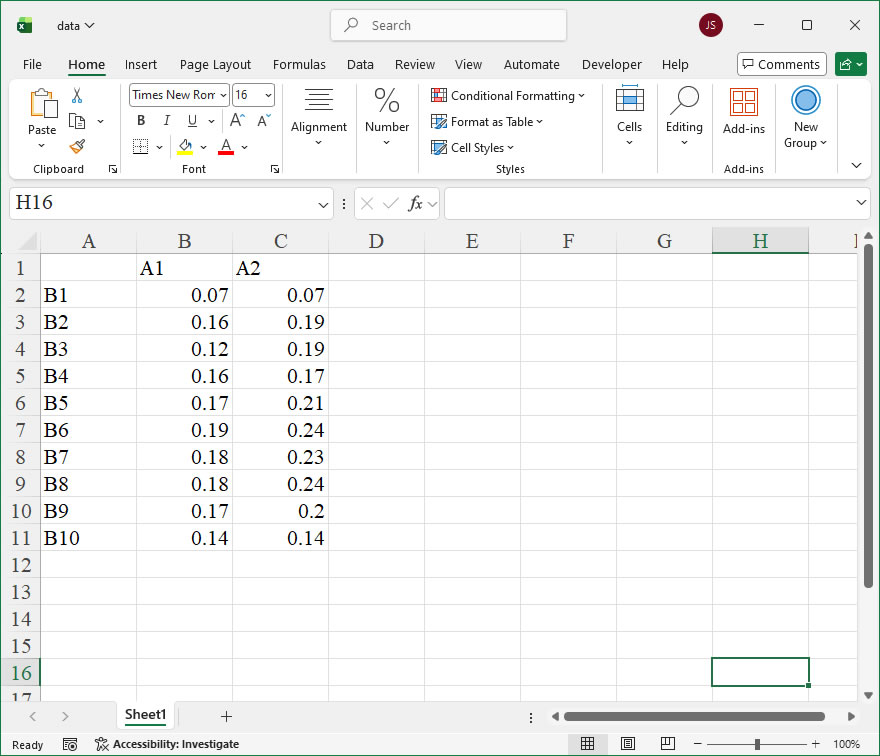
【Example】
【Code】
import xlwings as xw
import os

def set_style(cht):
    cht.ChartArea.Format.Line.Visible=False
    cht.PlotArea.Format.Fill.Visible = False
    cht.PlotArea.Format.Line.Visible = True
    cht.PlotArea.Format.Line.ForeColor.RGB=xw.utils.rgb_to_int((200,200,200))
    #cht.PlotArea.Format.Line.ForeColor.ObjectThemeColor = msoThemeColorText1
    ax1 = cht.Axes(1)
    ax2 = cht.Axes(2)
    ax1.HasTitle = True
    ax1.AxisTitle.Text = 'Categories'
    ax1.AxisTitle.Font.Size = 10
    ax1.TickLabels.Font.Size = 8
    #ax1.TickLabels.NumberFormat = '0.00'
    ax1.HasMajorGridlines = False
    ax2.HasTitle = True
    ax2.AxisTitle.Text = 'Values'
    ax2.AxisTitle.Font.Size = 10
    ax2.TickLabels.Font.Size = 8
    ax2.HasMajorGridlines = False
    cht.HasTitle = True
    #cht.ChartTitle.Caption = 'Plot'
    #cht.ChartTitle.Font.Size = 12

root=os.getcwd()
app=xw.App(visible=True,add_book=False)
wb=app.books.open(root+r'/data.xlsx',read_only=False)
sht=wb.sheets('Sheet1')
data=sht.range('A2:B7').value
app.kill()

from comtypes.client import CreateObject
app2=CreateObject("Excel.Application")
app2.Visible=True
app2.ScreenUpdating=False
wb2=app2.Workbooks.Open(root+r'/data.xlsx')
sht2=wb2.Sheets('Sheet1')

shp=sht2.Shapes.AddChart2()
shp.Left=20
cht=shp.Chart
cht.ChartType=-4169
ax1=cht.Axes(1)
ax2=cht.Axes(2)
ax1.MinimumScale=0
ax1.MaximumScale=7
ax2.MinimumScale=0
ax2.MaximumScale=0.22

set_style(cht)

cht.SeriesCollection().NewSeries()

pt=[[0 for _ in range(2)] for _ in range(4)]
for i in range(6):
    pt[0][0]=shape_x(cht,i+1-0.25)
    pt[0][1]=shape_y(cht,data[i][1])
    pt[1][0]=shape_x(cht,i+1)
    pt[1][1]=shape_y(cht,0)
    pt[2][0]=shape_x(cht,i+1+0.25)
    pt[2][1]=shape_y(cht,data[i][1])
    pt[3][0]=pt[0][0]
    pt[3][1]=pt[0][1]
    shp=cht.Shapes.AddPolyline(pt)
    shp.Fill.ForeColor.RGB=xw.utils.rgb_to_int((255,192,0))
    shp.Fill.TwoColorGradient(2,1)
    shp.Fill.BackColor.RGB=xw.utils.rgb_to_int((240,240,240))
    shp.Line.Visible=False

    x=shape_x(cht,i+1-0.35)
    y=shape_y(cht,data[i][1]+0.025)
    w=cht.PlotArea.InsideWidth/(ax1.MaximumScale-ax1.MinimumScale)*1
    h=cht.PlotArea.InsideHeight/(ax2.MaximumScale-ax2.MinimumScale)*0.04
    shp2=cht.Shapes.AddLabel(1,x,y,w,h)
    shp2.TextFrame.Characters().Text=str(data[i][1])
    shp2.TextFrame.Characters().Font.Color=xw.utils.rgb_to_int((0,0,0))
    shp2.TextFrame.Characters().Font.Size=8

app2.ScreenUpdating=True

#wb2.Save()
#os.system('taskkill /f /im EXCEL.EXE')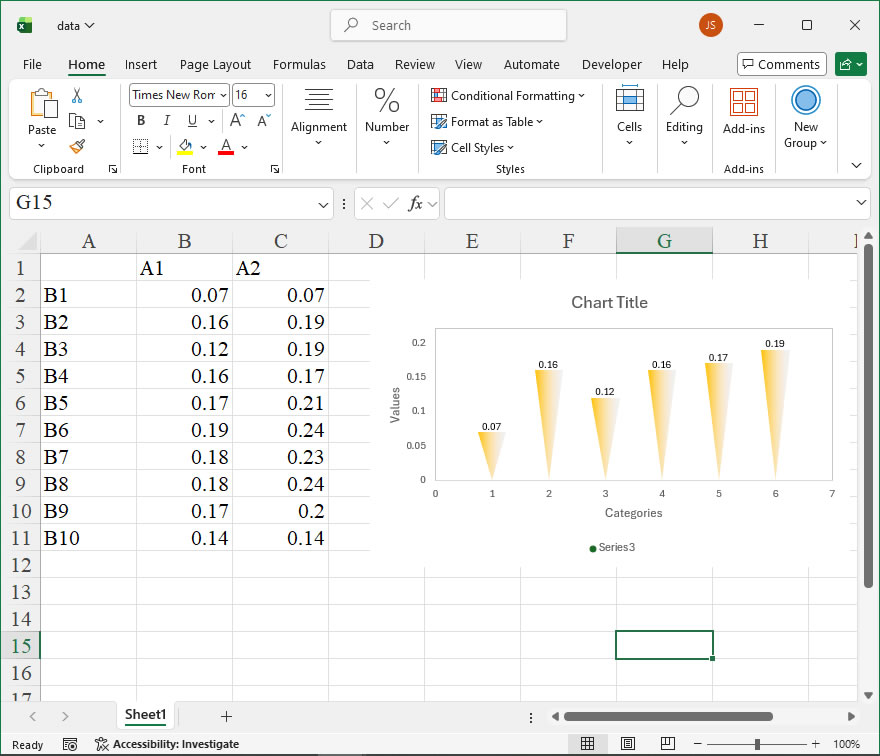
How to use Application.CopyObjectsWithCells in the xlwings API way
Application.CopyObjectsWithCells Property in xlwings
The Application.CopyObjectsWithCells property in Excel, accessible via the xlwings API, controls whether drawing objects (such as shapes, charts, pictures, and other embedded objects) are copied or moved along with their associated cells during cut, copy, or fill operations in a worksheet. This property is a global application-level setting, meaning it affects the behavior across all open workbooks in the Excel instance controlled by xlwings. It is particularly useful for automating tasks where you need to ensure that graphical elements remain attached to specific data ranges when those ranges are manipulated.
Syntax and Parameters in xlwings
In xlwings, you interact with this property through the app object, which represents the Excel Application. The property is exposed as a read/write Boolean attribute.
- Property Access:
app.api.CopyObjectsWithCells(using the.apiattribute to access the underlying Excel object model directly).- Alternatively, you can use
app.engine.api.CopyObjectsWithCellsif working with a specific engine context in more advanced scenarios, but typically theapp.apiroute is standard. - Value:
True: (Default) Drawing objects are copied, moved, or filled along with cells.False: Drawing objects remain in their original positions on the worksheet; only the cell contents and formats are affected by the operation.
Code Examples
Here are practical xlwings code snippets demonstrating how to get and set this property, and its impact on operations.
- Checking the Current Setting:
import xlwings as xw

# Connect to the active Excel instance or start a new one
app = xw.apps.active

# Get the current value of CopyObjectsWithCells
current_setting = app.api.CopyObjectsWithCells
print(f"CopyObjectsWithCells is currently set to: {current_setting}")
# Output will be True or False- Changing the Setting and Performing a Copy Operation:
This example disables the copying of objects, copies a cell range, and then restores the original setting.
import xlwings as xw

app = xw.apps.active
wb = app.books.active
sheet = wb.sheets[0]

# Assume cell A1 has a shape (e.g., a rectangle) over it and contains the number 10.
original_setting = app.api.CopyObjectsWithCells

# Set to False: Objects will NOT move with cells.
app.api.CopyObjectsWithCells = False
print("Set CopyObjectsWithCells to False.")

# Copy cell A1 to B1. Only the value (10) will be copied.
sheet.range('A1').copy(sheet.range('B1'))

# Verify: B1 now contains 10, but the shape remains only over A1.

# Restore the original application setting
app.api.CopyObjectsWithCells = original_setting
print("Restored original setting.")- Automating a Task with Controlled Object Behavior:
A more integrated example where you temporarily enable object copying to duplicate a data section with its associated chart.
import xlwings as xw

app = xw.apps.active
wb = app.books['Report.xlsx']
data_sheet = wb.sheets['MonthlyData']

# Ensure objects are copied with cells for this specific operation
app.api.CopyObjectsWithCells = True

# Define the source range (A1:D10) which includes data and an embedded chart object
source_range = data_sheet.range('A1:D10')
# Define the target starting cell
target_range = data_sheet.range('A12')

# Copy the entire block, including the chart
source_range.copy(target_range)

# Optional: Reset to default (True) or a previous state if needed for other macros/users.
# app.api.CopyObjectsWithCells = FalseHow To Create Custom Triangle Column Chart Using xlwings?
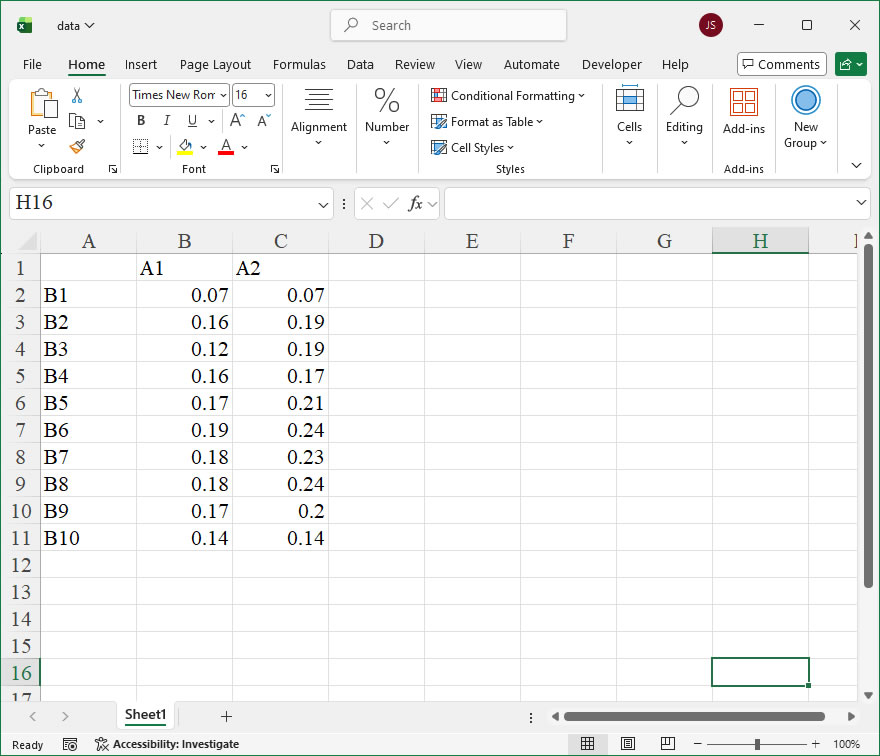
【Example】
【Code】
import xlwings as xw
import os

def set_style(cht):
    cht.ChartArea.Format.Line.Visible=False
    cht.PlotArea.Format.Fill.Visible = False
    cht.PlotArea.Format.Line.Visible = True
    cht.PlotArea.Format.Line.ForeColor.RGB=xw.utils.rgb_to_int((200,200,200))
    #cht.PlotArea.Format.Line.ForeColor.ObjectThemeColor = msoThemeColorText1
    ax1 = cht.Axes(1)
    ax2 = cht.Axes(2)
    ax1.HasTitle = True
    ax1.AxisTitle.Text = 'Categories'
    ax1.AxisTitle.Font.Size = 10
    ax1.TickLabels.Font.Size = 8
    #ax1.TickLabels.NumberFormat = '0.00'
    ax1.HasMajorGridlines = False
    ax2.HasTitle = True
    ax2.AxisTitle.Text = 'Values'
    ax2.AxisTitle.Font.Size = 10
    ax2.TickLabels.Font.Size = 8
    ax2.HasMajorGridlines = False
    cht.HasTitle = True
    #cht.ChartTitle.Caption = 'Plot'
    #cht.ChartTitle.Font.Size = 12

root=os.getcwd()
app=xw.App(visible=True,add_book=False)
wb=app.books.open(root+r'/data.xlsx',read_only=False)
sht=wb.sheets('Sheet1')
data=sht.range('A2:B7').value
app.kill()

from comtypes.client import CreateObject
app2=CreateObject("Excel.Application")
app2.Visible=True
app2.ScreenUpdating=False
wb2=app2.Workbooks.Open(root+r'/data.xlsx')
sht2=wb2.Sheets('Sheet1')

shp=sht2.Shapes.AddChart2()
shp.Left=20
cht=shp.Chart
cht.ChartType=-4169
ax1=cht.Axes(1)
ax2=cht.Axes(2)
ax1.MinimumScale=0
ax1.MaximumScale=7
ax2.MinimumScale=0
ax2.MaximumScale=0.22

set_style(cht)

cht.SeriesCollection().NewSeries()

pt=[[0 for _ in range(2)] for _ in range(4)]
for i in range(6):
    pt[0][0]=shape_x(cht,i+1-0.25)
    pt[0][1]=shape_y(cht,0)
    pt[1][0]=shape_x(cht,i+1+0.25)
    pt[1][1]=shape_y(cht,0)
    pt[2][0]=shape_x(cht,i+1)
    pt[2][1]=shape_y(cht,data[i][1])
    pt[3][0]=pt[0][0]
    pt[3][1]=pt[0][1]
    shp=cht.Shapes.AddPolyline(pt)
    shp.Fill.ForeColor.RGB=xw.utils.rgb_to_int((255,192,0))
    shp.Fill.TwoColorGradient(2,1)
    shp.Fill.BackColor.RGB=xw.utils.rgb_to_int((240,240,240))
    shp.Line.Visible=False

app2.ScreenUpdating=True

#wb2.Save()
#os.system('taskkill /f /im EXCEL.EXE')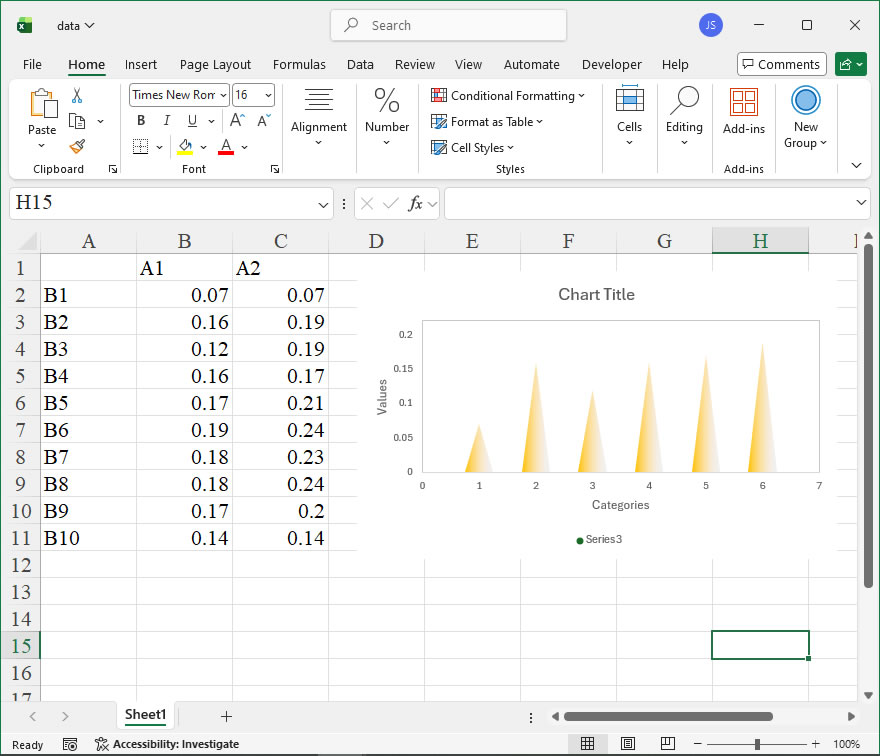
How to use Application.ControlCharacters in the xlwings API way
The Application.ControlCharacters property in Excel’s object model is a member of the Application object that controls the display of certain control characters within cells. Specifically, it determines whether control characters (such as line breaks, carriage returns, or tab characters) are shown as visible symbols or are rendered as their functional effects (like actual line breaks). This property is particularly useful when dealing with text data imported from other systems that may contain these characters, allowing users to toggle their visibility for editing or debugging purposes. In xlwings, this property can be accessed and modified to customize how Excel handles these characters in the user interface.
In terms of syntax, the ControlCharacters property is accessed through the Application object in xlwings. The xlwings API provides a straightforward way to interact with this property using Python. The property is a Boolean value, where True means that control characters are displayed as visible symbols (e.g., a small square for a line break), and False means they are rendered normally (e.g., causing an actual line break in the cell). The xlwings call format follows the pattern of accessing properties from the app object, which represents the Excel application. For example, to get the current setting, you use app.api.ControlCharacters, and to set it, you assign a value like app.api.ControlCharacters = True. Note that app must be an instance of the xlwings App class connected to a running Excel application. This property does not take additional parameters; it is a simple read/write property that affects the entire Excel instance.
Here is a code example demonstrating the usage of Application.ControlCharacters with xlwings. First, ensure you have xlwings installed and an Excel workbook open. The example will toggle the display of control characters and print the current state:
import xlwings as xw

# Connect to the active Excel application
app = xw.apps.active

# Get the current ControlCharacters setting
current_setting = app.api.ControlCharacters
print(f"Current ControlCharacters setting: {current_setting}")

# Set ControlCharacters to True to show symbols
app.api.ControlCharacters = True
print("ControlCharacters set to True. Control characters will display as symbols.")

# Set ControlCharacters to False to render normally
app.api.ControlCharacters = False
print("ControlCharacters set to False. Control characters will render functionally.")

# Verify the change by getting the setting again
updated_setting = app.api.ControlCharacters
print(f"Updated ControlCharacters setting: {updated_setting}")How To Create Custom Scatter Bar Chart Using xlwings?
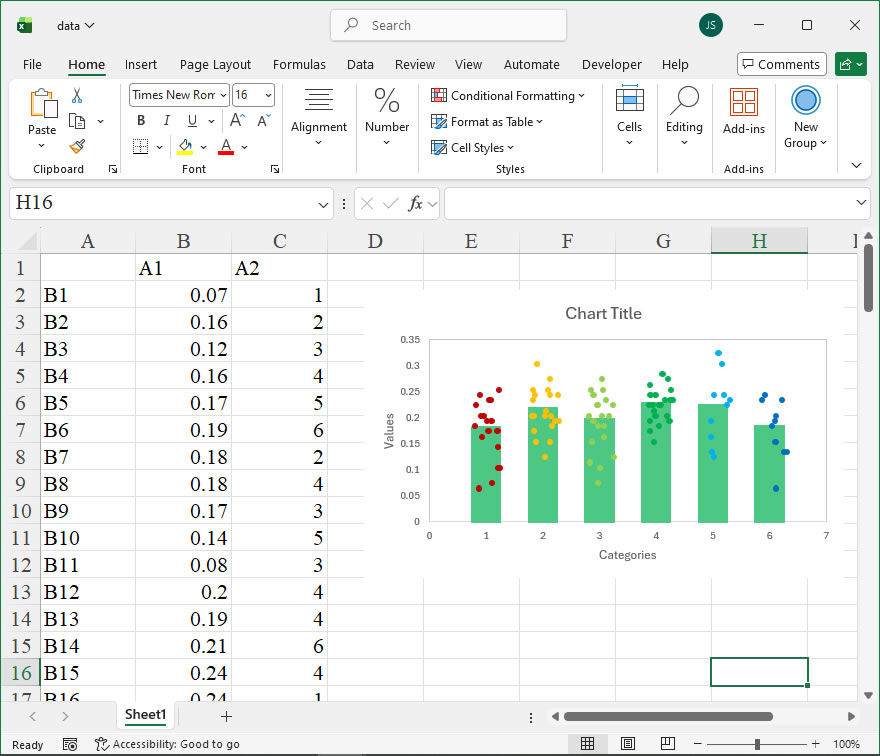
【Example】
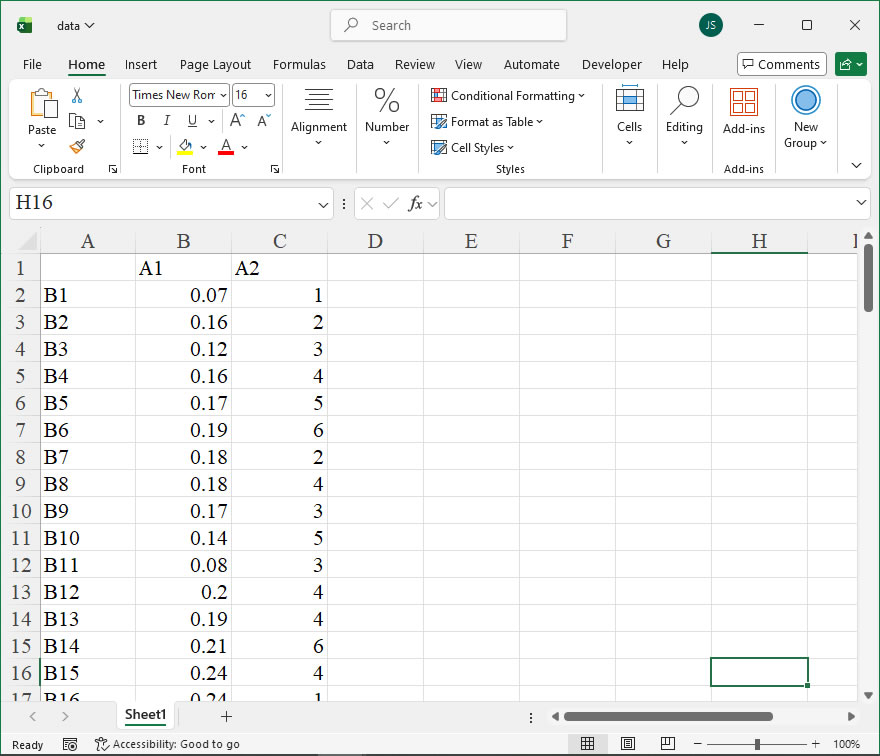
【Code】
import xlwings as xw
import numpy as np
import os

def set_style(cht):
    cht.ChartArea.Format.Line.Visible=False
    cht.PlotArea.Format.Fill.Visible = False
    cht.PlotArea.Format.Line.Visible = True
    cht.PlotArea.Format.Line.ForeColor.RGB=xw.utils.rgb_to_int((200,200,200))
    #cht.PlotArea.Format.Line.ForeColor.ObjectThemeColor = msoThemeColorText1
    ax1 = cht.Axes(1)
    ax2 = cht.Axes(2)
    ax1.HasTitle = True
    ax1.AxisTitle.Text = 'Categories'
    ax1.AxisTitle.Font.Size = 10
    ax1.TickLabels.Font.Size = 8
    #ax1.TickLabels.NumberFormat = '0.00'
    ax1.HasMajorGridlines = False
    ax2.HasTitle = True
    ax2.AxisTitle.Text = 'Values'
    ax2.AxisTitle.Font.Size = 10
    ax2.TickLabels.Font.Size = 8
    ax2.HasMajorGridlines = False
    cht.HasTitle = True
    #cht.ChartTitle.Caption = 'Plot'
    #cht.ChartTitle.Font.Size = 12

def draw_bar(cht,y,n,x,r,g,b,w,grad):
    aveg=np.mean(y)

    pt=[[0 for _ in range(2)] for _ in range(5)]
    pt[0][0]=shape_x(cht,x-w/2)
    pt[0][1]=shape_y(cht,cht.Axes(2).MinimumScale)
    pt[1][0]=shape_x(cht,x+w/2)
    pt[1][1]=shape_y(cht,cht.Axes(2).MinimumScale)
    pt[2][0]=shape_x(cht,x+w/2)
    pt[2][1]=shape_y(cht,aveg)
    pt[3][0]=shape_x(cht,x-w/2)
    pt[3][1]=shape_y(cht,aveg)
    pt[4][0]=pt[0][0]
    pt[4][1]=pt[0][1]
    shp=cht.Shapes.AddPolyline(pt)
    if grad:
        shp.Fill.ForeColor.RGB=xw.utils.rgb_to_int((r,g,b))
        shp.Fill.OneColorGradient(1,1,1)
        shp.Line.ForeColor.RGB=xw.utils.rgb_to_int((r,g,b))
        shp.Line.Weight=1.5
    else:
        shp.Fill.ForeColor.RGB=xw.utils.rgb_to_int((r,g,b))
        shp.Line.ForeColor.RGB=xw.utils.rgb_to_int((r,g,b))
        shp.Line.Weight=1.5

def draw_rnd_scatter(cht,x,y,n,w,r,g,b):
    rd=[]
    for i in range(n):
        rd.append(x-w/2+w*np.random.rand(1)[0])
    for i in range(n):
        bx=shape_x(cht,rd[i])
        by=shape_y(cht,y[i])
        ex=cht.PlotArea.InsideWidth/(cht.Axes(1).MaximumScale- \
        cht.Axes(1).MinimumScale)*0.09
        ey=ex
        shp=cht.Shapes.AddShape(9,bx,by,ex,ey)
        shp.Fill.ForeColor.RGB=xw.utils.rgb_to_int((r,g,b))
        shp.Line.Weight=1
        shp.Line.ForeColor.RGB=xw.utils.rgb_to_int((r,g,b))

root=os.getcwd()
app=xw.App(visible=True,add_book=False)
wb=app.books.open(root+r'/data.xlsx',read_only=False)
sht=wb.sheets('Sheet1')
data=sht.range('B2:C101').value
app.kill()

from comtypes.client import CreateObject
app2=CreateObject("Excel.Application")
app2.Visible=True
wb2=app2.Workbooks.Open(root+r'/data.xlsx')
sht2=wb2.Sheets('Sheet1')

shp=sht2.Shapes.AddChart2()
shp.Left=20
cht=shp.Chart
cht.ChartType=-4169
ax1=cht.Axes(1)
ax2=cht.Axes(2)
ax1.MinimumScale=0
ax1.MaximumScale=7
ax2.MinimumScale=0
ax2.MaximumScale=0.35

set_style(cht)

cht.SeriesCollection().NewSeries()

count1=count2=count3=count4=count5=count6=0
d1=[];d2=[];d3=[];d4=[];d5=[];d6=[]
for i in range(100):
    if data[i][1]==1:
        count1+=1
        d1.append(data[i][0])
    elif data[i][1]==2:
        count2+=1
        d2.append(data[i][0])
    elif data[i][1]==3:
        count3+=1
        d3.append(data[i][0])
    elif data[i][1]==4:
        count4+=1
        d4.append(data[i][0])
    elif data[i][1]==5:
        count5+=1
        d5.append(data[i][0])
    elif data[i][1]==6:
        count6+=1
        d6.append(data[i][0])

draw_bar(cht,d1,count1,1,76,200,132,0.5,False)
draw_bar(cht,d2,count2,2,76,200,132,0.5,False)
draw_bar(cht,d3,count3,3,76,200,132,0.5,False)
draw_bar(cht,d4,count4,4,76,200,132,0.5,False)
draw_bar(cht,d5,count5,5,76,200,132,0.5,False)
draw_bar(cht,d6,count6,6,76,200,132,0.5,False)

draw_rnd_scatter(cht,1,d1,count1,0.5,192,0,0)
draw_rnd_scatter(cht,2,d2,count2,0.5,255,192,0)
draw_rnd_scatter(cht,3,d3,count3,0.5,146,208,80)
draw_rnd_scatter(cht,4,d4,count4,0.5,0,176,80)
draw_rnd_scatter(cht,5,d5,count5,0.5,0,176,240)
draw_rnd_scatter(cht,6,d6,count6,0.5,0,112,192)

#wb2.Save()
#os.system('taskkill /f /im EXCEL.EXE')