Blog
How to use Application.ConstrainNumeric in the xlwings API way
The ConstrainNumeric member of the Excel Application object is a property that controls whether Excel restricts numeric entry to a specific set of characters. This setting is particularly useful in environments where data entry must be standardized, such as when using numeric keypads or in locales with specific decimal and thousands separators. When enabled, it limits the characters that can be typed into cells to digits (0-9), the decimal point (which may vary by locale), the minus sign (-), and the slash (/) for fractions. This helps prevent accidental input of non-numeric characters, ensuring data integrity in worksheets that require pure numeric values. In xlwings, this property can be accessed and modified to automate the configuration of Excel’s behavior during data entry tasks, making it valuable for scripting scenarios where consistent numeric input is critical.
In terms of syntax, the ConstrainNumeric property is a Boolean type. It can be set to True to enforce numeric constraints or False to disable them. The xlwings API provides a straightforward way to interact with this property through the Application object. The general syntax is:
app.constrain_numericHere, app refers to an instance of the xlwings App class, which represents the Excel application. The property is read/write, meaning you can both retrieve its current value and assign a new one. For example, to enable numeric constraints, you would set app.constrain_numeric = True. Conversely, to check the current setting, you can read it with current_setting = app.constrain_numeric. Note that in xlwings, property names are typically in snake_case to align with Python conventions, even though the original VBA property is in PascalCase (e.g., ConstrainNumeric in VBA becomes constrain_numeric in xlwings).
To illustrate the usage, consider the following xlwings code examples. First, you might want to ensure numeric constraints are active before performing data entry operations. This can be done by setting the property at the start of a script:
import xlwings as xw

# Connect to the active Excel instance or start a new one
app = xw.apps.active

# Enable ConstrainNumeric to restrict input to numeric characters
app.constrain_numeric = True

print("Numeric constraints are now enabled.")
In a more dynamic scenario, you might toggle the setting based on user input or specific conditions. For instance, if you are automating a workbook that requires temporary relaxation of numeric constraints for text entry, you could disable and re-enable it as needed:
import xlwings as xw

app = xw.apps.active

# Disable numeric constraints to allow non-numeric input
app.constrain_numeric = False
print("Numeric constraints disabled. You can now enter text or symbols.")

# Perform some operations that require non-numeric input
# ...

# Re-enable numeric constraints after the operations
app.constrain_numeric = True
print("Numeric constraints re-enabled.")
Additionally, you can retrieve the current setting to log or make decisions in your script. This is useful for ensuring that the Excel environment is configured as expected before proceeding with data processing:
import xlwings as xw

app = xw.apps.active

# Check the current state of ConstrainNumeric
if app.constrain_numeric:
    print("Numeric entry is currently constrained to digits, decimal, minus, and slash.")
else:
print("Numeric entry is not constrained; any characters can be input.")How To Create Custom Impact Chart Using xlwings?
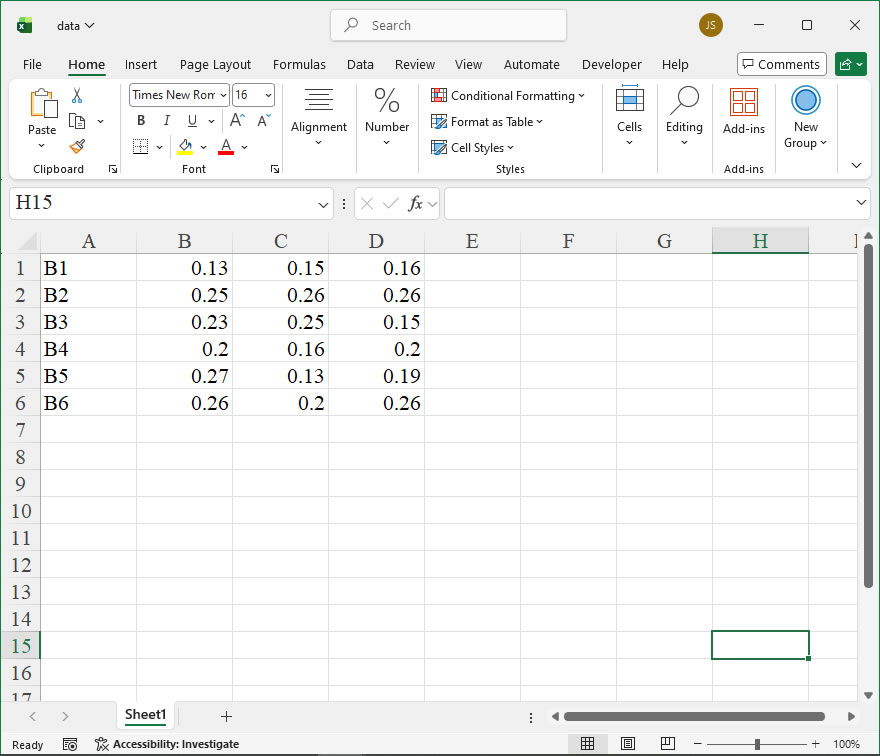
【Example】
【Code】
import xlwings as xw
import numpy as np
import os

def set_style(cht):
    cht.ChartArea.Format.Line.Visible=False
    cht.PlotArea.Format.Fill.Visible = False
    cht.PlotArea.Format.Line.Visible = True
    cht.PlotArea.Format.Line.ForeColor.RGB=xw.utils.rgb_to_int((200,200,200))
    #cht.PlotArea.Format.Line.ForeColor.ObjectThemeColor = msoThemeColorText1
    ax1 = cht.Axes(1)
    ax2 = cht.Axes(2)
    ax1.HasTitle = True
    ax1.AxisTitle.Text = 'Categories'
    ax1.AxisTitle.Font.Size = 10
    ax1.TickLabels.Font.Size = 8
    #ax1.TickLabels.NumberFormat = '0.00'
    ax1.HasMajorGridlines = False
    ax2.HasTitle = True
    ax2.AxisTitle.Text = 'Values'
    ax2.AxisTitle.Font.Size = 10
    ax2.TickLabels.Font.Size = 8
    ax2.HasMajorGridlines = False
    cht.HasTitle = True
    #cht.ChartTitle.Caption = 'Plot'
    #cht.ChartTitle.Font.Size = 12

def draw_poly_4(cht,pts,r,g,b,alpha):
    pt=[[0 for _ in range(2)] for _ in range(5)]
    pt[0][0]=shape_x(cht, pts[0][0])
    pt[0][1]=shape_y(cht, pts[0][1])
    pt[1][0]=shape_x(cht, pts[1][0])
    pt[1][1]=shape_y(cht, pts[1][1])
    pt[2][0]=shape_x(cht, pts[2][0])
    pt[2][1]=shape_y(cht, pts[2][1])
    pt[3][0]=shape_x(cht, pts[3][0])
    pt[3][1]=shape_y(cht, pts[3][1])
    pt[4][0]=pt[0][0]
    pt[4][1]=pt[0][1]
    shp=cht.Shapes.AddPolyline(pt)
    if alpha==0:
        shp.Fill.ForeColor.RGB=xw.utils.rgb_to_int((r,g,b))
    else:
        shp.Fill.Transparency=0.5
        shp.Fill.ForeColor.RGB=xw.utils.rgb_to_int((r,g,b))
    shp.Line.Visible=False


root=os.getcwd()
app=xw.App(visible=True,add_book=False)
wb=app.books.open(root+r'/data.xlsx',read_only=False)
sht=wb.sheets('Sheet1')
data=sht.range('B1:D6').value
app.kill()

from comtypes.client import CreateObject
app2=CreateObject("Excel.Application")
app2.Visible=True
app2.ScreenUpdating=False
wb2=app2.Workbooks.Open(root+r'/data.xlsx')
sht2=wb2.Sheets('Sheet1')

shp=sht2.Shapes.AddChart2()
shp.Left=20
cht=shp.Chart
cht.ChartType=-4169
ax1=cht.Axes(1)
ax2=cht.Axes(2)
ax1.MinimumScale=0
ax1.MaximumScale=7
ax2.MinimumScale=0
ax2.MaximumScale=0.9

set_style(cht)

cht.SeriesCollection().NewSeries()

dt=np.zeros([6,4])
for i in range(6):
    my_sum=0
    for j in range(3):
        #print(data[i][j])
        my_sum=my_sum+data[i][j]
        dt[i][j+1]=my_sum
colors=[[0,176,240],[146,208,80],[255,192,0]]

pts=np.zeros([4,2])
for i in range(6):
    for j in range(3):
        pts[0][0]=i+1-0.25
        pts[0][1]=dt[i][j]
        pts[1][0]=i+1+0.25
        pts[1][1]=dt[i][j]
        pts[2][0]=i+1+0.25
        pts[2][1]=dt[i][j+1]
        pts[3][0]=i+1-0.25
        pts[3][1]=dt[i][j+1]
        draw_poly_4(cht,pts,colors[j][0],colors[j][1],colors[j][2],0)

for i in range(5):
    for j in range(3):
        pts[0][0]=i+1+0.25
        pts[0][1]=dt[i][j]
        pts[1][0]=i+2-0.25
        pts[1][1]=dt[i+1][j]
        pts[2][0]=i+2-0.25
        pts[2][1]=dt[i+1][j+1]
        pts[3][0]=i+1+0.25
        pts[3][1]=dt[i][j+1]
        draw_poly_4(cht,pts,colors[j][0],colors[j][1],colors[j][2],1)

app2.ScreenUpdating=True

#wb2.Save()
#os.system('taskkill /f /im EXCEL.EXE')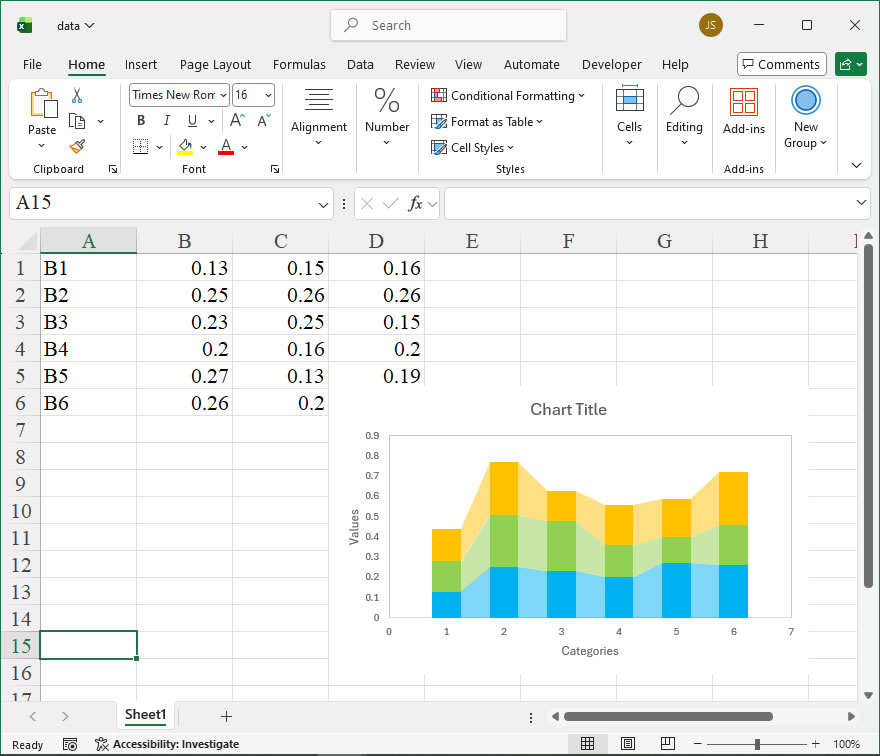
How to use Application.CommandUnderlines in the xlwings API way
The Application.CommandUnderlines property in Excel VBA controls the underline style used for menu command access keys (the underlined letter that, when pressed with the Alt key, activates a command). In the xlwings Python library, which provides a programmatic interface to Excel’s object model, you can access and manipulate this property to adjust the user interface behavior of the Excel application instance. This can be useful for ensuring consistency in application appearance or for automating UI configuration tasks in scripts that interact with Excel via xlwings.
Functionality
The CommandUnderlines property determines whether access key underlines in Excel menus and dialog boxes are always visible, visible only when the Alt key is pressed, or follow the system setting. This is a remnant of older UI conventions but can still be relevant for accessibility or specific user preference scenarios when automating Excel. In xlwings, you can both read the current setting and change it programmatically.
Syntax
In xlwings, you access this property through the app object, which represents the Excel Application. The property is exposed as a simple attribute.
app.api.CommandUnderlinesThis property accepts and returns an integer value corresponding to the XlCommandUnderlines enumeration. The primary values are:
| Value | Constant (VBA) | Description |
|---|---|---|
| 0 | xlCommandUnderlinesAutomatic | Underlines appear based on the system setting. |
| 1 | xlCommandUnderlinesOff | Underlines are never shown. |
| 2 | xlCommandUnderlinesOn | Underlines are always shown. |
Code Examples
Here are practical examples using xlwings to work with the CommandUnderlines property.
- Reading the Current Setting:
This code retrieves the current underline setting and prints a descriptive message.
import xlwings as xw

# Connect to the active Excel instance or start a new one
app = xw.apps.active

# Get the current CommandUnderlines setting
current_setting = app.api.CommandUnderlines

# Map the integer value to a description
setting_map = {
0: "Automatic (follows system)",
1: "Off (never shown)",
2: "On (always shown)"
}
description = setting_map.get(current_setting, "Unknown setting")
print(f"Current CommandUnderlines setting: {current_setting} ({description})")- Changing the Setting:
This script changes the setting to always show underlines.
import xlwings as xw

app = xw.apps.active

# Set CommandUnderlines to always show (xlCommandUnderlinesOn)
app.api.CommandUnderlines = 2 # You can also use the constant 2 directly

print("Command underlines are now set to be always visible.")- Toggling the Setting Based on Current State:
A more advanced example that toggles the setting between “On” and “Off”.
import xlwings as xw

app = xw.apps.active

current = app.api.CommandUnderlines
if current == 2: # If currently On
    new_setting = 1 # Turn Off
    print("Toggling command underlines OFF.")
else:
    new_setting = 2 # Otherwise, turn On
    print("Toggling command underlines ON.")

app.api.CommandUnderlines = new_settingHow To Create Custom Stacked Bar Chart Using xlwings?
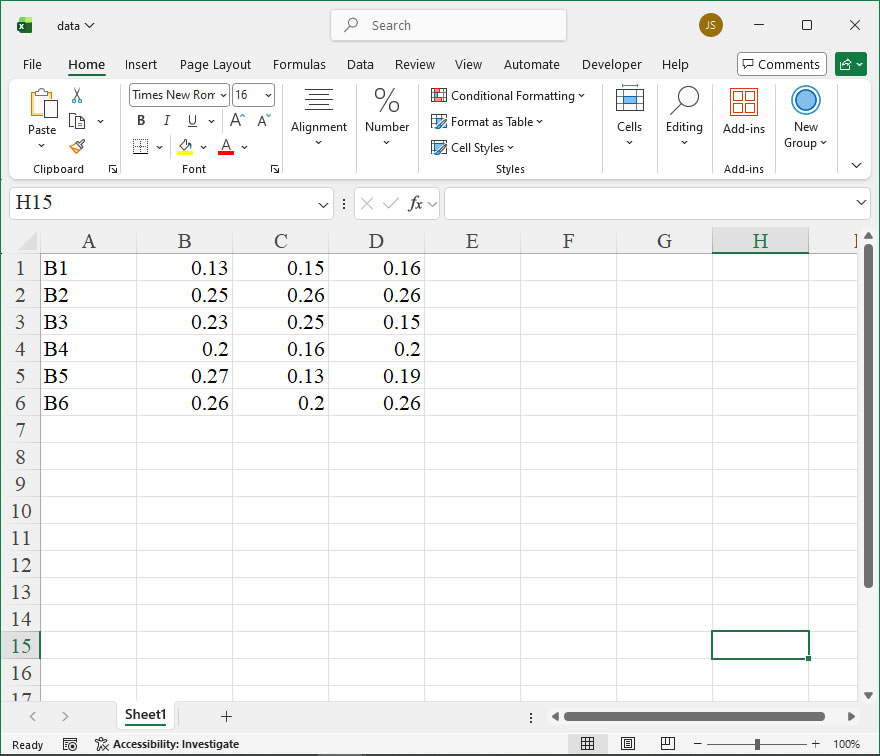
【Example】
【Code】
import xlwings as xw
import numpy as np
import os

def set_style(cht):
    cht.ChartArea.Format.Line.Visible=False
    cht.PlotArea.Format.Fill.Visible = False
    cht.PlotArea.Format.Line.Visible = True
    cht.PlotArea.Format.Line.ForeColor.RGB=xw.utils.rgb_to_int((200,200,200))
    #cht.PlotArea.Format.Line.ForeColor.ObjectThemeColor = msoThemeColorText1
    ax1 = cht.Axes(1)
    ax2 = cht.Axes(2)
    ax1.HasTitle = True
    ax1.AxisTitle.Text = 'Categories'
    ax1.AxisTitle.Font.Size = 10
    ax1.TickLabels.Font.Size = 8
    #ax1.TickLabels.NumberFormat = '0.00'
    ax1.HasMajorGridlines = False
    ax2.HasTitle = True
    ax2.AxisTitle.Text = 'Values'
    ax2.AxisTitle.Font.Size = 10
    ax2.TickLabels.Font.Size = 8
    ax2.HasMajorGridlines = False
    cht.HasTitle = True
    #cht.ChartTitle.Caption = 'Plot'
    #cht.ChartTitle.Font.Size = 12

def draw_poly_4(cht,pts,r,g,b):

    pt=[[0 for _ in range(2)] for _ in range(5)]
    pt[0][0]=shape_x(cht, pts[0][0])
    pt[0][1]=shape_y(cht, pts[0][1])
    pt[1][0]=shape_x(cht, pts[1][0])
    pt[1][1]=shape_y(cht, pts[1][1])
    pt[2][0]=shape_x(cht, pts[2][0])
    pt[2][1]=shape_y(cht, pts[2][1])
    pt[3][0]=shape_x(cht, pts[3][0])
    pt[3][1]=shape_y(cht, pts[3][1])
    pt[4][0]=pt[0][0]
    pt[4][1]=pt[0][1]
    shp=cht.Shapes.AddPolyline(pt)
    shp.Fill.ForeColor.RGB=xw.utils.rgb_to_int((r,g,b))
    #shp.Fill.Transparency=0.5
    #shp.Line.ForeColor.RGB=xw.utils.rgb_to_int((r,g,b))
    #shp.Line.Weight=1.5
    shp.Line.Visible=False


root=os.getcwd()
app=xw.App(visible=True,add_book=False)
wb=app.books.open(root+r'/data.xlsx',read_only=False)
sht=wb.sheets('Sheet1')
data=sht.range('B1:D6').value
app.kill()

from comtypes.client import CreateObject
app2=CreateObject("Excel.Application")
app2.Visible=True
app2.ScreenUpdating=False
wb2=app2.Workbooks.Open(root+r'/data.xlsx')
sht2=wb2.Sheets('Sheet1')

shp=sht2.Shapes.AddChart2()
shp.Left=20
cht=shp.Chart
cht.ChartType=-4169
ax1=cht.Axes(1)
ax2=cht.Axes(2)
ax1.MinimumScale=0
ax1.MaximumScale=7
ax2.MinimumScale=0
ax2.MaximumScale=0.9

set_style(cht)

cht.SeriesCollection().NewSeries()

dt=np.zeros([6,4])
for i in range(6):
    my_sum=0
    for j in range(3):
        #print(data[i][j])
        my_sum=my_sum+data[i][j]
        dt[i][j+1]=my_sum
colors=[[0,176,240],[146,208,80],[255,192,0]]

pts=np.zeros([4,2])
for i in range(6):
    for j in range(3):
        pts[0][0]=i+1-0.25
        pts[0][1]=dt[i][j]
        pts[1][0]=i+1+0.25
        pts[1][1]=dt[i][j]
        pts[2][0]=i+1+0.25
        pts[2][1]=dt[i][j+1]
        pts[3][0]=i+1-0.25
        pts[3][1]=dt[i][j+1]
        draw_poly_4(cht,pts,colors[j][0],colors[j][1],colors[j][2])

app2.ScreenUpdating=True

#wb2.Save()
#os.system('taskkill /f /im EXCEL.EXE')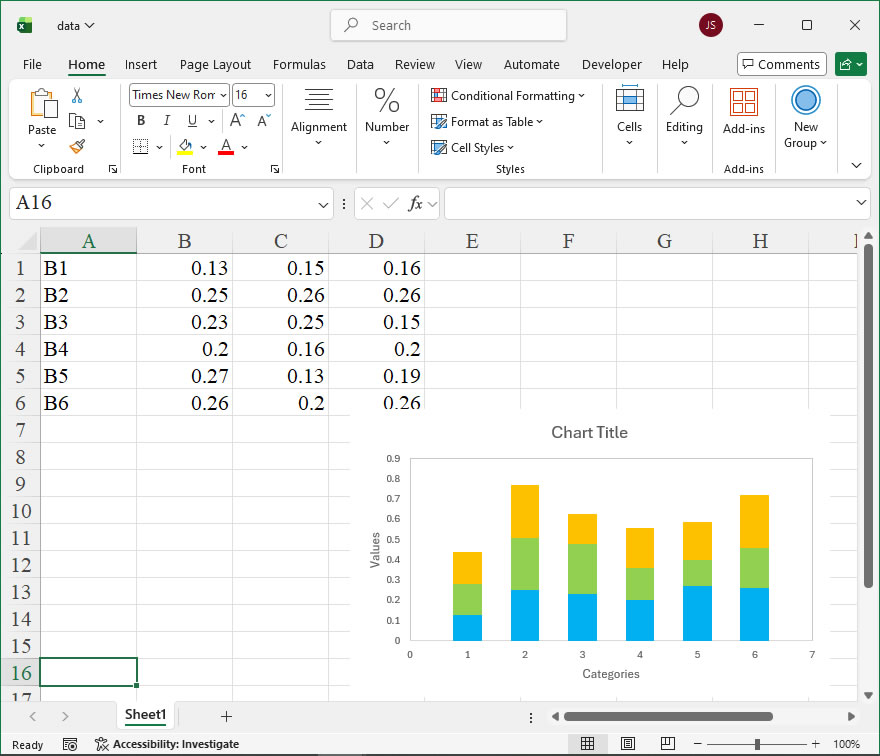
How to use Application.CommandBars in the xlwings API way
The CommandBars member of the Application object in Excel’s object model represents the collection of all command bars, which include toolbars and menus, in the application. In modern Excel, command bars are largely superseded by the Ribbon interface, but they remain accessible for compatibility and custom UI development. Using xlwings, you can interact with CommandBars to customize or retrieve information about these UI elements programmatically.
The xlwings API provides a way to access the CommandBars collection through the Application object. The syntax for accessing it is straightforward: app.api.CommandBars. Here, app is an instance of the xlwings App class, which represents the Excel application. The .api property exposes the underlying COM object, allowing direct use of Excel’s VBA object model members. The CommandBars object itself is a collection, and you can reference specific command bars by name or index. For example, app.api.CommandBars("Standard") refers to the Standard toolbar. Key methods and properties include:
Count: Returns the number of command bars.Item(index): Retrieves a specificCommandBarobject by index or name.Add(Name, Position, MenuBar, Temporary): Creates a new custom command bar. Parameters:Name(string, the bar’s name),Position(integer, e.g.,1for top,2for left),MenuBar(boolean, whether it’s a menu bar),Temporary(boolean, deleted on Excel exit).
To use these, you can call methods directly on app.api.CommandBars. For instance, to add a custom toolbar, you might specify Position as 1 (msoBarTop) from the MsoBarPosition enumeration. Note that xlwings does not have built-in constants for these enumerations; you may need to define them or use their integer values based on Microsoft documentation.
Here is a code example demonstrating the use of CommandBars with xlwings. This script lists all command bars and creates a custom one, adding a button to run a simple macro.
import xlwings as xw

# Connect to the active Excel instance
app = xw.apps.active

# Access the CommandBars collection
command_bars = app.api.CommandBars

# Print the count and names of all command bars
print(f"Total command bars: {command_bars.Count}")
for i in range(1, command_bars.Count + 1):
    cb = command_bars.Item(i)
    print(f" {i}: {cb.Name}")

# Define constants for MsoBarPosition (from Microsoft documentation)
msoBarTop = 1
msoBarLeft = 2
msoBarRight = 3
msoBarBottom = 4
msoBarFloating = 5
msoBarPopup = 6

# Add a custom command bar (toolbar)
custom_bar = command_bars.Add(Name="MyCustomBar", Position=msoBarTop, MenuBar=False, Temporary=True)
print(f"Created custom bar: {custom_bar.Name}")

# Add a button to the custom bar (using CommandBarControls)
# Note: This requires further setup with OnAction to link to a macro
button = custom_bar.Controls.Add(Type=1) # Type 1 is msoControlButton
button.Caption = "Run Macro"
button.TooltipText = "Click to execute a macro"

# Make the custom bar visible
custom_bar.Visible = True

# Clean up: Delete the custom bar (optional, since Temporary=True will remove it on exit)
# custom_bar.Delete()How to use Application.COMAddIns in the xlwings API way
The Application.COMAddIns property in Excel’s object model provides access to the collection of currently installed COM add-ins. This is particularly useful for developers who need to programmatically check, manage, or interact with these add-ins from within Python using the xlwings library. COM add-ins extend Excel’s functionality, and accessing them via xlwings allows for automation tasks such as verifying if a specific add-in is loaded, enabling or disabling add-ins, or retrieving details about them.
Functionality:
The COMAddIns collection enables you to:
- Count the number of installed COM add-ins.
- Iterate through each COM add-in to get its ProgID (Programmatic Identifier), description, and connection state (whether it is loaded or not).
- Activate or deactivate an add-in programmatically.
- This is essential for ensuring that dependent add-ins are available before executing macros or functions that rely on them, improving script robustness.
Syntax in xlwings:
In xlwings, you access this property through the api property of the App or Application object. The typical call format is:
app = xw.App() # or xw.apps.active for an existing instance
com_addins = app.api.COMAddIns
Once you have the collection, you can use its methods and properties. Key members include:
Count: Returns the number of COM add-ins (integer).Item(index): Retrieves a specific COMAddIn object, whereindexcan be an integer (1-based) or the add-in’s ProgID (string).Update(): Updates the list of COM add-ins from the registry.
For a COMAddIn object, important properties are:
ProgId: The programmatic identifier (string).Description: A descriptive name (string).Connect: A boolean indicating if the add-in is currently loaded (True/False). Setting this property enables or disables the add-in.
Example Usage:
Below is a practical xlwings code example that demonstrates how to list all COM add-ins and toggle one add-in’s state:
import xlwings as xw

# Connect to the active Excel instance
app = xw.apps.active

# Access the COMAddIns collection
com_addins = app.api.COMAddIns

# Print the number of add-ins
print(f"Total COM add-ins: {com_addins.Count}")

# Iterate through each add-in and display details
for i in range(1, com_addins.Count + 1):
    addin = com_addins.Item(i)
    print(f"Add-in {i}:")
    print(f" ProgID: {addin.ProgId}")
    print(f" Description: {addin.Description}")
    print(f" Loaded: {addin.Connect}")

# Example: Toggle the state of a specific add-in by ProgID
target_progid = "Example.AddIn" # Replace with an actual ProgID
try:
    specific_addin = com_addins.Item(target_progid)
    current_state = specific_addin.Connect
    specific_addin.Connect = not current_state # Toggle the state
    print(f"Toggled add-in '{target_progid}' from {current_state} to {specific_addin.Connect}")
except Exception as e:
    print(f"Add-in '{target_progid}' not found or error: {e}")

# Optional: Update the collection
com_addins.Update()How to use Application.Columns in the xlwings API way
The Application.Columns property in the xlwings API provides a powerful way to reference and manipulate entire columns within an Excel application context. It returns a Range object that represents all the columns in the active sheet, or more specifically, it can be used to refer to columns in a general sense, though its direct use is often through the active workbook’s sheets. In xlwings, this is typically accessed via the app object, which represents the Excel Application.
Functionality:
The primary function is to obtain a Range object representing all columns on a worksheet. This is useful for applying formatting, setting column widths, or performing operations across every column. It serves as a starting point for more specific column selections, such as Columns(1) for the first column or Columns("A:C") for a range of columns.
Syntax:
In xlwings, the syntax is:app.api.Columns
or, more commonly when working with a specific sheet:sheet.api.Columns
This accesses the underlying Excel VBA Columns property via the api object. The property itself can take an optional index argument to specify which column(s) to return.
- Index (Optional): Can be a column number (integer) or a column letter (string). If omitted, it returns a collection of all columns on the worksheet.
- Example:
Columns(1)orColumns("A")returns the first column. - Example:
Columns("A:C")returns columns A through C.
Examples:
- Set the width of all columns:
import xlwings as xw
app = xw.App(visible=False)
wb = app.books.open('example.xlsx')
sheet = wb.sheets[0]

# Set width of every column to 15
sheet.api.Columns.ColumnWidth = 15- Format the first column (A) with bold font:
sheet.api.Columns(1).Font.Bold = True
# Alternatively using column letter:
sheet.api.Columns("A").Font.Bold = True- Hide columns B through D:
sheet.api.Columns("B:D").Hidden = True- AutoFit a range of columns:
# AutoFit columns A to E
sheet.api.Columns("A:E").AutoFit()- Apply a border to all columns:
from xlwings.constants import LineStyle, BorderWeight
all_columns = sheet.api.Columns
all_columns.Borders.LineStyle = LineStyle.xlContinuous
all_columns.Borders.Weight = BorderWeight.xlThin
Notes:
- Using
app.api.Columnsdirectly (without a sheet reference) typically targets the active sheet. It’s more reliable to explicitly reference a sheet object. - The
Columnsproperty is part of theWorksheetobject in Excel’s object model. In xlwings, you access it viasheet.api.Columns. - This property is read-write; you can both retrieve and set properties on the returned
Rangeobject.
How To Set Vector Format Output Using xlwings?
【Example】
import xlwings as xw
import os

def set_style(cht):
    cht.ChartArea.Format.Line.Visible=False
    cht.PlotArea.Format.Fill.Visible=False
    cht.PlotArea.Format.Line.Visible=True
    cht.PlotArea.Format.Line.ForeColor.RGB=xw.utils.rgb_to_int((200,200,200))
    #cht.PlotArea.Format.Line.ForeColor.ObjectThemeColor = msoThemeColorText1
    ax1=cht.Axes(1)
    ax2=cht.Axes(2)
    ax1.HasTitle=True
    ax1.AxisTitle.Text='Categories'
    ax1.AxisTitle.Font.Size=10
    ax1.TickLabels.Font.Size=8
    #ax1.TickLabels.NumberFormat='0.00'
    ax1.HasMajorGridlines=False
    ax2.HasTitle=True
    ax2.AxisTitle.Text='Values'
    ax2.AxisTitle.Font.Size=10
    ax2.TickLabels.Font.Size=8
    ax2.HasMajorGridlines=False
    cht.HasTitle=True
    #cht.ChartTitle.Caption='Plot'
    #cht.ChartTitle.Font.Size=12

root=os.getcwd()
app=xw.App(visible=True,add_book=False)
wb=app.books.open(root+r'/data.xlsx',read_only=False)
sht=wb.sheets('Sheet1')

sht.api.Range('A2:C11').Select()
shp=sht.api.Shapes.AddChart2(-1,xw.constants.ChartType.xlColumnClustered,20,20,350,250,True)
cht=shp.Chart

set_style(cht)

#wb.save()
#app.kill()How to use Application.ClusterConnector in the xlwings API way
The ClusterConnector member of the Application object in Excel’s object model is a specialized interface for managing connections to Power Pivot data models in a clustered environment, such as SQL Server Analysis Services (SSAS) tabular models. In xlwings, this provides programmatic control over how Excel interacts with these external data sources, enabling automation of data refresh and connection management within a workbook. This is particularly useful in enterprise scenarios where data models are hosted on scalable, high-availability servers.
Syntax in xlwings:
The property is accessed through the Application object. In xlwings, the Application is typically represented by the app object when you instantiate Excel.
app.api.ActiveWorkbook.ClusterConnectorNote: ClusterConnector is a property that returns a WorkbookConnection object when the active workbook is connected to a Power Pivot model in a cluster. It is not a method. This property is read-only in the context of xlwings via the Excel API.
Key Functionality and Usage:
The primary purpose is to retrieve the connection string and details of the clustered Power Pivot connection. You can inspect properties like OLEDBConnection.Server and OLEDBConnection.Connection to understand the data source. This allows for verification or logging of connection parameters. It’s important to note that directly modifying the ClusterConnector via xlwings is limited; its main use is for informational purposes or to trigger a refresh of the connected model.
Code Examples:
- Retrieving Cluster Connection Details:
This example checks if the active workbook has a cluster connector and prints its server name and connection string.
import xlwings as xw

# Connect to the active Excel instance
app = xw.apps.active

# Ensure a workbook is active
if app.books.active is not None:
    wb = app.books.active
    try:
        # Access the ClusterConnector property
        cluster_conn = wb.api.ClusterConnector

        # Get the OLEDB connection details
        oledb_conn = cluster_conn.OLEDBConnection
        print(f"Server: {oledb_conn.Server}")
        print(f"Connection String: {oledb_conn.Connection}")

        # Check if it's a Power Pivot connection
        if cluster_conn.Type == 5: # xlConnectionTypeOLEDB for Power Pivot
        print("This is a Power Pivot cluster connection.")
    except AttributeError:
print("No active Power Pivot cluster connection found in this workbook.")- Refreshing Data via Cluster Connection:
This example refreshes all data connections, including the Power Pivot model connected through the cluster.
import xlwings as xw

app = xw.apps.active
wb = app.books.active

# Refresh all data in the workbook, which includes the cluster-connected model
wb.api.RefreshAll()

# Alternatively, refresh a specific connection if known
# wb.connections["YourConnectionName"].Refresh()
Important Notes:
- The
ClusterConnectorproperty is only available if the workbook contains a Power Pivot data model connected to an SSAS cluster. Otherwise, accessing it may raise anAttributeError. - In xlwings, you interact with this through the underlying Excel API (
.apiattribute), so a solid understanding of the Excel object model is beneficial. - For automation, common tasks involve refreshing data, but direct manipulation of cluster settings (like changing the server) is typically done through Excel’s UI or server-side configuration, not via this property in xlwings.
How To Save Chart as a Bitmap Image Using xlwings?
【Example】
import xlwings as xw
import os

def set_style(cht):
    cht.ChartArea.Format.Line.Visible=False
    cht.PlotArea.Format.Fill.Visible=False
    cht.PlotArea.Format.Line.Visible=True
    cht.PlotArea.Format.Line.ForeColor.RGB=xw.utils.rgb_to_int((200,200,200))
    #cht.PlotArea.Format.Line.ForeColor.ObjectThemeColor = msoThemeColorText1
    ax1=cht.Axes(1)
    ax2=cht.Axes(2)
    ax1.HasTitle=True
    ax1.AxisTitle.Text='Categories'
    ax1.AxisTitle.Font.Size=10
    ax1.TickLabels.Font.Size=8
    #ax1.TickLabels.NumberFormat='0.00'
    ax1.HasMajorGridlines=False
    ax2.HasTitle=True
    ax2.AxisTitle.Text='Values'
    ax2.AxisTitle.Font.Size=10
    ax2.TickLabels.Font.Size=8
    ax2.HasMajorGridlines=False
    cht.HasTitle=True
    #cht.ChartTitle.Caption='Plot'
    #cht.ChartTitle.Font.Size=12

root=os.getcwd()
app=xw.App(visible=True,add_book=False)
wb=app.books.open(root+r'/data.xlsx',read_only=False)
sht=wb.sheets('Sheet1')

sht.api.Range('A2:C8').Select()
shp=sht.api.Shapes.AddChart2(-1,xw.constants.ChartType.xlColumnClustered,20,20,350,250,True)
cht=shp.Chart

set_style(cht)

#wb.save()
#app.kill()