Method
Use the `AddCurve` method of the Shapes object to create a curve. The method syntax is:
sht.api.Shapes.AddCurve(SafeArrayOfPoints)
Where `sht` refers to a worksheet object. The parameter `SafeArrayOfPoints` specifies the coordinates of the Bezier curve’s vertices and control points. The number of points should always be 3n + 1, where n is the number of line segments in the curve. This method returns a Shape object representing the Bezier curve.
Vertices are represented by their x and y coordinates as pairs, and all vertices are provided as a 2D list. For example:
pts=[[0,0],[72,72],[100,40],[20,50],[90,120],[60,30],[150,90]]
Use the COMTypes package for drawing:
from comtypes.client import CreateObject
app2=CreateObject(“Excel.Application”)
app2.Visible=True
bk2=app2.Workbooks.Add()
sht2=bk2.Sheets(1)
pts=[[0,0],[72,72],[100,40],[20,50],[90,120],[60,30],[150,90]] #顶点
sht2.Shapes.AddCurve(pts) #Add Bezier curve
Sample Code
#Auto-fill formulas

import xlwings as xw    #Import the xlwings package
import os    #Import the os package

root = os.getcwd()    #Get the current path
#Create an Excel application window, visible,
#without opening a workbook
app=xw.App(visible=True, add_book=False)
#Open a data file, writable
bk=app.books.open(fullname=root+r'\AutoFill.xlsx',read_only=False)
sht=bk.api.Sheets(1)    #Get the worksheet

#Auto-fill formulas
sht.Range('C1').Formula='=$A1+$B1'
sht.Range('C1:C5').FillDown()

#bk.save()
#bk.close()
#app.kill()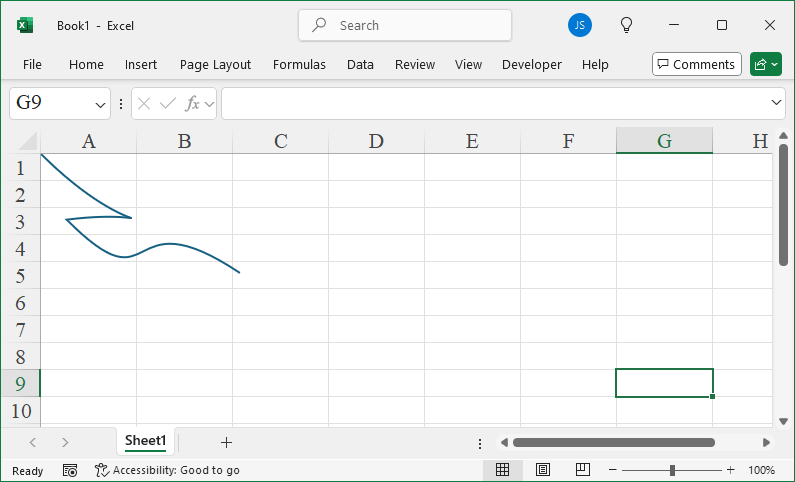
Leave a Reply