Archive

How To Create WordArt Using xlwings?

Method

Use the `AddTextEffect` method of the `Shapes` object to create WordArt. The syntax is:

sht.api.Shapes.AddTextEffect(PresetTextEffect,Text,FontName,FontSize,FontBold,FontItalic, Left, Top)

Where `sht` is the current worksheet. The parameters are explained in the table below.

Name

Required/Optional

Data Type

Description

PresetTextEffect

Required

MsoPresetTextEffect

Predefined text effect

Text

Required

String

Text for WordArt

FontName

Required

String

Font name used for WordArt

FontSize

Required

Single

Font size (in points) used in WordArt

FontBold

Required

MsoTriState

Whether the font is bold

FontItalic

Required

MsoTriState

Whether the font is italic

Left

Required

Single

Horizontal coordinate of the upper-left corner

Top

Required

Single

Vertical coordinate of the upper-left corner

Name

Value

Description

msoTextEffect1

0

First text effect

msoTextEffect2

1

Second text effect

msoTextEffect3

2

Third text effect

……


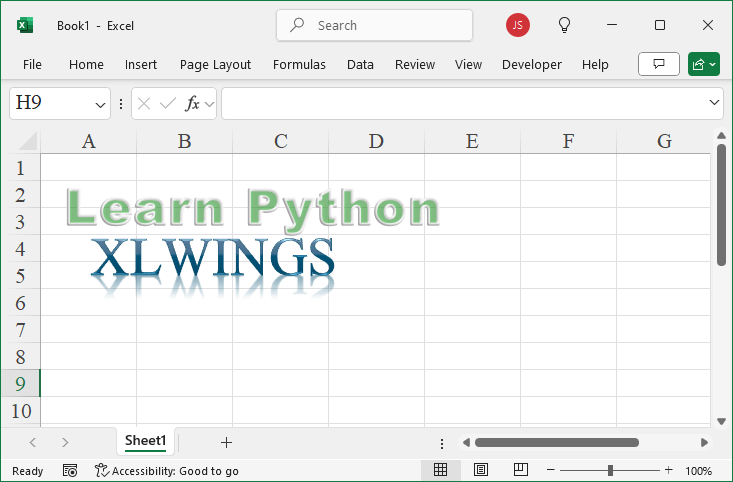
sht.api.Shapes.AddTextEffect(9,’Learn Python’,’Arial Black’,36,False,False,10,10)

sht.api.Shapes.AddTextEffect(29,’xlwings’,’Times New Roman’,40,False,False,30,50)

Sample Code

#Drawing WordArt

import xlwings as xw    #Import xlwings package

app=xw.App()
bk=app.books.active   #Get the active workbook
sht=bk.sheets.active    #Get the active worksheet

sht.api.Shapes.AddTextEffect(9,'Learn Python','Arial Black',36,False,False,10,10)
sht.api.Shapes.AddTextEffect(29,'xlwings','Times New Roman',40,False,False,30,50)

#bk.save()
#bk.close()
#app.kill()
Create WordArt Using xlwings

How To Create Chart Using xlwings?

Method

Use the `AddChart2` method of the `Shapes` object to create a chart. The syntax is: 

sht.api.Shapes.AddChart2(Style, XlChartType, Left, Top, Width, Height, NewLayout)

Where `sht` is the current worksheet. There are 7 parameters, all optional.

  • Style:Chart style, -1 represents the default style for the chart type
  • xlChartType:Chart type, using values from the `XlChartType` enumeration, a part of which is listed below
  • Left:Left position of the chart, centered horizontally if omitted
  • Top:Top position of the chart, centered vertically if omitted
  • Width:Width of the chart, default is 354 if omitted
  • Height:Height of the chart, default is 210 if omitted
  • NewLayout:Determines the chart layout. If `True`, legends are shown only for composite charts

Name

Value

Description

xlArea

1

Area chart

xlLine

4

Line chart

xlPie

5

Pie chart

xlBarClustered

57

Clustered bar chart

xlBarStacked

58

Stacked bar chart

xlXYScatter

-4169

XY scatter chart

xlBubble

个

Bubble chart

xlSurface

83

3D Surface chart

……


sht.api.Range(‘A1’).CurrentRegion.Select()

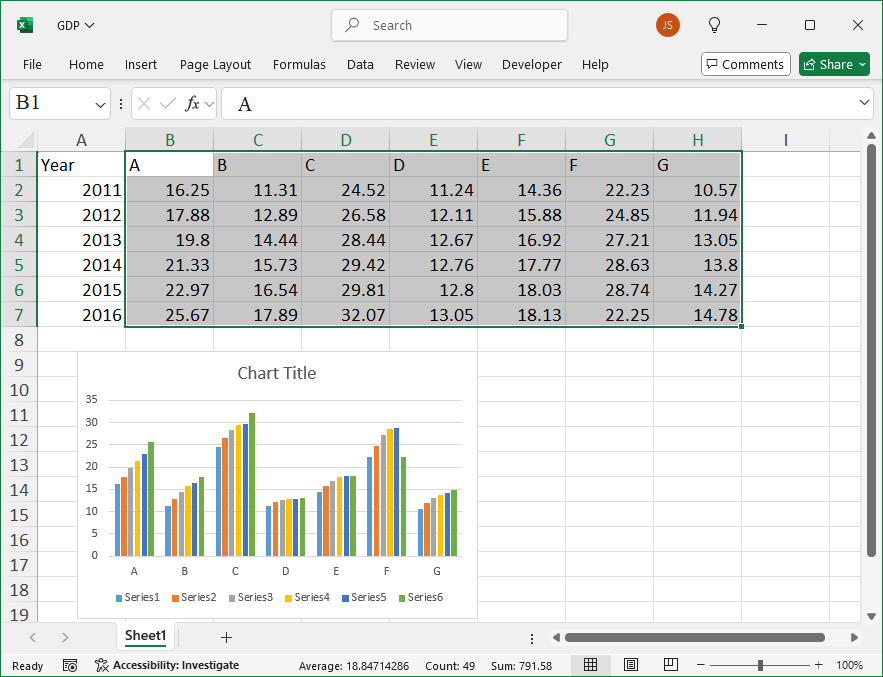
sht.api.Shapes.AddChart2(-1,xw.constants.ChartType.xlColumnClustered,30,150,300,200,True)

Sample Code

#Drawing charts

import xlwings as xw
import os

root = os.getcwd()
app = xw.App(visible=True, add_book=False)
wb=app.books.open(root+r'/GDP.xlsx',read_only=False)
sht=wb.sheets(1)

sht.api.Range('B1:H7').Select()
sht.api.Shapes.AddChart2(-1,xw.constants.ChartType.xlColumnClustered,30,150,300,200,True)

#bk.save()
#bk.close()
#app.kill()
Create Chart Using xlwings

How To Create AutoShapes Using xlwings?

Method

AutoShapes are predefined shapes in Excel. Use the `AddShape` method of the `Shapes` object to create AutoShapes.

Name

Value

Description

msoShapeOval

9

Oval

msoShapeOvalCallout

107

Oval callout

msoShapeParallelogram

12

Slanted parallelogram

msoShapePie

142

Pie (sector) missing parts

msoShapeQuadArrow

39

Arrows pointing up, down, left, right

msoShapeQuadArrowCallout

59

Callout with directional arrows

msoShapeRectangle

1

Rectangle

msoShapeRectangularCallout

105

Rectangular callout

msoShapeRightArrow

33

Right arrow

msoShapeRightArrowCallout

53

Callout with right arrow

msoShapeRightBrace

32

Right brace

msoShapeRightBracket

30

Right bracket

msoShapeRightTriangle

utf-8

Right-angle triangle

msoShapeRound1Rectangle

151

Rectangle with one rounded corner

msoShapeRound2DiagRectangle

157

Rectangle with two rounded corners diagonally opposite

msoShapeRound2SameRectangle

152

Rectangle with two rounded corners on the same side

msoShapeRoundedRectangle

5

Rounded rectangle

msoShapeRoundedRectangularCallout

106

Rounded rectangular callout

……


sht.api.Shapes.AddShape(1, 50, 50, 100, 200)

sht.api.Shapes.AddShape(12, 250, 50, 100, 100)

sht.api.Shapes.AddShape(17, 450, 50, 100, 100)

Sample Code

#Drawing shapes

import xlwings as xw    #Import xlwings package

app=xw.App()
bk=app.books.active   #Get the active workbook
sht=bk.sheets.active    #Get the active worksheet

sht.api.Shapes.AddShape(1, 50, 50, 100, 200)
sht.api.Shapes.AddShape(12, 250, 50, 100, 100)
sht.api.Shapes.AddShape(17, 450, 50, 100, 100)

#bk.save()
#bk.close()
#app.kill()
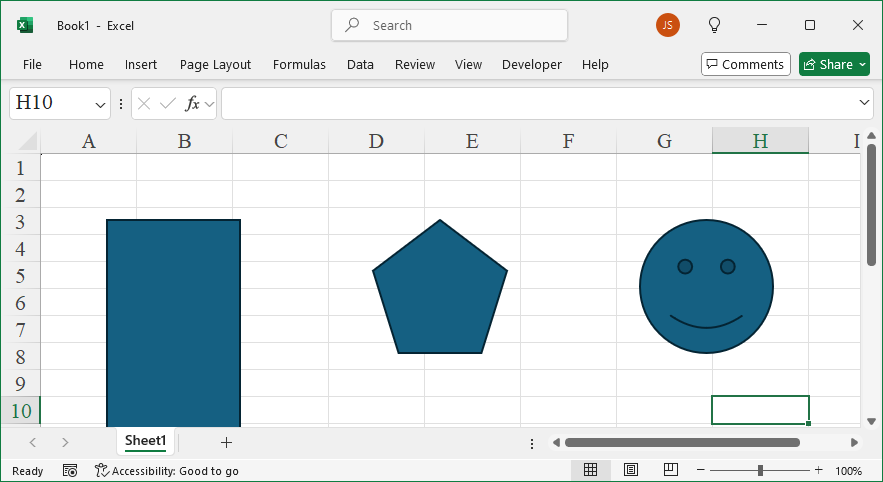
Create AutoShapes Using xlwings

How To Create Callout 2 Using xlwings?

Method

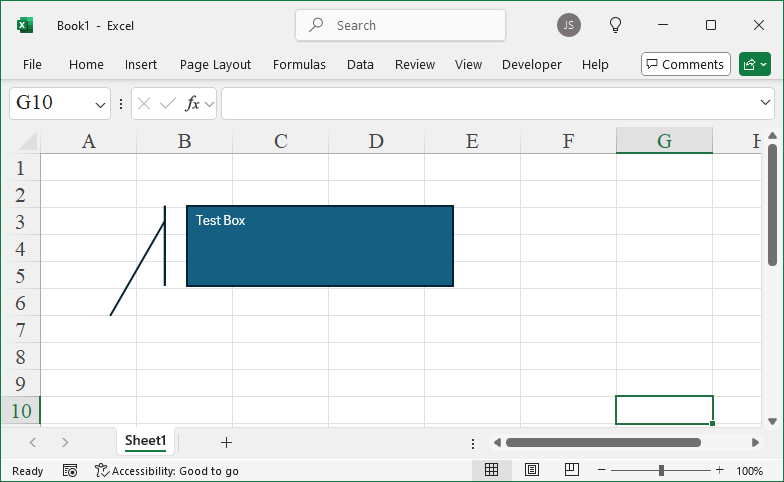
shp=sht.api.Shapes.AddCallout(2, 110, 40, 200, 60)

shp.TextFrame2.TextRange.Characters.Text=’Test Box’

shp.Callout.Accent=True

shp.Callout.Border=True

shp.Callout.Angle=2

Sample Code

#Assign a formula as a name

import xlwings as xw    #Import the xlwings package
import os    #Import the os package

root = os.getcwd()    #Get the current path
#Create an Excel application window, visible, 
#without opening a workbook  
app=xw.App()
bk=app.books.active
sht=bk.api.Sheets(1)    #Get the worksheet

#Assign a formula as a name
sht.Range('A1:C3').Value=10
sht.Names.Add(Name='SM',RefersTo='=SUM($A$1:$C$3)')
sht.Range('D4').Formula='=SM+3'

#bk.save()
#bk.close()
#app.kill()

How To Create Callout Using xlwings?

Method

Use the `AddCallout` method of the `Shapes` object to add a callout. The syntax is: 


sht.api.Shapes.AddCallout(Type,Left,Top,Width,Height)


Where `sht` represents a worksheet object. The parameters are explained in the table below. This method returns a `Shape` object representing the callout.


The `Type` parameter values are from the `MsoCalloutType` enumeration, which specifies the type of the callout line.


Name

Value

Description

msoCalloutFour

4

A callout line composed of two segments, attached to the right of the text box

msoCalloutMixed

-2

A mixed combination of states

msoCalloutOne

1

A single-segment horizontal callout line

msoCalloutThree

3

A callout line composed of two segments, attached to the left of the text box

msoCalloutTwo

2

A single-segment angled callout line


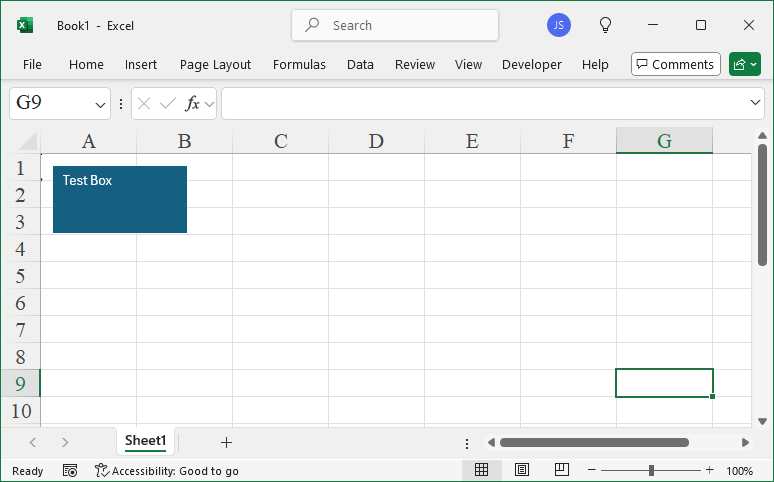
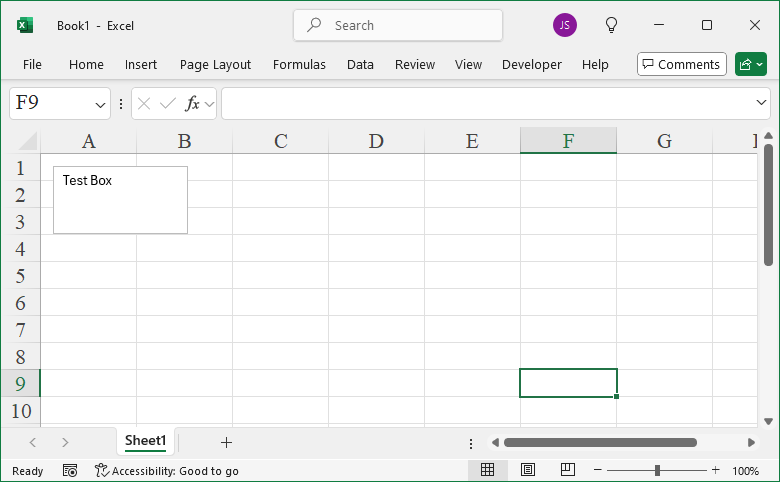
shp=sht.api.Shapes.AddCallout(2, 10, 10, 100, 50)

shp.TextFrame2.TextRange.Characters.Text=’Test Box’

Sample Code

#Assign a formula as a name

import xlwings as xw    #Import the xlwings package
import os    #Import the os package

root = os.getcwd()    #Get the current path
#Create an Excel application window, visible, 
#without opening a workbook  
app=xw.App()
bk=app.books.active
sht=bk.api.Sheets(1)    #Get the worksheet

#Assign a formula as a name
sht.Range('A1:C3').Value=10
sht.Names.Add(Name='SM',RefersTo='=SUM($A$1:$C$3)')
sht.Range('D4').Formula='=SM+3'

#bk.save()
#bk.close()
#app.kill()
Create Callout Using xlwings

How To Create Text Box Using xlwings?

Method

Use the `AddTextbox` method of the `Shapes` object to create a text box. The calling format and parameters are similar to the `AddLabel` method.


shp=sht.api.Shapes.AddTextbox(1,10,10,100,50)

shp.TextFrame2.TextRange.Characters.Text=’Test Box’

Sample Code

#Create formulas using defined names

import xlwings as xw    #Import the xlwings package
import os    #Import the os package

root = os.getcwd()    #Get the current path
#Create an Excel application window, visible, 
#without opening a workbook  
app=xw.App()
bk=app.books.active
sht=bk.api.Sheets(1)    #Get the worksheet

#Create formulas using defined names
sht.Range('C3').Value=10
sht.Names.Add(Name='NMT',RefersTo=sht.Range('C3').Value)
sht.Range('A1').Formula='=NMT+3'

#bk.save()
#bk.close()
#app.kill()
Create Text Box Using xlwings

How To Create Labels Using xlwings?

Method

Use the `AddLabel` method of the `Shapes` object to create a label. The syntax is: 


sht.api.Shapes.AddLabel(Orientation,Left,Top,Width,Height)


Where `sht` represents a worksheet object. This method returns a `Shape` object that represents the label.


Name

Value

Description

msoTextOrientationDownward

3

Downward

msoTextOrientationHorizontal

1

Horizontal

msoTextOrientationHorizontalRotatedFarEast

6

Horizontal and rotated for East Asian languages support

msoTextOrientationMixed

-2

Not supported

msoTextOrientationUpward

2

Upward

msoTextOrientationVertical

5

Vertical

msoTextOrientationVerticalFarEast

4

Vertical for East Asian languages support


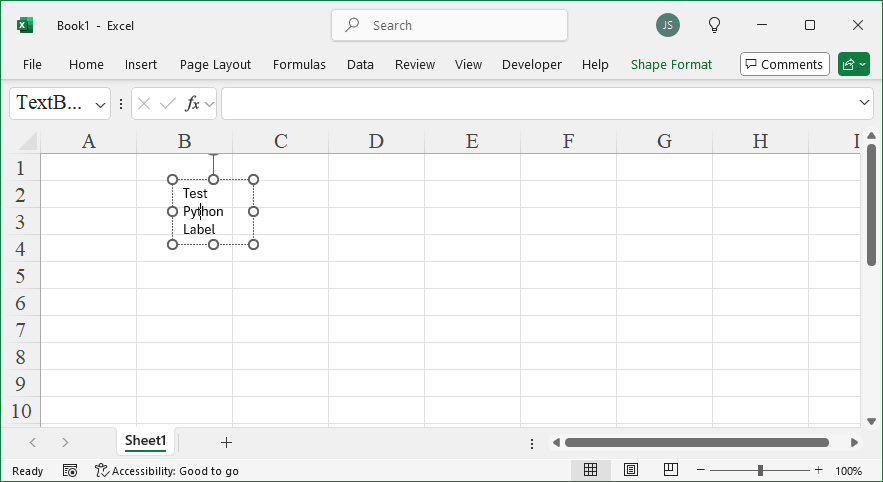
shp=sht.api.Shapes.AddLabel(1,100,20,60,150)    #Add labels

shp.TextFrame2.TextRange.Characters.Text =’Test Python Label’    #Label text

Sample Code

#Hide formulas 

import xlwings as xw    #Import the xlwings package
import os    #Import the os package

root = os.getcwd()    #Get the current path
#Create an Excel application window, visible, 
#without opening a workbook  
app=xw.App()
bk=app.books.active
sht=bk.api.Sheets(1)    #Get the worksheet

#Hide formulas 
sht.Range('C1').Value=10
sht.Range('A1').Formula='=C1+2'
sht.Range('B1').Formula='=C1+5'
rng=sht.Range('A1:B1')
rng.FormulaHidden=True
sht.Protect()

#bk.save()
#bk.close()
#app.kill()
Create Labels Using xlwings

How To Create Curves Using xlwings?

Method

Use the `AddCurve` method of the Shapes object to create a curve. The method syntax is:


sht.api.Shapes.AddCurve(SafeArrayOfPoints)


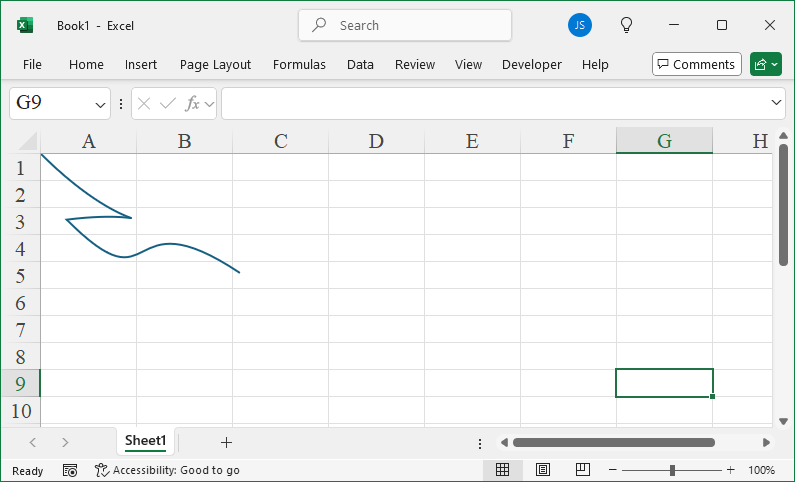
Where `sht` refers to a worksheet object. The parameter `SafeArrayOfPoints` specifies the coordinates of the Bezier curve’s vertices and control points. The number of points should always be 3n + 1, where n is the number of line segments in the curve. This method returns a Shape object representing the Bezier curve.


Vertices are represented by their x and y coordinates as pairs, and all vertices are provided as a 2D list. For example:


pts=[[0,0],[72,72],[100,40],[20,50],[90,120],[60,30],[150,90]]


Use the COMTypes package for drawing:

from comtypes.client import CreateObject

app2=CreateObject(“Excel.Application”)

app2.Visible=True

bk2=app2.Workbooks.Add()

sht2=bk2.Sheets(1)

pts=[[0,0],[72,72],[100,40],[20,50],[90,120],[60,30],[150,90]]  #顶点

sht2.Shapes.AddCurve(pts)    #Add Bezier curve

Sample Code

#Auto-fill formulas

import xlwings as xw    #Import the xlwings package
import os    #Import the os package

root = os.getcwd()    #Get the current path
#Create an Excel application window, visible, 
#without opening a workbook  
app=xw.App(visible=True, add_book=False)
#Open a data file, writable
bk=app.books.open(fullname=root+r'\AutoFill.xlsx',read_only=False)
sht=bk.api.Sheets(1)    #Get the worksheet

#Auto-fill formulas
sht.Range('C1').Formula='=$A1+$B1'
sht.Range('C1:C5').FillDown()

#bk.save()
#bk.close()
#app.kill()
Create Curves Using xlwings

How To Create Polylines and Polygons Using xlwings?

Method

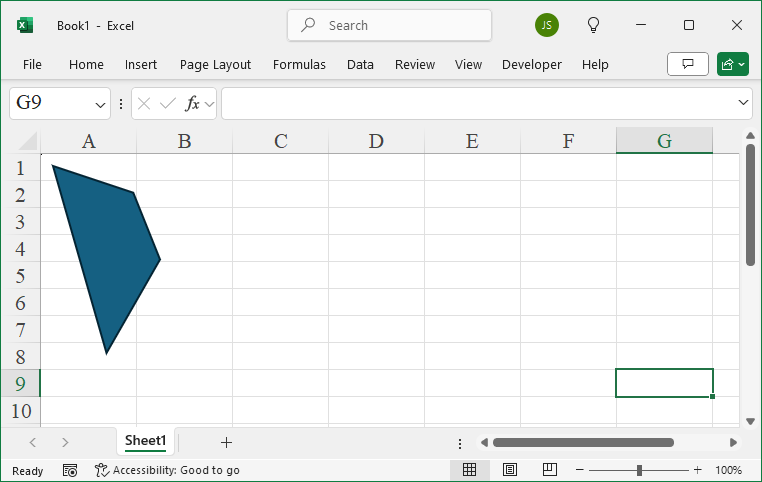
To draw polylines, polygons, and curves with xlwings, there are some issues. Use another Python package called `comtypes`, which is based on COM, similar to xlwings.


First, install the `comtypes` library using the `pip` command in the DOS command window:


pip install comtypes


Then, enter the following in the Python IDLE window:

 #Import the CreateObject function from comtypes

from comtypes.client import CreateObject

app2=CreateObject(“Excel.Application”)    #Create Excel application

app2.Visible=True  #Make the application window visible

bk2=app2.Workbooks.Add()    #Add a workbook

sht2=bk2.Sheets(1)  #Get the first sheet

pts=[[10,10], [50,150],[90,80], [70,30], [10,10]]    #Polygon vertices

sht2.Shapes.AddPolyline(pts)    #Add polygon region

Sample Code

#Set to manual calculation

from xlwings import constants as con
import xlwings as xw    #Import the xlwings package
import os    #Import the os package

root = os.getcwd()    #Get the current path
#Create an Excel application window, visible, 
#without opening a workbook  
app=xw.App(visible=True, add_book=False)
#Open a data file, writable
bk=app.books.open(fullname=root+r'\Formula2.xlsx',read_only=False)
sht=bk.api.Sheets(1)    #Get the worksheet

#Set to manual calculation
app.api.Calculation=con.Calculation.xlCalculationManual

#bk.save()
#bk.close()
#app.kill()
Create Polylines and Polygons Using xlwings

How To Create Rectangles, Rounded Rectangles, Ellipses, and Circles Using xlwings?

Method

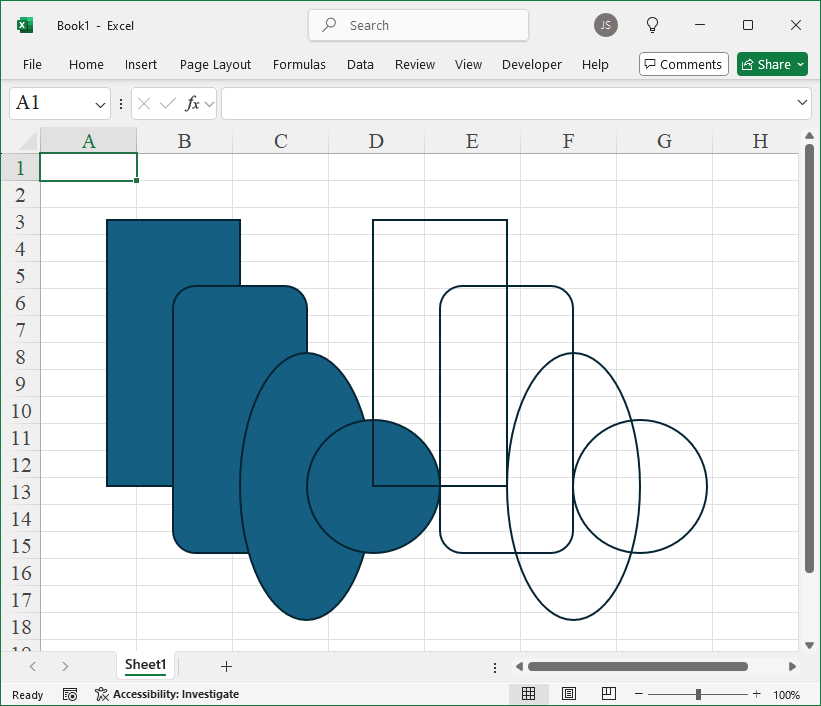
Use the `AddShape` method of the Shapes object to create rectangles, rounded rectangles, ellipses, and circles.


Name

Value

Description

msoShapeRectangle

1

Rectangle

msoShapeRoundedRectangle

5

Rounded Rectangle

msoShapeOval

9

Ellipse


sht.api.Shapes.AddShape(1, 50, 50, 100, 200)    #Draw a rectangle face

sht.api.Shapes.AddShape(5, 100, 100, 100, 200)    #Draw a rounded rectangle face

sht.api.Shapes.AddShape(9, 150, 150, 100, 200)    #Draw an ellipse face

sht.api.Shapes.AddShape(9, 200, 200, 100, 100)    #Draw a circle face


shp1=sht.api.Shapes.AddShape(1, 250, 50, 100, 200)    #Draw a rectangle

shp2=sht.api.Shapes.AddShape(5, 300, 100, 100, 200)    #Draw a rounded rectangle

shp3=sht.api.Shapes.AddShape(9, 350, 150, 100, 200)    #Draw an ellipse

shp4=sht.api.Shapes.AddShape(9, 400, 200, 100, 100)    #Draw a circle

shp1.Fill.Visible=False

shp2.Fill.Visible=False

shp3.Fill.Visible=False

shp4.Fill.Visible=False

Sample Code

#Copy and paste formulas

import xlwings as xw    #Import the xlwings package
from xlwings import constants as con
import os    #Import the os package

root = os.getcwd()    #Get the current path
#Create an Excel application window, visible, 
#without opening a workbook  
app=xw.App(visible=True, add_book=False)
#Open a data file, writable
bk=app.books.open(fullname=root+r'\Formula2.xlsx',read_only=False)
sht=bk.api.Sheets(1)    #Get the worksheet

#Copy and paste formulas
sht.Range('B3:E5').Copy()
sht.Range('D7:G9').PasteSpecial(Paste=con.PasteType.xlPasteFormulas)

#bk.save()
#bk.close()
#app.kill()
Create Rectangles, Rounded Rectangles, Ellipses, and Circles Using xlwings