Blog
How To Create Chart Using xlwings?
Method
Use the `AddChart2` method of the `Shapes` object to create a chart. The syntax is:
sht.api.Shapes.AddChart2(Style, XlChartType, Left, Top, Width, Height, NewLayout)
Where `sht` is the current worksheet. There are 7 parameters, all optional.
- Style:Chart style, -1 represents the default style for the chart type
- xlChartType:Chart type, using values from the `XlChartType` enumeration, a part of which is listed below
- Left:Left position of the chart, centered horizontally if omitted
- Top:Top position of the chart, centered vertically if omitted
- Width:Width of the chart, default is 354 if omitted
- Height:Height of the chart, default is 210 if omitted
- NewLayout:Determines the chart layout. If `True`, legends are shown only for composite charts
|
Name |
Value |
Description |
|
xlArea |
1 |
Area chart |
|
xlLine |
4 |
Line chart |
|
xlPie |
5 |
Pie chart |
|
xlBarClustered |
57 |
Clustered bar chart |
|
xlBarStacked |
58 |
Stacked bar chart |
|
xlXYScatter |
-4169 |
XY scatter chart |
|
xlBubble |
个 |
Bubble chart |
|
xlSurface |
83 |
3D Surface chart |
|
…… |
sht.api.Range(‘A1’).CurrentRegion.Select()
sht.api.Shapes.AddChart2(-1,xw.constants.ChartType.xlColumnClustered,30,150,300,200,True)
Sample Code
#Drawing charts

import xlwings as xw
import os

root = os.getcwd()
app = xw.App(visible=True, add_book=False)
wb=app.books.open(root+r'/GDP.xlsx',read_only=False)
sht=wb.sheets(1)

sht.api.Range('B1:H7').Select()
sht.api.Shapes.AddChart2(-1,xw.constants.ChartType.xlColumnClustered,30,150,300,200,True)

#bk.save()
#bk.close()
#app.kill()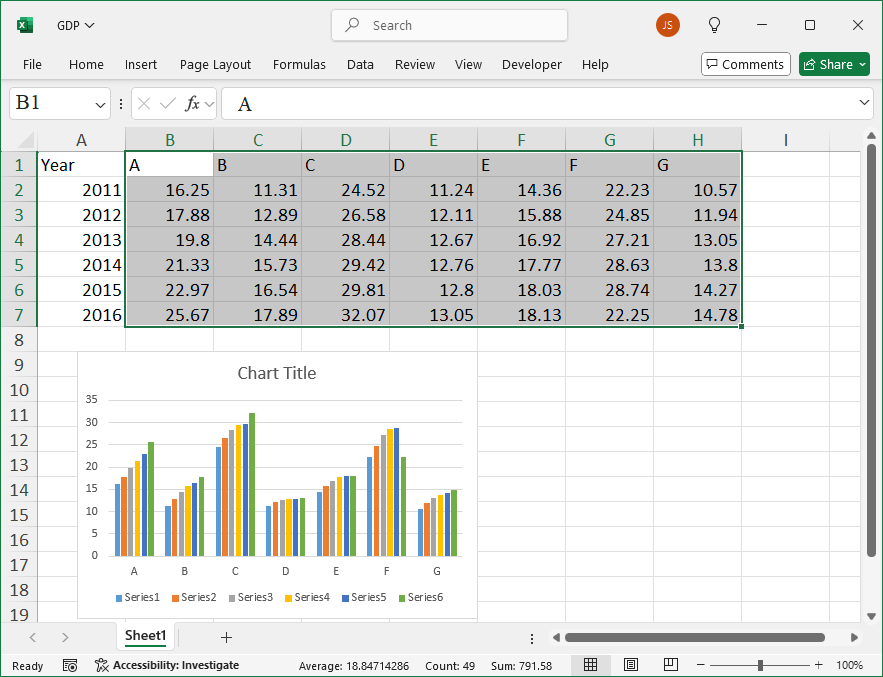
How To Create AutoShapes Using xlwings?
Method
AutoShapes are predefined shapes in Excel. Use the `AddShape` method of the `Shapes` object to create AutoShapes.
|
Name |
Value |
Description |
|
msoShapeOval |
9 |
Oval |
|
msoShapeOvalCallout |
107 |
Oval callout |
|
msoShapeParallelogram |
12 |
Slanted parallelogram |
|
msoShapePie |
142 |
Pie (sector) missing parts |
|
msoShapeQuadArrow |
39 |
Arrows pointing up, down, left, right |
|
msoShapeQuadArrowCallout |
59 |
Callout with directional arrows |
|
msoShapeRectangle |
1 |
Rectangle |
|
msoShapeRectangularCallout |
105 |
Rectangular callout |
|
msoShapeRightArrow |
33 |
Right arrow |
|
msoShapeRightArrowCallout |
53 |
Callout with right arrow |
|
msoShapeRightBrace |
32 |
Right brace |
|
msoShapeRightBracket |
30 |
Right bracket |
|
msoShapeRightTriangle |
utf-8 |
Right-angle triangle |
|
msoShapeRound1Rectangle |
151 |
Rectangle with one rounded corner |
|
msoShapeRound2DiagRectangle |
157 |
Rectangle with two rounded corners diagonally opposite |
|
msoShapeRound2SameRectangle |
152 |
Rectangle with two rounded corners on the same side |
|
msoShapeRoundedRectangle |
5 |
Rounded rectangle |
|
msoShapeRoundedRectangularCallout |
106 |
Rounded rectangular callout |
|
…… |
|
|
sht.api.Shapes.AddShape(1, 50, 50, 100, 200)
sht.api.Shapes.AddShape(12, 250, 50, 100, 100)
sht.api.Shapes.AddShape(17, 450, 50, 100, 100)
Sample Code
#Drawing shapes

import xlwings as xw    #Import xlwings package

app=xw.App()
bk=app.books.active   #Get the active workbook
sht=bk.sheets.active    #Get the active worksheet

sht.api.Shapes.AddShape(1, 50, 50, 100, 200)
sht.api.Shapes.AddShape(12, 250, 50, 100, 100)
sht.api.Shapes.AddShape(17, 450, 50, 100, 100)

#bk.save()
#bk.close()
#app.kill()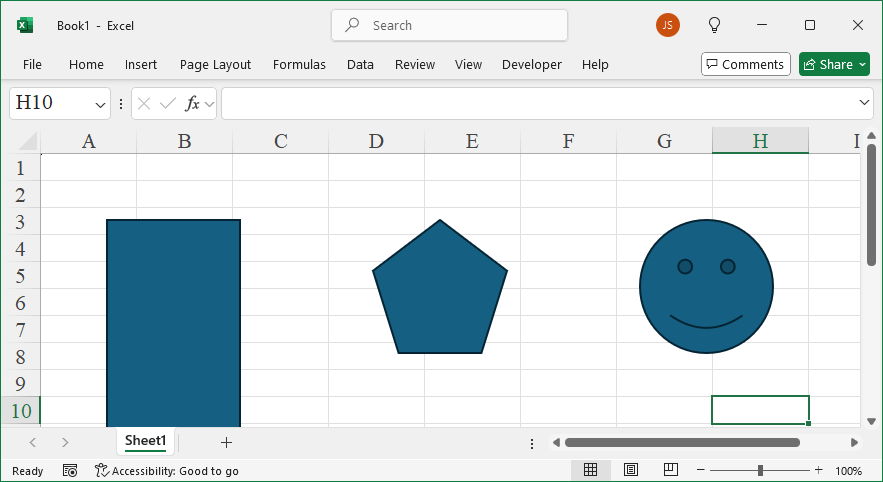
How To Create Callout 2 Using xlwings?
Method
shp=sht.api.Shapes.AddCallout(2, 110, 40, 200, 60)
shp.TextFrame2.TextRange.Characters.Text=’Test Box’
shp.Callout.Accent=True
shp.Callout.Border=True
shp.Callout.Angle=2
Sample Code
#Assign a formula as a name

import xlwings as xw    #Import the xlwings package
import os    #Import the os package

root = os.getcwd()    #Get the current path
#Create an Excel application window, visible,
#without opening a workbook
app=xw.App()
bk=app.books.active
sht=bk.api.Sheets(1)    #Get the worksheet

#Assign a formula as a name
sht.Range('A1:C3').Value=10
sht.Names.Add(Name='SM',RefersTo='=SUM($A$1:$C$3)')
sht.Range('D4').Formula='=SM+3'

#bk.save()
#bk.close()
#app.kill()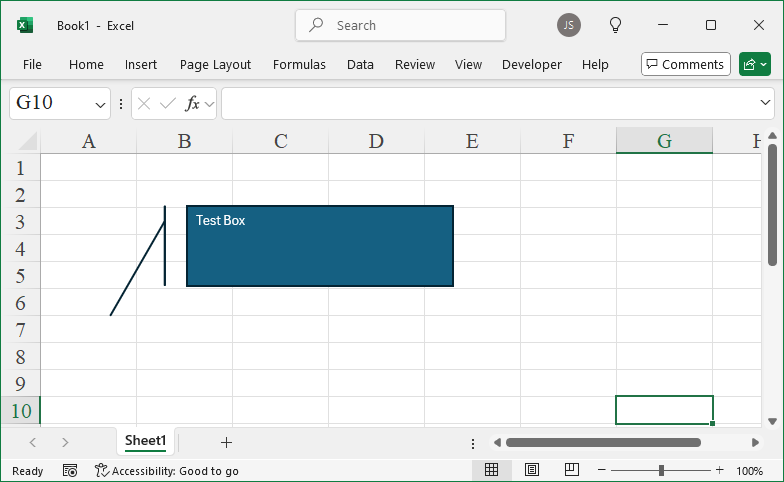
How To Create Callout Using xlwings?
Method
Use the `AddCallout` method of the `Shapes` object to add a callout. The syntax is:
sht.api.Shapes.AddCallout(Type,Left,Top,Width,Height)
Where `sht` represents a worksheet object. The parameters are explained in the table below. This method returns a `Shape` object representing the callout.
The `Type` parameter values are from the `MsoCalloutType` enumeration, which specifies the type of the callout line.
|
Name |
Value |
Description |
|
msoCalloutFour |
4 |
A callout line composed of two segments, attached to the right of the text box |
|
msoCalloutMixed |
-2 |
A mixed combination of states |
|
msoCalloutOne |
1 |
A single-segment horizontal callout line |
|
msoCalloutThree |
3 |
A callout line composed of two segments, attached to the left of the text box |
|
msoCalloutTwo |
2 |
A single-segment angled callout line |
shp=sht.api.Shapes.AddCallout(2, 10, 10, 100, 50)
shp.TextFrame2.TextRange.Characters.Text=’Test Box’
Sample Code
#Assign a formula as a name

import xlwings as xw    #Import the xlwings package
import os    #Import the os package

root = os.getcwd()    #Get the current path
#Create an Excel application window, visible,
#without opening a workbook
app=xw.App()
bk=app.books.active
sht=bk.api.Sheets(1)    #Get the worksheet

#Assign a formula as a name
sht.Range('A1:C3').Value=10
sht.Names.Add(Name='SM',RefersTo='=SUM($A$1:$C$3)')
sht.Range('D4').Formula='=SM+3'

#bk.save()
#bk.close()
#app.kill()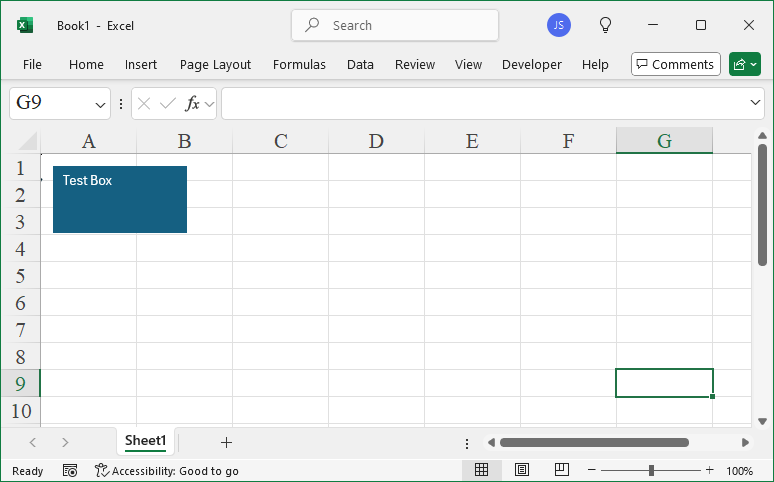
How To Create Text Box Using xlwings?
Method
Use the `AddTextbox` method of the `Shapes` object to create a text box. The calling format and parameters are similar to the `AddLabel` method.
shp=sht.api.Shapes.AddTextbox(1,10,10,100,50)
shp.TextFrame2.TextRange.Characters.Text=’Test Box’
Sample Code
#Create formulas using defined names

import xlwings as xw    #Import the xlwings package
import os    #Import the os package

root = os.getcwd()    #Get the current path
#Create an Excel application window, visible,
#without opening a workbook
app=xw.App()
bk=app.books.active
sht=bk.api.Sheets(1)    #Get the worksheet

#Create formulas using defined names
sht.Range('C3').Value=10
sht.Names.Add(Name='NMT',RefersTo=sht.Range('C3').Value)
sht.Range('A1').Formula='=NMT+3'

#bk.save()
#bk.close()
#app.kill()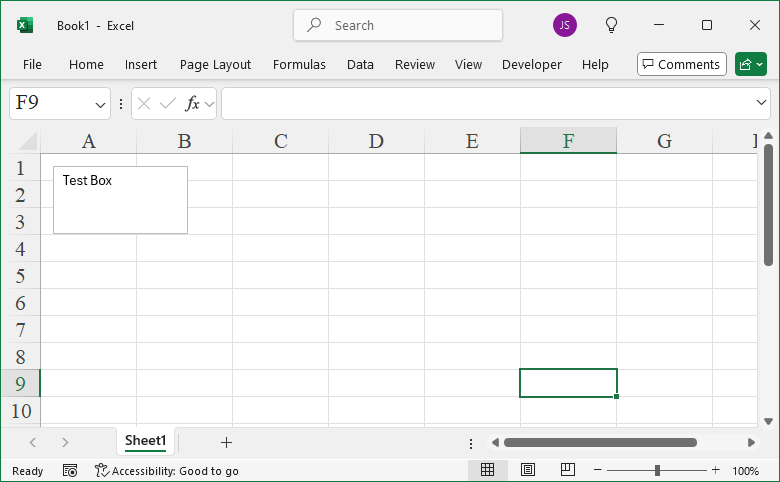
How To Create Labels Using xlwings?
Method
Use the `AddLabel` method of the `Shapes` object to create a label. The syntax is:
sht.api.Shapes.AddLabel(Orientation,Left,Top,Width,Height)
Where `sht` represents a worksheet object. This method returns a `Shape` object that represents the label.
|
Name |
Value |
Description |
|
msoTextOrientationDownward |
3 |
Downward |
|
msoTextOrientationHorizontal |
1 |
Horizontal |
|
msoTextOrientationHorizontalRotatedFarEast |
6 |
Horizontal and rotated for East Asian languages support |
|
msoTextOrientationMixed |
-2 |
Not supported |
|
msoTextOrientationUpward |
2 |
Upward |
|
msoTextOrientationVertical |
5 |
Vertical |
|
msoTextOrientationVerticalFarEast |
4 |
Vertical for East Asian languages support |
shp=sht.api.Shapes.AddLabel(1,100,20,60,150) #Add labels
shp.TextFrame2.TextRange.Characters.Text =’Test Python Label’ #Label text
Sample Code
#Hide formulas

import xlwings as xw    #Import the xlwings package
import os    #Import the os package

root = os.getcwd()    #Get the current path
#Create an Excel application window, visible,
#without opening a workbook
app=xw.App()
bk=app.books.active
sht=bk.api.Sheets(1)    #Get the worksheet

#Hide formulas
sht.Range('C1').Value=10
sht.Range('A1').Formula='=C1+2'
sht.Range('B1').Formula='=C1+5'
rng=sht.Range('A1:B1')
rng.FormulaHidden=True
sht.Protect()

#bk.save()
#bk.close()
#app.kill()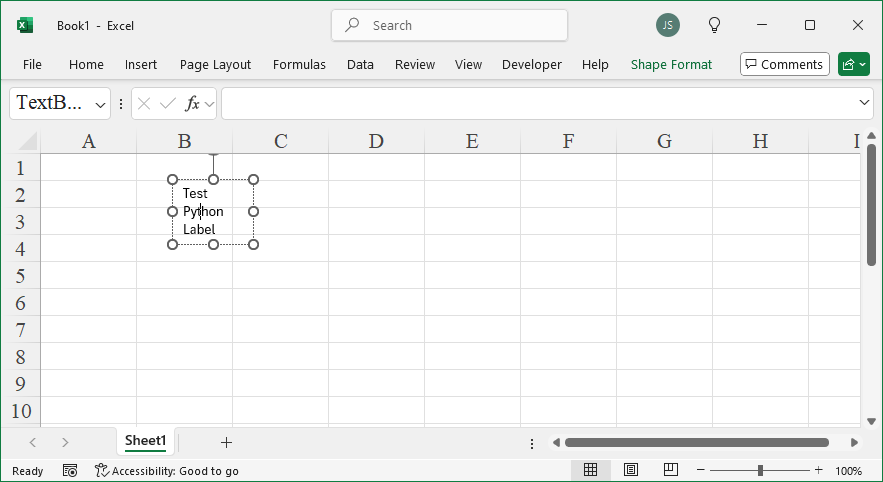
How To Create Curves Using xlwings?
Method
Use the `AddCurve` method of the Shapes object to create a curve. The method syntax is:
sht.api.Shapes.AddCurve(SafeArrayOfPoints)
Where `sht` refers to a worksheet object. The parameter `SafeArrayOfPoints` specifies the coordinates of the Bezier curve’s vertices and control points. The number of points should always be 3n + 1, where n is the number of line segments in the curve. This method returns a Shape object representing the Bezier curve.
Vertices are represented by their x and y coordinates as pairs, and all vertices are provided as a 2D list. For example:
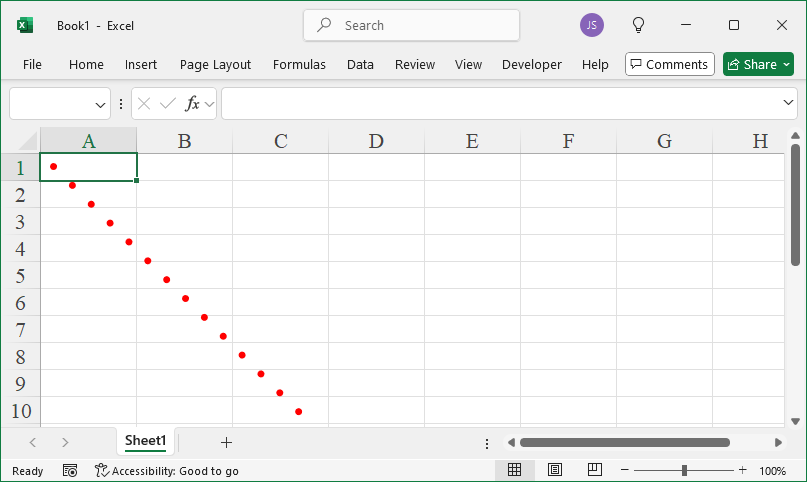
pts=[[0,0],[72,72],[100,40],[20,50],[90,120],[60,30],[150,90]]
Use the COMTypes package for drawing:
from comtypes.client import CreateObject
app2=CreateObject(“Excel.Application”)
app2.Visible=True
bk2=app2.Workbooks.Add()
sht2=bk2.Sheets(1)
pts=[[0,0],[72,72],[100,40],[20,50],[90,120],[60,30],[150,90]] #顶点
sht2.Shapes.AddCurve(pts) #Add Bezier curve
Sample Code
#Auto-fill formulas

import xlwings as xw    #Import the xlwings package
import os    #Import the os package

root = os.getcwd()    #Get the current path
#Create an Excel application window, visible,
#without opening a workbook
app=xw.App(visible=True, add_book=False)
#Open a data file, writable
bk=app.books.open(fullname=root+r'\AutoFill.xlsx',read_only=False)
sht=bk.api.Sheets(1)    #Get the worksheet

#Auto-fill formulas
sht.Range('C1').Formula='=$A1+$B1'
sht.Range('C1:C5').FillDown()

#bk.save()
#bk.close()
#app.kill()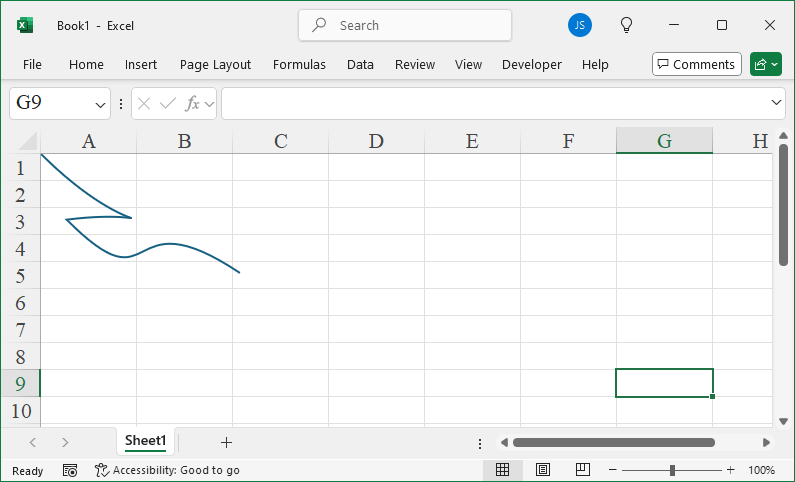
How To Create Polylines and Polygons Using xlwings?
Method
To draw polylines, polygons, and curves with xlwings, there are some issues. Use another Python package called `comtypes`, which is based on COM, similar to xlwings.
First, install the `comtypes` library using the `pip` command in the DOS command window:
pip install comtypes
Then, enter the following in the Python IDLE window:
#Import the CreateObject function from comtypes
from comtypes.client import CreateObject
app2=CreateObject(“Excel.Application”) #Create Excel application
app2.Visible=True #Make the application window visible
bk2=app2.Workbooks.Add() #Add a workbook
sht2=bk2.Sheets(1) #Get the first sheet
pts=[[10,10], [50,150],[90,80], [70,30], [10,10]] #Polygon vertices
sht2.Shapes.AddPolyline(pts) #Add polygon region
Sample Code
#Set to manual calculation

from xlwings import constants as con
import xlwings as xw    #Import the xlwings package
import os    #Import the os package

root = os.getcwd()    #Get the current path
#Create an Excel application window, visible,
#without opening a workbook
app=xw.App(visible=True, add_book=False)
#Open a data file, writable
bk=app.books.open(fullname=root+r'\Formula2.xlsx',read_only=False)
sht=bk.api.Sheets(1)    #Get the worksheet

#Set to manual calculation
app.api.Calculation=con.Calculation.xlCalculationManual

#bk.save()
#bk.close()
#app.kill()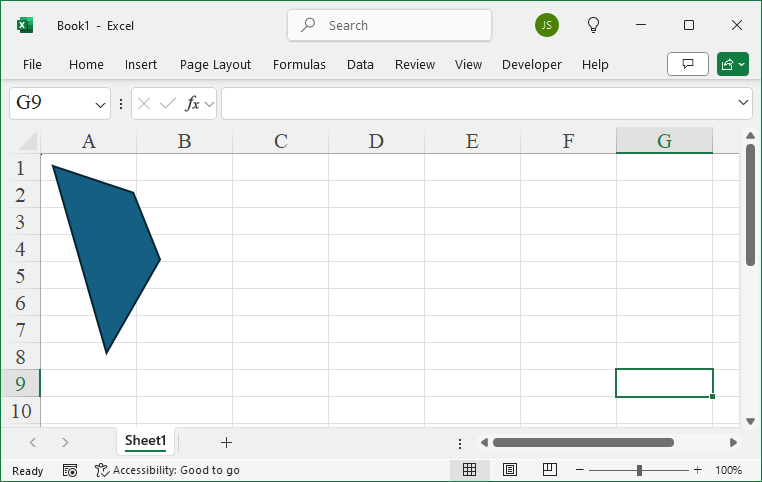
How To Create Rectangles, Rounded Rectangles, Ellipses, and Circles Using xlwings?
Method
Use the `AddShape` method of the Shapes object to create rectangles, rounded rectangles, ellipses, and circles.
|
Name |
Value |
Description |
|
msoShapeRectangle |
1 |
Rectangle |
|
msoShapeRoundedRectangle |
5 |
Rounded Rectangle |
|
msoShapeOval |
9 |
Ellipse |
sht.api.Shapes.AddShape(1, 50, 50, 100, 200) #Draw a rectangle face
sht.api.Shapes.AddShape(5, 100, 100, 100, 200) #Draw a rounded rectangle face
sht.api.Shapes.AddShape(9, 150, 150, 100, 200) #Draw an ellipse face
sht.api.Shapes.AddShape(9, 200, 200, 100, 100) #Draw a circle face
shp1=sht.api.Shapes.AddShape(1, 250, 50, 100, 200) #Draw a rectangle
shp2=sht.api.Shapes.AddShape(5, 300, 100, 100, 200) #Draw a rounded rectangle
shp3=sht.api.Shapes.AddShape(9, 350, 150, 100, 200) #Draw an ellipse
shp4=sht.api.Shapes.AddShape(9, 400, 200, 100, 100) #Draw a circle
shp1.Fill.Visible=False
shp2.Fill.Visible=False
shp3.Fill.Visible=False
shp4.Fill.Visible=False
Sample Code
#Copy and paste formulas

import xlwings as xw    #Import the xlwings package
from xlwings import constants as con
import os    #Import the os package

root = os.getcwd()    #Get the current path
#Create an Excel application window, visible,
#without opening a workbook
app=xw.App(visible=True, add_book=False)
#Open a data file, writable
bk=app.books.open(fullname=root+r'\Formula2.xlsx',read_only=False)
sht=bk.api.Sheets(1)    #Get the worksheet

#Copy and paste formulas
sht.Range('B3:E5').Copy()
sht.Range('D7:G9').PasteSpecial(Paste=con.PasteType.xlPasteFormulas)

#bk.save()
#bk.close()
#app.kill()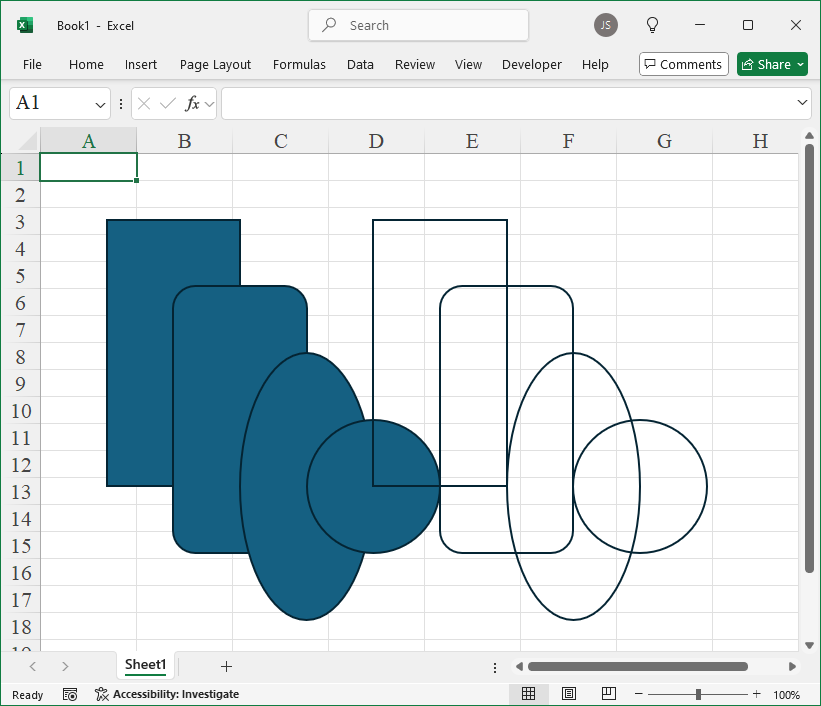
How To Create Line Segments Using xlwings?
Method
Use the `AddLine` method of the Shapes object to create a line segment. The method syntax is:
sht.api.Shapes.AddLine(BeginX, BeginY, EndX, EndY)
Where `sht` refers to a worksheet object. The parameters `BeginX, BeginY` represent the coordinates of the starting point, and `EndX, EndY` represent the coordinates of the endpoint. This method returns a Shape object representing the line segment.
shp=sht.api.Shapes.AddLine(10,10,250,250) #Create a line segment `Shape` object
ln=shp.Line #Get the line shape object
#Set properties of the line shape object: line style, color, and width
ln.DashStyle=3
ln.ForeColor.RGB=xw.utils.rgb_to_int((255, 0, 0))
ln.Weight=5
Sample Code
#Check if a specified cell range contains a formula

import xlwings as xw    #Import the xlwings package
import os    #Import the os package

root = os.getcwd()    #Get the current path
#Create an Excel application window, visible,
#without opening a workbook
app=xw.App(visible=True, add_book=False)
#Open a data file, writable
bk=app.books.open(fullname=root+r'\Formula2.xlsx',read_only=False)
sht=bk.api.Sheets(1)    #Get the worksheet

#Check if a specified cell range contains a formula
rng=sht.Range('B3:E5')
for cell in rng:
    if cell.HasFormula==True:
        print(cell.Row,cell.Column,'Yes')

#bk.save()
#bk.close()
#app.kill()