Blog
How to use Application.CanRecordSounds in the xlwings API way
The CanRecordSounds property of the Application object in Excel’s object model is a read-only Boolean property that indicates whether the current version and installation of Excel supports the recording of sounds. In practical terms, this property checks if the system has the necessary audio hardware and drivers, and if the Excel application itself is capable of utilizing this feature for operations such as adding sound notes to cells. This can be particularly useful for developers creating macros or applications that need to conditionally include audio functionalities, ensuring compatibility and preventing errors on systems without sound recording capabilities.
In xlwings, the Application object is accessed through the app property of a Book object or directly when creating an application instance. The CanRecordSounds property is exposed as a property of the Application object in xlwings, allowing you to query its value in Python. The syntax for accessing this property is straightforward, as it does not require any parameters. It returns True if sound recording is supported, and False otherwise. This property is rarely used in modern Excel development, as sound note features have been largely deprecated or replaced by other commenting systems, but it remains available for legacy support and specific use cases.
The xlwings API call format for CanRecordSounds is as follows:
app.can_record_soundsHere, app refers to an instance of the xlwings App class, which corresponds to the Excel Application object. The property is accessed as an attribute, and it returns a Boolean value. There are no parameters to specify, making it simple to integrate into conditional checks within your scripts.
For example, you might use CanRecordSounds to determine whether to enable certain UI elements or to log system capabilities for debugging purposes. Below are two code examples demonstrating its usage with xlwings:
Example 1: Checking sound recording support in an existing Excel instance.
import xlwings as xw

# Connect to the currently active Excel instance
app = xw.apps.active

# Check if sound recording is supported
if app.can_record_sounds:
    print("Sound recording is supported in this Excel installation.")
else:
    print("Sound recording is not supported.")
Example 2: Creating a new Excel instance and verifying capabilities.
import xlwings as xw

# Start a new Excel application
app = xw.App(visible=True)

# Access the CanRecordSounds property
support_status = app.can_record_sounds
print(f"CanRecordSounds property value: {support_status}")

# Perform actions based on the result
if support_status:
    # Code to add sound-related features could go here
    pass
else:
    # Fallback or warning message
    print("Audio features will be disabled due to lack of support.")

# Close the application
app.quit()How To Use a Colormap Using xlwings?
【Method】

| Name | Description | Color Bar |
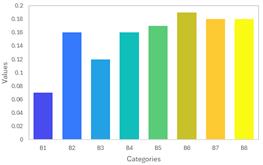
| parula | Gradient between blue, cyan, orange, and yellow | |
| turbo | Gradient between blue and red | |
| hsv | Hue component variation in the HSV color model | |
| hot | Gradient between black, red, orange, yellow, and white | |
| cool | Gradient between cyan and magenta | |
| spring | Gradient between magenta and yellow | |
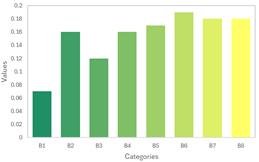
| summer | Gradient between green and yellow | |
| autumn | Gradient from red to orange-yellow, yellow | |
| winter | Gradient between blue and green | |
| gray | Linear grayscale color lookup table | |
| bone | Gray color lookup table with a higher blue component | |
| copper | Gradient between black and bright copper | |
| pink | Gradient between magenta and white | |
| sky | Gradient between white and sky blue | |
| abyss | Gradient between deep blue and sky blue | |
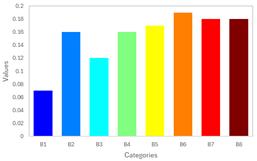
| jet | Gradient between blue, cyan, yellow, orange-red, and red |

【Example】
import xlwings as xw
import os

def set_style(cht):
    cht.ChartArea.Format.Line.Visible=False
    cht.PlotArea.Format.Fill.Visible=False
    cht.PlotArea.Format.Line.Visible=True
    cht.PlotArea.Format.Line.ForeColor.RGB=xw.utils.rgb_to_int((200,200,200))
    #cht.PlotArea.Format.Line.ForeColor.ObjectThemeColor = msoThemeColorText1
    ax1=cht.Axes(1)
    ax2=cht.Axes(2)
    ax1.HasTitle=True
    ax1.AxisTitle.Text='Categories'
    ax1.AxisTitle.Font.Size=10
    ax1.TickLabels.Font.Size=8
    #ax1.TickLabels.NumberFormat='0.00'
    ax1.HasMajorGridlines=False
    ax2.HasTitle=True
    ax2.AxisTitle.Text='Values'
    ax2.AxisTitle.Font.Size=10
    ax2.TickLabels.Font.Size=8
    ax2.HasMajorGridlines=False
    cht.HasTitle=True
    #cht.ChartTitle.Caption='Plot'
    #cht.ChartTitle.Font.Size=12

root=os.getcwd()
app=xw.App(visible=True,add_book=False)
wb=app.books.open(root+r'/data.xlsx',read_only=False)
sht=wb.sheets('Sheet1')

sht.api.Range('A2:B9').Select()
shp=sht.api.Shapes.AddChart2(-1,xw.constants.ChartType.xlColumnClustered,20,20,350,250,True)
cht=shp.Chart
cht.ChartGroups(1).GapWidth=50

cm=wb.sheets('parula').range('A1:C256').value

for i in range(8):
    count=int((i+1)/8*256)
    if count==256:
      r=int(cm[255][0])
      g=int(cm[255][1])
      b=int(cm[255][2])
    else:
      r=int(cm[count][0])
      g=int(cm[count][1])
      b=int(cm[count][2])

    cht.SeriesCollection(1).Points(i+1).Format.Fill. \
    ForeColor.RGB=xw.utils.rgb_to_int((r,g,b))

set_style(cht)

#wb.save()
#app.kill()
How to use Application.CanPlaySounds in the xlwings API way
The Application.CanPlaySounds property in Excel’s object model is a read-only Boolean property that indicates whether the current system environment supports playing sounds through Excel. This can be useful for developers to check sound capabilities before attempting to play sounds programmatically, such as via the Speak method or other sound-related features, ensuring compatibility and avoiding errors on systems without sound support. In xlwings, this property is accessed through the Application object, allowing Python scripts to query this setting.
Syntax in xlwings:
In xlwings, the Application.CanPlaySounds property is accessed using the following format:
app = xw.App() # or use xw.apps.active for an existing instance
can_play_sounds = app.api.CanPlaySounds
Here, app represents the xlwings App object connected to an Excel instance, and .api is used to access the underlying Excel object model. The property returns a Boolean value: True if the system can play sounds, and False otherwise. No parameters are required, as it is a simple property check.
Example Usage:
Below is a practical xlwings code example that demonstrates how to use Application.CanPlaySounds to conditionally play a sound or display a message based on system capability. This helps in creating robust applications that adapt to different user environments.
import xlwings as xw

def check_sound_capability():
# Connect to the active Excel instance or start a new one
app = xw.apps.active if xw.apps.count > 0 else xw.App()

# Access the CanPlaySounds property via the Excel object model
can_play = app.api.CanPlaySounds

if can_play:
    print("System supports sound playback. Playing a test sound...")
    # Example: Use Excel's Speak method to play a sound (requires sound support)
    app.api.Speak("Sound is available", True) # True for asynchronous speech
else:
    print("System does not support sound playback. Consider alternative notifications.")
    # Fallback action, like showing a message box
    app.api.Alert("Sound not supported on this system.", Type:=0) # Simple alert

# Clean up if a new app was created
if not xw.apps.count > 0:
    app.quit()

# Run the function
check_sound_capability()How To Color a Group of Objects Using xlwings?
【Example】

【Code】
import xlwings as xw
import os

def set_style(cht):
    cht.ChartArea.Format.Line.Visible=False
    cht.PlotArea.Format.Fill.Visible=False
    cht.PlotArea.Format.Line.Visible=True
    cht.PlotArea.Format.Line.ForeColor.RGB=xw.utils.rgb_to_int((200,200,200))
    #cht.PlotArea.Format.Line.ForeColor.ObjectThemeColor = msoThemeColorText1
    ax1=cht.Axes(1)
    ax2=cht.Axes(2)
    ax1.HasTitle=True
    ax1.AxisTitle.Text='Categories'
    ax1.AxisTitle.Font.Size=10
    ax1.TickLabels.Font.Size=8
    #ax1.TickLabels.NumberFormat='0.00'
    ax1.HasMajorGridlines=False
    ax2.HasTitle=True
    ax2.AxisTitle.Text='Values'
    ax2.AxisTitle.Font.Size=10
    ax2.TickLabels.Font.Size=8
    ax2.HasMajorGridlines=False
    cht.HasTitle=True
    #cht.ChartTitle.Caption='Plot'
    #cht.ChartTitle.Font.Size=12

root=os.getcwd()
app=xw.App(visible=True,add_book=False)
wb=app.books.open(root+r'/data.xlsx',read_only=False)
sht=wb.sheets('Sheet1')

sht.api.Range('A1:B4').Select()
shp=sht.api.Shapes.AddChart2(-1,xw.constants.ChartType.xlColumnClustered,20,20,350,250,True)
cht=shp.Chart

cht.ChartGroups(1).GapWidth=100

colors=[[51,51,0],
        [102,102,0],
        [153,153,0],
        [204,204,0]]
for i in range(4):
    cht.SeriesCollection(1).Points(i+1).Format.Fill.ForeColor.RGB \
    = xw.utils.rgb_to_int((colors[i][0],colors[i][1],colors[i][2]))

set_style(cht)

#wb.save()
#app.kill()
How to use Application.Caller in the xlwings API way
The Application.Caller property in Excel’s object model is a powerful tool for identifying the cell or range that initiated a specific action, such as a macro or a user-defined function (UDF). In xlwings, this property is accessed through the api property of the Application object, allowing Python scripts to interact with Excel in a manner similar to VBA. This functionality is particularly useful for creating dynamic and responsive Excel applications where the script’s behavior depends on the location from which it was called.
Functionality:
Application.Caller returns a Range object representing the cell that called the macro or function. This is essential for UDFs where the function needs to know its own location in the worksheet to perform context-specific calculations or to retrieve adjacent cell values. It can also be used in event-driven macros to determine the source of a trigger.
Syntax in xlwings:
The property is accessed via:
caller_range = xw.apps[0].api.Caller
# or, if you have a specific app or workbook context:
# caller_range = app.api.Caller
# caller_range = book.app.api.Caller
The returned object is a Range from the Excel object model, which xlwings wraps. You can then use its properties and methods, such as Address, Row, Column, or Value.
Parameters:
Application.Caller does not take any parameters. Its return value depends on the context:
- If called from a worksheet function (UDF), it returns the cell containing the function.
- If called from a shape (like a button) assigned to a macro, it returns the shape name as a string.
- If called from a chart or in an unsupported context, it may return an error or
None.
Example Usage:
- In a User-Defined Function (UDF): A UDF that sums the values of the cell to its left and right, using the caller’s position.
import xlwings as xw

@xw.func
def sum_adjacent():
caller = xw.apps[0].api.Caller
left_cell = caller.Offset(0, -1).Value
right_cell = caller.Offset(0, 1).Value
# Handle None values (empty cells)
left = left_cell if left_cell is not None else 0
right = right_cell if right_cell is not None else 0
return left + right
When this function is entered in cell B2, it will sum the values in A2 and C2.
- In a Macro Triggered by a Button: A script that changes the color of the button’s adjacent cell.
import xlwings as xw

def button_macro():
caller = xw.apps[0].api.Caller
# Assuming caller is a shape name (button), get its top-left cell
# This requires additional logic to map shape to cell, often via TopLeftCell
if isinstance(caller, str): # It's a shape name
    shape = xw.books[0].sheets[0].shapes[caller]
    target_cell = shape.TopLeftCell
    target_cell.color = (255, 0, 0) # Red fill
else: # It's a Range
caller.color = (255, 0, 0)How To Create Contour Plot and Filled Contour Plot Using xlwings?
【Example】
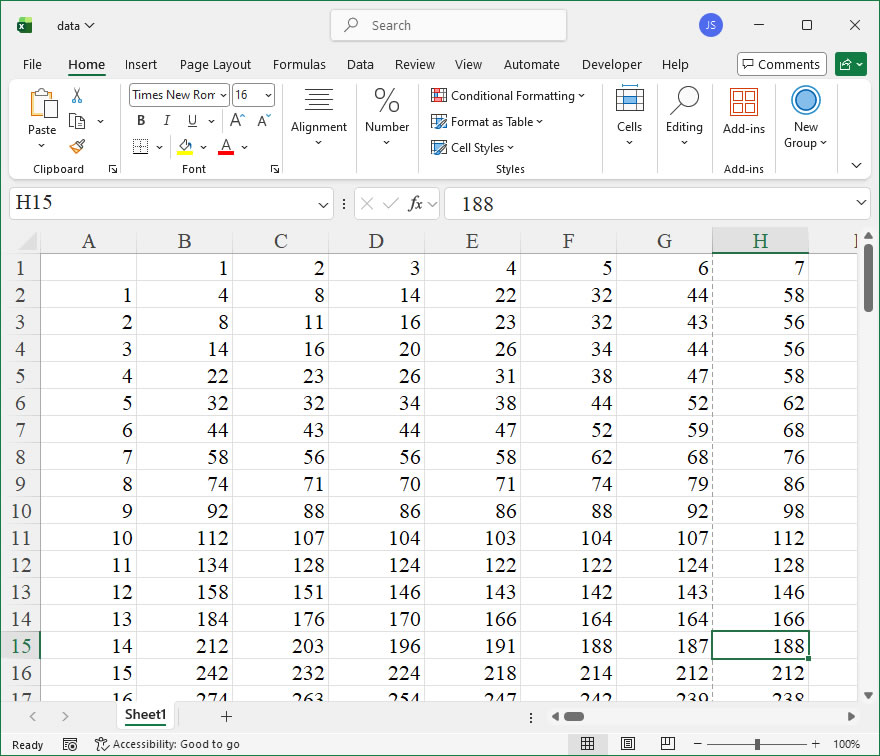
【Code】
import xlwings as xw
import os

def set_style(cht):
    cht.ChartArea.Format.Line.Visible=False
    cht.PlotArea.Format.Fill.Visible = False
    cht.PlotArea.Format.Line.Visible = False
    cht.PlotArea.Format.Line.ForeColor.RGB=xw.utils.rgb_to_int((200,200,200))
    #cht.PlotArea.Format.Line.ForeColor.ObjectThemeColor = msoThemeColorText1
    ax1 = cht.Axes(1)
    ax2 = cht.Axes(2)
    ax1.HasTitle = True
    ax1.AxisTitle.Text = 'Values 1'
    ax1.AxisTitle.Font.Size = 10
    ax1.TickLabels.Font.Size = 8
    #ax1.TickLabels.NumberFormat = '0.00'
    ax1.HasMajorGridlines = True
    ax2.HasTitle = True
    ax2.AxisTitle.Text = 'Values 2'
    ax2.AxisTitle.Font.Size = 10
    ax2.TickLabels.Font.Size = 8
    ax2.HasMajorGridlines = True
    cht.HasTitle = True
    #cht.ChartTitle.Caption = 'Plot'
    #cht.ChartTitle.Font.Size = 12


root=os.getcwd()
app=xw.App(visible=True,add_book=False)
wb=app.books.open(root+r'/data.xlsx',read_only=False)
sht=wb.sheets('Sheet1')

sht.api.Range('A1:CW100').Select()  #
shp=sht.api.Shapes.AddChart2(-1,xw.constants.ChartType.xlSurfaceTopView,20,20,300,300,True)
cht=shp.Chart  #

set_style(cht)

cht.Export(root+'/cht.jpg')
cht.Export(root+'/cht.svg')
cht.ExportAsFixedFormat(0,root+'/cht.pdf')

#wb.save()
#app.kill()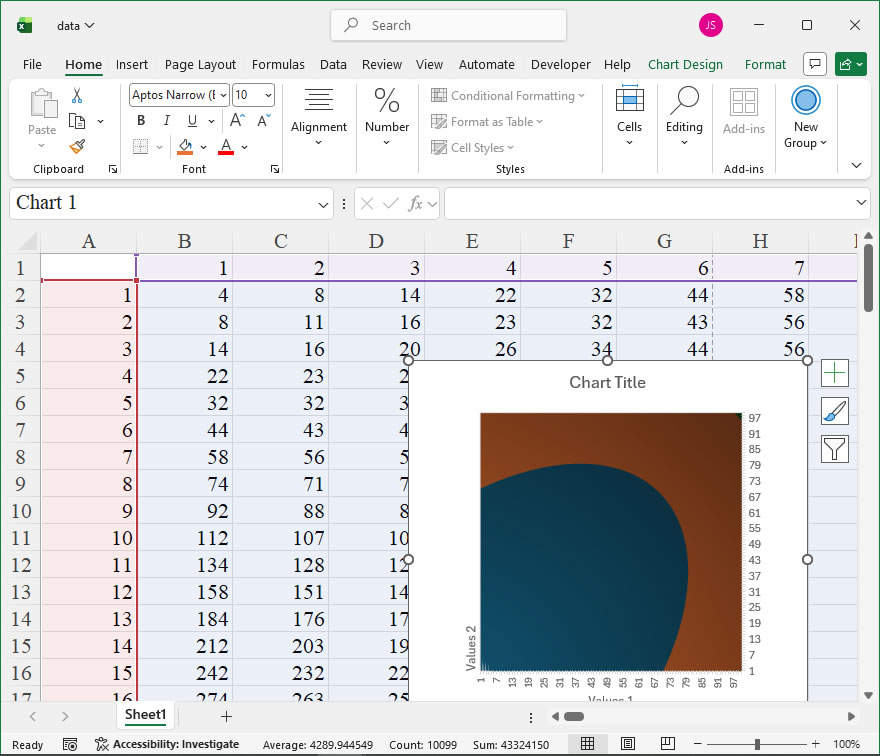
How to use Application.CalculationVersion in the xlwings API way
The Application.CalculationVersion property in Excel is a read-only property that returns a Long value representing the version of the calculation engine used by Excel. This value is primarily used internally by Excel to track changes in calculation logic, such as after updates to functions or calculation methods. It can be useful for advanced troubleshooting, auditing, or when you need to ensure that a workbook’s calculations are consistent with a specific version of Excel’s calculation engine. In xlwings, you can access this property through the Application object.
Syntax in xlwings:
app.calculation_version- app: This is an instance of the xlwings
Appclass, representing the Excel application. You typically obtain it byapp = xw.apps.activeor by creating a new instance. - calculation_version: This property returns an integer (Long) that encodes the calculation version. The value is composed of two parts: the major version (higher 16 bits) and the minor version (lower 16 bits). For example, a value of 196617 might correspond to version 3.9 (where 3 is the major part and 9 is the minor part, but exact mapping depends on Excel’s internal use).
Example Usage:
Here are a few code examples demonstrating how to use calculation_version with xlwings:
- Retrieving the Calculation Version:
This example gets the calculation version from the active Excel application and prints it as a decimal number and as separate major/minor components using bitwise operations.
import xlwings as xw

# Connect to the active Excel application
app = xw.apps.active

# Get the calculation version
version = app.calculation_version
print(f"Calculation Version (decimal): {version}")

# Extract major and minor parts (higher 16 bits and lower 16 bits)
major_version = (version >> 16) & 0xFFFF
minor_version = version & 0xFFFF
print(f"Major Version: {major_version}, Minor Version: {minor_version}")- Comparing Calculation Versions:
You can compare the calculation version to a known value to check for compatibility or changes. For instance, you might want to verify if the version matches a specific release.
import xlwings as xw

app = xw.apps.active
current_version = app.calculation_version
target_version = 196617 # Example target version, adjust based on your needs

if current_version == target_version:
    print("Calculation engine is up-to-date with the target version.")
else:
print(f"Calculation version differs. Current: {current_version}, Target: {target_version}")- Logging Calculation Version for Auditing:
In scenarios where you need to audit workbook calculations, you can log the calculation version along with other details to ensure reproducibility.
import xlwings as xw
import datetime

app = xw.apps.active
version = app.calculation_version
timestamp = datetime.datetime.now().strftime("%Y-%m-%d %H:%M:%S")

# Log to a file or print
log_entry = f"{timestamp} - Calculation Version: {version}\n"
with open("calculation_log.txt", "a") as log_file:
log_file.write(log_entry)
print("Calculation version logged successfully.")
Notes:
- The exact meaning of the version number is not publicly documented by Microsoft and may change with Excel updates. It is generally used for internal tracking, so rely on it cautiously.
- This property is available in Excel 2007 and later versions. In xlwings, ensure you have a compatible Excel installation.
- Since
calculation_versionis read-only, you cannot set it directly; it reflects the current state of Excel’s calculation engine.
How To Set Surface Color, Transparency, and Lighting Using xlwings?
【Example】
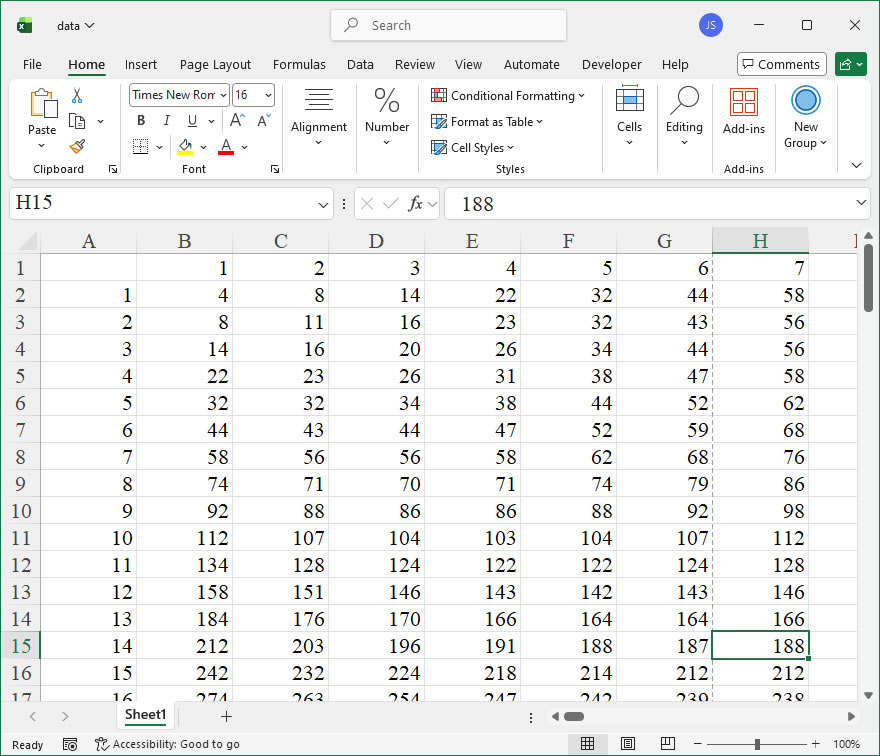
【Code】
import xlwings as xw
import os

def set_style(cht):
    cht.ChartArea.Format.Line.Visible=False
    cht.PlotArea.Format.Fill.Visible = False
    cht.PlotArea.Format.Line.Visible = False
    cht.PlotArea.Format.Line.ForeColor.RGB=xw.utils.rgb_to_int((200,200,200))
    #cht.PlotArea.Format.Line.ForeColor.ObjectThemeColor = msoThemeColorText1
    ax1 = cht.Axes(1)
    ax2 = cht.Axes(2)
    ax1.HasTitle = True
    ax1.AxisTitle.Text = 'Values 1'
    ax1.AxisTitle.Font.Size = 10
    ax1.TickLabels.Font.Size = 8
    #ax1.TickLabels.NumberFormat = '0.00'
    ax1.HasMajorGridlines = True
    ax2.HasTitle = True
    ax2.AxisTitle.Text = 'Values 2'
    ax2.AxisTitle.Font.Size = 10
    ax2.TickLabels.Font.Size = 8
    ax2.HasMajorGridlines = True
    cht.HasTitle = True
    #cht.ChartTitle.Caption = 'Plot'
    #cht.ChartTitle.Font.Size = 12


root=os.getcwd()
app=xw.App(visible=True,add_book=False)
wb=app.books.open(root+r'/data.xlsx',read_only=False)
sht=wb.sheets('Sheet1')

sht.api.Range('A1:CW100').Select()  #
shp=sht.api.Shapes.AddChart2(-1,xw.constants.ChartType.xlSurface,20,20,300,300,True)
cht=shp.Chart  #
n=cht.SeriesCollection().Count
for i in range(n):
    fl=cht.SeriesCollection(i+1).Format.Fill
    fl.Visible=True
    fl.ForeColor.RGB=xw.utils.rgb_to_int((255,128,0))
    fl.ForeColor.Brightness=0.2
    fl.Transparency=0.3

set_style(cht)
cht.HasLegend=False

cht.Export(root+'/cht.jpg')
cht.Export(root+'/cht.svg')
cht.ExportAsFixedFormat(0,root+'/cht.pdf')

#wb.save()
#app.kill()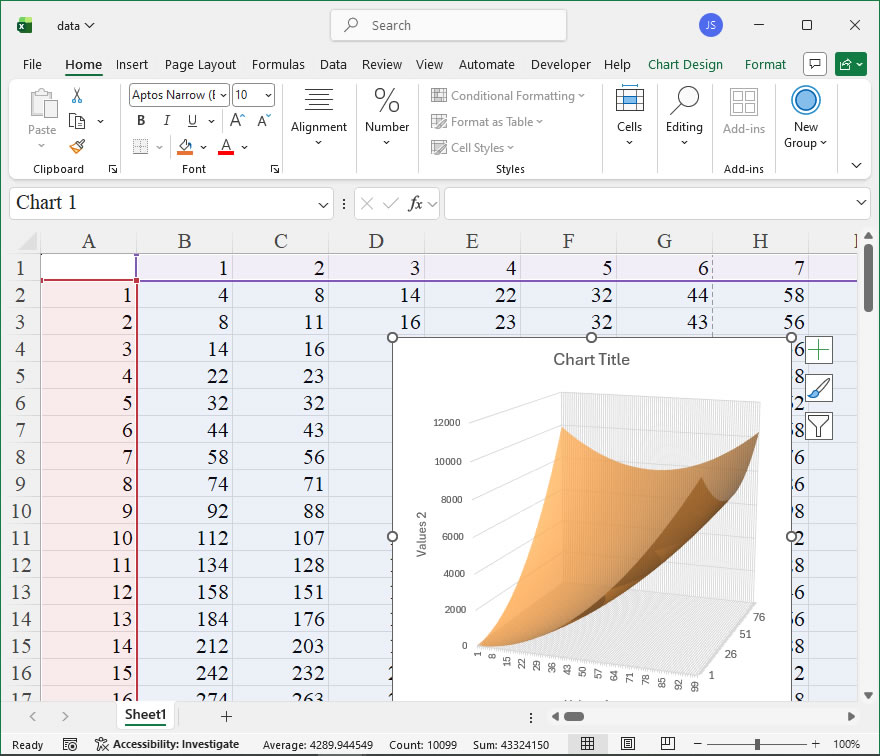
How to use Application.CalculationState in the xlwings API way
The CalculationState property of the Application object in Excel’s object model is accessible through the xlwings library, providing insight into the current calculation status of Excel. This property is particularly useful when automating tasks that depend on whether Excel is actively calculating formulas, has completed calculations, or is in a state where calculations are pending. By monitoring the CalculationState, developers can write more robust and efficient automation scripts that wait for calculations to finish before proceeding, thereby avoiding errors or incorrect data processing due to incomplete calculations.
Functionality:
The CalculationState property returns an integer value indicating the calculation state of Excel. It helps determine if Excel is busy calculating, done, or in another calculation-related state. This is essential in scenarios where subsequent operations, such as reading calculated cell values or saving workbooks, should only occur after all formulas have been recalculated. In xlwings, this property is accessed via the Application object, allowing Python scripts to interact with Excel’s calculation engine programmatically.
Syntax:
In xlwings, the CalculationState property is called on the app object, which represents the Excel application. The syntax is straightforward:
state = app.api.CalculationStateHere, app is an instance of the xlwings App class (e.g., created with app = xw.App() or xw.apps.active), and .api provides direct access to the underlying Excel object model. The CalculationState property does not take any parameters and returns an integer. The return values correspond to specific states, as defined in the Excel object model. Commonly used values include:
-4135(orxlwings.constants.CalculationState.xlDone): Indicates that calculations are complete.-4134(orxlwings.constants.CalculationState.xlCalculating): Indicates that calculations are in progress.-4133(orxlwings.constants.CalculationState.xlPending): Indicates that calculations are pending, meaning some formulas need to be recalculated but Excel hasn’t started yet.
For clarity, xlwings provides constants in the xlwings.constants module, though they are not always required if using the raw integer values. Developers can refer to the Excel VBA documentation for a full list, but these three states are the most relevant for typical automation tasks.
Examples:
Below are practical xlwings API code examples demonstrating how to use the CalculationState property in Python scripts.
- Checking if Excel is currently calculating:
This example waits for Excel to finish all calculations before proceeding, which is useful when working with workbooks that have complex formulas.
import xlwings as xw
import time

# Connect to the active Excel application
app = xw.apps.active

# Perform an action that triggers calculation, e.g., changing a cell value
wb = app.books.active
wb.sheets[0].range("A1").value = 10 # This might trigger recalculation

# Wait until calculations are complete
while app.api.CalculationState == -4134: # xlCalculating
time.sleep(0.1) # Pause briefly to avoid high CPU usage
print("Calculations finished. Safe to proceed.")- Monitoring calculation state during a long operation:
In this example, the script logs the calculation state while a large dataset is being processed, helping to debug or optimize performance.
import xlwings as xw

app = xw.App(visible=True) # Start a new Excel instance
wb = app.books.add()
sheet = wb.sheets[0]

# Fill a range with formulas to simulate a heavy calculation load
for i in range(1, 101):
    sheet.range(f"A{i}").formula = f"=RAND()*{i}"

# Force a full calculation
app.api.Calculate()

# Check and print the calculation state
state = app.api.CalculationState
if state == -4134:
    print("Excel is currently calculating formulas.")
elif state == -4135:
    print("Excel has finished all calculations.")
elif state == -4133:
    print("Calculations are pending.")
else:
    print(f"Unknown calculation state: {state}")

# Clean up
wb.close()
app.quit()- Using constants for better readability:
While xlwings doesn’t have built-in enums for all Excel constants, developers can define their own or use the ones available. This example shows how to use constants to make the code more maintainable.
import xlwings as xw

# Define constants based on Excel's object model (or import from xlwings.constants if available)
xlCalculating = -4134
xlDone = -4135
xlPending = -4133

app = xw.apps.active
state = app.api.CalculationState

if state == xlCalculating:
print("Wait for calculations to complete.")
elif state == xlDone:
print("Proceed with data extraction.")
else:
print("Check for pending calculations.")How To Create Surface Models Using xlwings?
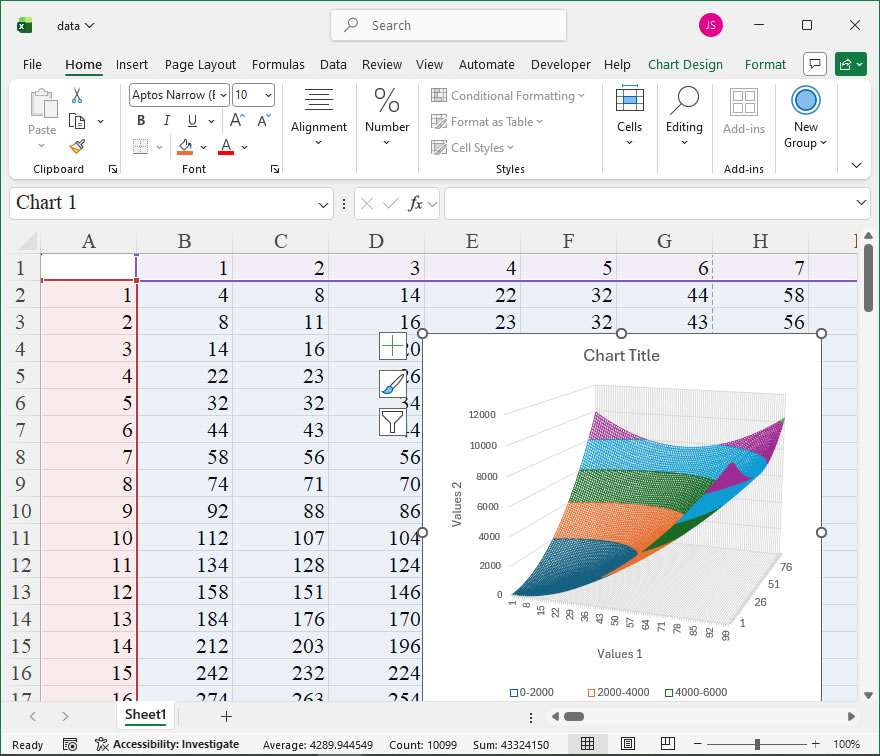
【Example】
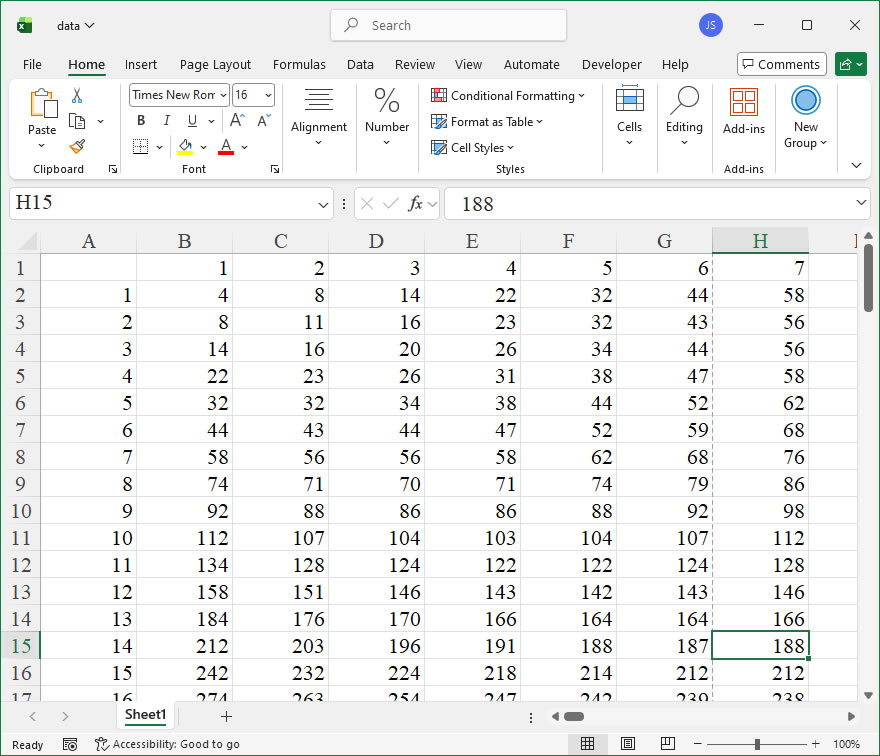
【Code】
import xlwings as xw
import os

def set_style(cht):
    cht.ChartArea.Format.Line.Visible=False
    cht.PlotArea.Format.Fill.Visible = False
    cht.PlotArea.Format.Line.Visible = False
    cht.PlotArea.Format.Line.ForeColor.RGB=xw.utils.rgb_to_int((200,200,200))
    #cht.PlotArea.Format.Line.ForeColor.ObjectThemeColor = msoThemeColorText1
    ax1 = cht.Axes(1)
    ax2 = cht.Axes(2)
    ax1.HasTitle = True
    ax1.AxisTitle.Text = 'Values 1'
    ax1.AxisTitle.Font.Size = 10
    ax1.TickLabels.Font.Size = 8
    #ax1.TickLabels.NumberFormat = '0.00'
    ax1.HasMajorGridlines = True
    ax2.HasTitle = True
    ax2.AxisTitle.Text = 'Values 2'
    ax2.AxisTitle.Font.Size = 10
    ax2.TickLabels.Font.Size = 8
    ax2.HasMajorGridlines = True
    cht.HasTitle = True
    #cht.ChartTitle.Caption = 'Plot'
    #cht.ChartTitle.Font.Size = 12


root=os.getcwd()
app=xw.App(visible=True,add_book=False)
wb=app.books.open(root+r'/data.xlsx',read_only=False)
sht=wb.sheets('Sheet1')

sht.api.Range('A1:CW100').Select()  #
shp=sht.api.Shapes.AddChart2(-1,xw.constants.ChartType.xlSurfaceWireframe,20,20,300,300,True)
cht=shp.Chart  #

set_style(cht)

cht.Export(root+'/cht.jpg')
cht.Export(root+'/cht.svg')
cht.ExportAsFixedFormat(0,root+'/cht.pdf')

#wb.save()
#app.kill()