【Method】

| Name | Description | Color Bar |
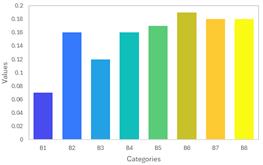
| parula | Gradient between blue, cyan, orange, and yellow | |
| turbo | Gradient between blue and red | |
| hsv | Hue component variation in the HSV color model | |
| hot | Gradient between black, red, orange, yellow, and white | |
| cool | Gradient between cyan and magenta | |
| spring | Gradient between magenta and yellow | |
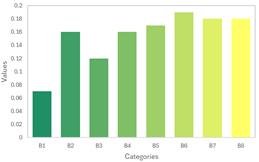
| summer | Gradient between green and yellow | |
| autumn | Gradient from red to orange-yellow, yellow | |
| winter | Gradient between blue and green | |
| gray | Linear grayscale color lookup table | |
| bone | Gray color lookup table with a higher blue component | |
| copper | Gradient between black and bright copper | |
| pink | Gradient between magenta and white | |
| sky | Gradient between white and sky blue | |
| abyss | Gradient between deep blue and sky blue | |
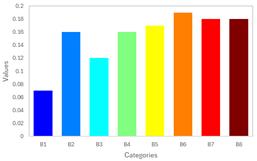
| jet | Gradient between blue, cyan, yellow, orange-red, and red |

【Example】
import xlwings as xw
import os

def set_style(cht):
    cht.ChartArea.Format.Line.Visible=False
    cht.PlotArea.Format.Fill.Visible=False
    cht.PlotArea.Format.Line.Visible=True
    cht.PlotArea.Format.Line.ForeColor.RGB=xw.utils.rgb_to_int((200,200,200))
    #cht.PlotArea.Format.Line.ForeColor.ObjectThemeColor = msoThemeColorText1
    ax1=cht.Axes(1)
    ax2=cht.Axes(2)
    ax1.HasTitle=True
    ax1.AxisTitle.Text='Categories'
    ax1.AxisTitle.Font.Size=10
    ax1.TickLabels.Font.Size=8
    #ax1.TickLabels.NumberFormat='0.00'
    ax1.HasMajorGridlines=False
    ax2.HasTitle=True
    ax2.AxisTitle.Text='Values'
    ax2.AxisTitle.Font.Size=10
    ax2.TickLabels.Font.Size=8
    ax2.HasMajorGridlines=False
    cht.HasTitle=True
    #cht.ChartTitle.Caption='Plot'
    #cht.ChartTitle.Font.Size=12

root=os.getcwd()
app=xw.App(visible=True,add_book=False)
wb=app.books.open(root+r'/data.xlsx',read_only=False)
sht=wb.sheets('Sheet1')

sht.api.Range('A2:B9').Select()
shp=sht.api.Shapes.AddChart2(-1,xw.constants.ChartType.xlColumnClustered,20,20,350,250,True)
cht=shp.Chart
cht.ChartGroups(1).GapWidth=50

cm=wb.sheets('parula').range('A1:C256').value

for i in range(8):
    count=int((i+1)/8*256)
    if count==256:
      r=int(cm[255][0])
      g=int(cm[255][1])
      b=int(cm[255][2])
    else:
      r=int(cm[count][0])
      g=int(cm[count][1])
      b=int(cm[count][2])

    cht.SeriesCollection(1).Points(i+1).Format.Fill. \
    ForeColor.RGB=xw.utils.rgb_to_int((r,g,b))

set_style(cht)

#wb.save()
#app.kill()
Leave a Reply