Blog
How To Reference a Pivot Table Using xlwings?
Method
def ref_pivot_table():
#Pivot table reference
print(sht_pvt.api.PivotTables().Count)
print(sht_pvt.api.PivotTables(1).Name) #Reference by index number
print(sht_pvt.api.PivotTables(‘Pivot’).Name) #Reference by name
Sample Code
#Pivot Table References

import xlwings as xw    #Import xlwings
import os    #Import os

root = os.getcwd()    #Get current path
#Create Excel application window, visible, no workbook added
app=xw.App(visible=True, add_book=False)
#Open data file, writable
bk=app.books.open(fullname=root+r'\Pivot.xlsx',read_only=False)
#Get data source worksheet
sht_data=bk.sheets.active
#Data cell range
rng_data=sht_data.api.Range('A1').CurrentRegion
#Create a new worksheet for the pivot table
sht_pvt=bk.sheets.add()
sht_pvt.name='Pivot Table'

def create_pivot_table():
    #Location of data
    rng_data=sht_data.api.Range('A1').CurrentRegion
    #Location of pivot table
    rng_pvt=sht_pvt.api.Range('A1')

    #Create pivot table cache
    pvc=bk.api.PivotCaches().Create(\
          SourceType=xw.constants.PivotTableSourceType.xlDatabase,\
          SourceData=rng_data)
    #Create pivot table
    pvt=pvc.CreatePivotTable(\
          TableDestination=rng_pvt,\
          TableName='Pivot')

    #Set fields
    pvt.PivotFields('Category').Orientation=\
        xw.constants.PivotFieldOrientation.xlPageField    #Page fields
    pvt.PivotFields('Category').Position=1
    pvt.PivotFields('Product').Orientation=\
        xw.constants.PivotFieldOrientation.xlColumnField    #Column fields
    pvt.PivotFields('Product').Position=1
    pvt.PivotFields('Origin').Orientation=\
        xw.constants.PivotFieldOrientation.xlRowField    #Row fields
    pvt.PivotFields('Origin').Position=1
    pvt.PivotFields('Amount').Orientation=\
        xw.constants.PivotFieldOrientation.xlDataField    #Value fields

def ref_pivot_table():
    #Pivot table reference
    print(sht_pvt.api.PivotTables().Count)
    print(sht_pvt.api.PivotTables(1).Name)    #Reference by index number
    print(sht_pvt.api.PivotTables('Pivot').Name)    #Reference by name

create_pivot_table()
ref_pivot_table()

#bk.save()
#bk.close()
#app.kill()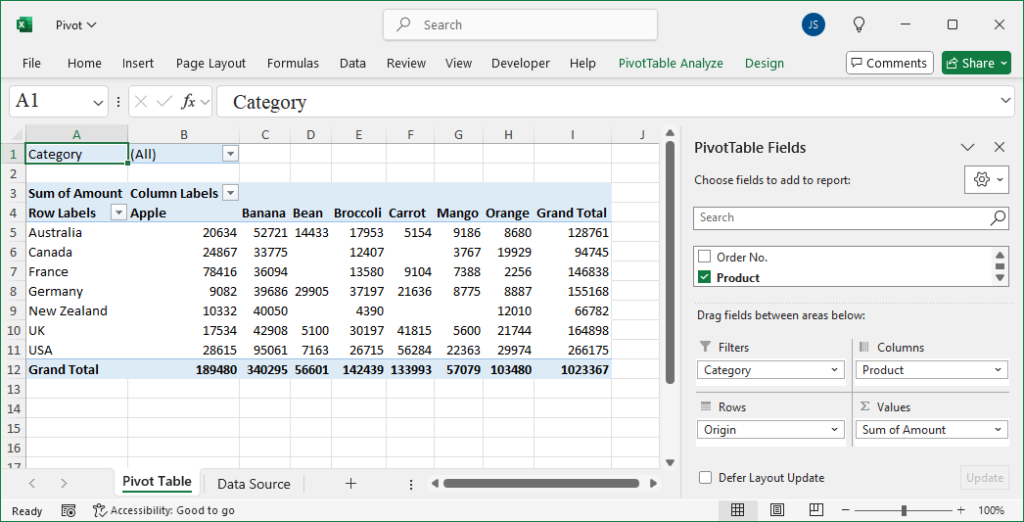
How To Create a Pivot Table using Cache Using xlwings?
Method
def create_pivot_table():
#Location of pivot table
rng_pvt=sht_pvt.api.Range(‘A1’)
#Create pivot table cache
pvc=bk.api.PivotCaches().Create(\
SourceType=xw.constants.PivotTableSourceType.xlDatabase,\
SourceData=rng_data)
#Create pivot table
pvt=pvc.CreatePivotTable(\
TableDestination=rng_pvt,\
TableName=’Pivot’)
#Set fields
pvt.PivotFields(‘Category’).Orientation=\
xw.constants.PivotFieldOrientation.xlPageField #Page fields
pvt.PivotFields(‘Category’).Position=1
pvt.PivotFields(‘Product’).Orientation=\
xw.constants.PivotFieldOrientation.xlColumnField #Column fields
pvt.PivotFields(‘Product’).Position=1
pvt.PivotFields(‘Origin’).Orientation=\
xw.constants.PivotFieldOrientation.xlRowField #Row fields
pvt.PivotFields(‘Origin’).Position=1
pvt.PivotFields(‘Amount’).Orientation=\
xw.constants.PivotFieldOrientation.xlDataField #Value fields
Sample Code
#Create Pivot Table with Cache

import xlwings as xw    #Import xlwings
import os    #Import os

root = os.getcwd()    #Get current path
#Create Excel application window, visible, no workbook added
app=xw.App(visible=True, add_book=False)
#Open data file, writable
bk=app.books.open(fullname=root+r'\Pivot.xlsx',read_only=False)
#Get data source worksheet
sht_data=bk.sheets.active
#Data cell range
rng_data=sht_data.api.Range('A1').CurrentRegion
#Create a new worksheet for the pivot table
sht_pvt=bk.sheets.add()
sht_pvt.name='Pivot Table'

def create_pivot_table():
    #Location of pivot table
    rng_pvt=sht_pvt.api.Range('A1')
    #Create pivot table cache
    pvc=bk.api.PivotCaches().Create(\
          SourceType=xw.constants.PivotTableSourceType.xlDatabase,\
          SourceData=rng_data)
    #Create pivot table
    pvt=pvc.CreatePivotTable(\
          TableDestination=rng_pvt,\
          TableName='Pivot')

    #Set fields
    pvt.PivotFields('Category').Orientation=\
        xw.constants.PivotFieldOrientation.xlPageField    #Page fields
    pvt.PivotFields('Category').Position=1
    pvt.PivotFields('Product').Orientation=\
        xw.constants.PivotFieldOrientation.xlColumnField    #Column fields
    pvt.PivotFields('Product').Position=1
    pvt.PivotFields('Origin').Orientation=\
        xw.constants.PivotFieldOrientation.xlRowField    #Row fields
    pvt.PivotFields('Origin').Position=1
    pvt.PivotFields('Amount').Orientation=\
        xw.constants.PivotFieldOrientation.xlDataField    #Value fields

create_pivot_table()

#bk.save()
#bk.close()
#app.kill()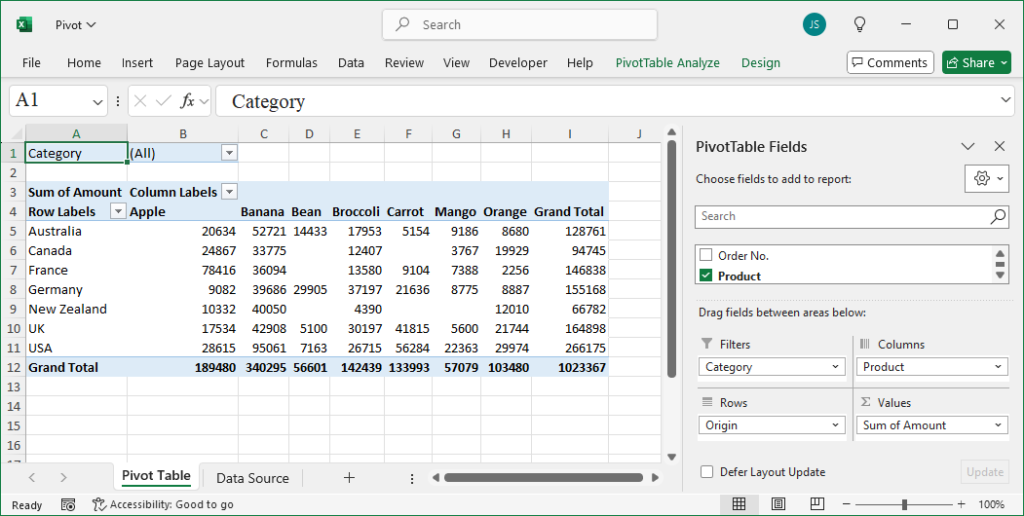
How To Create a Pivot Table using the PivotTableWizard Method Using xlwings?
Method
def create_pivot_table():
#Create pivot table
pvt=sht_pvt.api.PivotTableWizard(\
SourceType=xw.constants.PivotTableSourceType.xlDatabase,\
SourceData=rng_data)
pvt.Name=’Pivot’
#Set fields
pvt.PivotFields(‘Category’).Orientation=\
xw.constants.PivotFieldOrientation.xlPageField #Page fields
pvt.PivotFields(‘Category’).Position=1
pvt.PivotFields(‘Product’).Orientation=\
xw.constants.PivotFieldOrientation.xlColumnField #Column fields
pvt.PivotFields(‘Product’).Position=1
pvt.PivotFields(‘Origin’).Orientation=\
xw.constants.PivotFieldOrientation.xlRowField #Row fields
pvt.PivotFields(‘Origin’).Position=1
pvt.PivotFields(‘Amount’).Orientation=\
xw.constants.PivotFieldOrientation.xlDataField #Value fields
Sample Code
#Create Pivot Table using PivotTableWizard Method

import xlwings as xw    #Import xlwings
import os    #Import os

root = os.getcwd()    #Get current path
#Create Excel application window, visible, no workbook added
app=xw.App(visible=True, add_book=False)
#Open data file, writable
bk=app.books.open(fullname='Pivot.xlsx',read_only=False)
#Get data source worksheet
sht_data=bk.sheets.active
#Data cell range
rng_data=sht_data.api.Range('A1').CurrentRegion
#Create a new worksheet for the pivot table
sht_pvt=bk.sheets.add()
sht_pvt.name='Pivot Table'

def create_pivot_table():
    #Create pivot table
    pvt=sht_pvt.api.PivotTableWizard(\
        SourceType=xw.constants.PivotTableSourceType.xlDatabase,\
        SourceData=rng_data)
    pvt.Name='Pivot'

    #Set fields
    pvt.PivotFields('Category').Orientation=\
        xw.constants.PivotFieldOrientation.xlPageField    #Page fields
    pvt.PivotFields('Category').Position=1
    pvt.PivotFields('Product').Orientation=\
        xw.constants.PivotFieldOrientation.xlColumnField    #Column fields
    pvt.PivotFields('Product').Position=1
    pvt.PivotFields('Origin').Orientation=\
        xw.constants.PivotFieldOrientation.xlRowField    #Row fields
    pvt.PivotFields('Origin').Position=1
    pvt.PivotFields('Amount').Orientation=\
        xw.constants.PivotFieldOrientation.xlDataField    #Value fields


create_pivot_table()

#bk.save()
#bk.close()
#app.kill()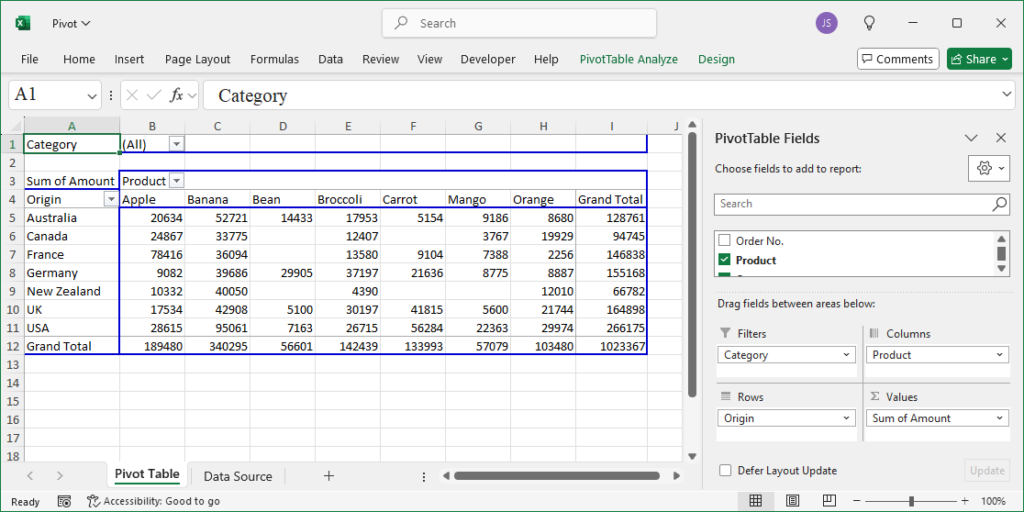
How To Set Properties of Individual Points in a Series Using xlwings?
Method
Using the `Points` property of a Series object, you can get all the data points in a series. By using an index, you can extract and set one or more specific points. A single point is represented by a Point object, and its properties and methods can be used to modify the point. This is mainly used for line charts, scatter plots, and radar charts.
In the following example, the properties of the third point in the line chart of series 2 are modified. The foreground and background colors are set to blue, the marker style is changed to a diamond, and the marker size is set to 10.
sht.api.Range(‘A1:B7’).Select()
cht=sht.api.Shapes.AddChart().Chart
ser2=cht.SeriesCollection(‘P2’) #Second series
ser2.ChartType=xw.constants.ChartType.xlLine #Line chart
ser2.Smooth=True #Smooth processing
ser2.MarkerStyle=xw.constants.MarkerStyle.xlMarkerStyleTriangle #Markers
ser2.MarkerForegroundColor=xw.utils.rgb_to_int((0,0,255)) #Color
ser2.HasDataLabels=True #Data labels
ser2.Points(3).MarkerForegroundColor=xw.utils.rgb_to_int((0,0,255))
ser2.Points(3).MarkerBackgroundColor=xw.utils.rgb_to_int((0,0,255))
ser2.Points(3).MarkerStyle=xw.constants.MarkerStyle.xlMarkerStyleDiamond
ser2.Points(3).MarkerSize=10
Sample Code
#Set Points in Series

import xlwings as xw
import os

root = os.getcwd()
app = xw.App(visible=True, add_book=False)
wb=app.books.open(root+r'/P1P2.xlsx',read_only=False)
sht=wb.sheets(1)

sht.api.Range('A1:B7').Select()
cht=sht.api.Shapes.AddChart().Chart
ser2=cht.SeriesCollection('P2')    #Second series
ser2.ChartType=xw.constants.ChartType.xlLine    #Line chart
ser2.Smooth=True    #Smooth processing
ser2.MarkerStyle=xw.constants.MarkerStyle.xlMarkerStyleTriangle    #Markers
ser2.MarkerForegroundColor=xw.utils.rgb_to_int((0,0,255))    #Color
ser2.HasDataLabels=True    #Data labels
ser2.Points(3).MarkerForegroundColor=xw.utils.rgb_to_int((0,0,255))
ser2.Points(3).MarkerBackgroundColor=xw.utils.rgb_to_int((0,0,255))
ser2.Points(3).MarkerStyle=xw.constants.MarkerStyle.xlMarkerStyleDiamond
ser2.Points(3).MarkerSize=10

#wb.save()
#wb.close()
#app.kill()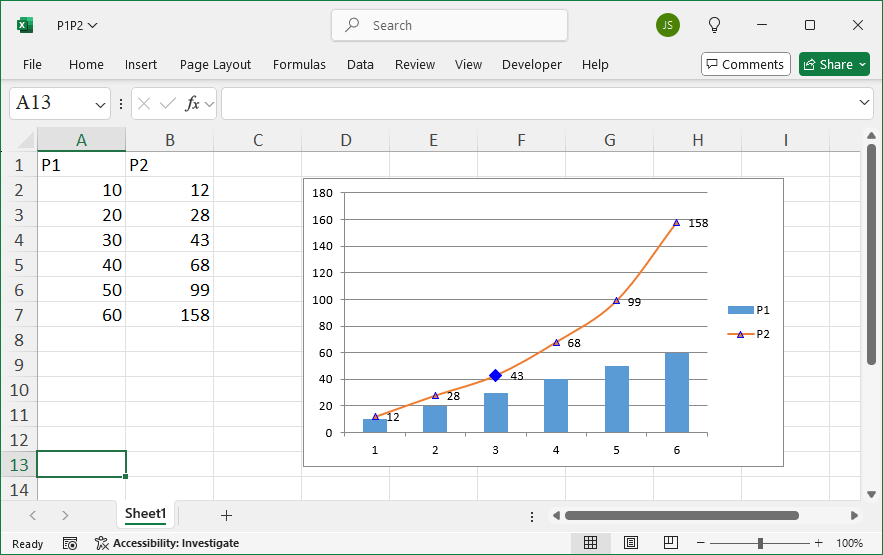
How To Set Series Using xlwings?
Method
Each Chart object has a `SeriesCollection` property, which returns a collection containing all series in the chart. What is a series? In a composite bar chart, each row of data corresponds to a composite bar, and within each composite bar, there are two different-colored individual bars. All individual bars of the same color form a series. Therefore, the chart has two series. A series is represented by a Series object.
In the example below, the second series is referenced, and its `ChartType` property is used to change the chart type to a line chart. The `Smooth` property is set to `True` to smooth the line. The `MarkerStyle` property is used to set the markers at data points as triangles, and the `MarkerForegroundColor` property sets the marker color to blue. The `HasDataLabel` property is set to `True` to display data labels.
sht.api.Range(‘A1:B7’).Select()
cht=sht.api.Shapes.AddChart().Chart
ser2=cht.SeriesCollection(‘P2’) #Second series
ser2.ChartType=xw.constants.ChartType.xlLine #Line chart
ser2.Smooth=True #Smooth processing
ser2.MarkerStyle=xw.constants.MarkerStyle.xlMarkerStyleTriangle #Markers
ser2.MarkerForegroundColor=xw.utils.rgb_to_int((0,0,255)) #Color
ser2.HasDataLabels=True #Data labels
Sample Code
#Set series

import xlwings as xw
import os

root = os.getcwd()
app = xw.App(visible=True, add_book=False)
wb=app.books.open(root+r'/P1P2.xlsx',read_only=False)
sht=wb.sheets(1)

sht.api.Range('A1:B7').Select()
cht=sht.api.Shapes.AddChart().Chart
ser2=cht.SeriesCollection('P2')    #Second series
ser2.ChartType=xw.constants.ChartType.xlLine    #Line chart
ser2.Smooth=True    #Smooth processing
ser2.MarkerStyle=xw.constants.MarkerStyle.xlMarkerStyleTriangle    #Markers
ser2.MarkerForegroundColor=xw.utils.rgb_to_int((0,0,255))    #Color
ser2.HasDataLabels=True    #Data labels

#wb.save()
#wb.close()
#app.kill()
Common Properties and Methods of the Chart Object
Method
|
Name |
Meaning |
|
BackWall |
Returns the Walls object, which allows users to format the background wall of a 3D chart individually. |
|
BarShape |
Shape of the bars |
|
ChartArea |
Returns the ChartArea object, representing the entire chart area |
|
ChartStyle |
Returns or sets the chart style. You can use a number between 1 and 48 to set the chart style |
|
ChartTitle |
Returns the ChartTitle object, representing the title of the specified chart |
|
ChartType |
Returns or sets the chart type |
|
Copy |
Copies the chart worksheet to another location in the workbook |
|
CopyPicture |
Copies the chart as an image to the clipboard |
|
DataTable |
Returns the DataTable object, representing the data table of this chart |
|
Delete |
Deletes the chart |
|
Export |
Exports the chart as an image file |
|
HasAxis |
Returns or sets the axis displayed on the chart |
|
HasDataTable |
Returns True if the chart has a data table, otherwise False |
|
HasTitle |
Sets whether to display the title |
|
Legend |
Returns a Legend object, representing the chart legend |
|
Move |
Moves the chart worksheet to another location in the workbook |
|
Name |
The name of the chart |
|
PlotArea |
Returns a PlotArea object, representing the plot area of the chart |
|
PlotBy |
Returns or sets the way rows or columns are used as data series in the chart. This can be one of the XlRowCol constants: xlColumns or xlRows |
|
SaveAs |
Saves the chart to a different file |
|
Select |
Selects the chart |
|
SeriesCollection |
Returns a collection containing all series in the chart |
|
SetElement |
Sets chart elements |
|
SetSourceData |
Binds the data used to draw the chart |
|
Visible |
Returns or sets an XlSheetVisibility value to determine whether the object is visible |
|
Walls |
Returns a Walls object, representing the background walls of a 3D chart |
sht.api.Range(‘A1:B7’).Select() #Data
cht=sht.api.Shapes.AddChart2().Chart #Add chart
axs=cht.Axes(1) #Horizontal axis
axs2=cht.Axes(2) #Vertical axis
axs.HasTitle=True #X axis title
axs.AxisTitle.Caption=’X Axis Title’ #Title text
axs.AxisTitle.Font.Italic=True #Font Italic
axs.AxisTitle.Font.Color=xw.utils.rgb_to_int((255, 0, 0)) #Font color is red
axs2.HasTitle=True #Vertical axis has title
axs2.AxisTitle.Caption=’Y Axis Title’ #Title text
axs2.AxisTitle.Font.Bold=True #Font bold
Sample Code
#Other Members of Chart Object

import xlwings as xw
import os

root=os.getcwd()
app=xw.App(visible=True,add_book=False)
wb=app.books.open('GDP.xlsx',read_only=False)
sht=wb.sheets('Sheet1')

sht.api.Range('A1:B7').Select()    #Data
cht=sht.api.Shapes.AddChart2().Chart    #Add chart
axs=cht.Axes(1)    #Horizontal axis
axs2=cht.Axes(2)    #Vertical axis
axs.HasTitle=True    #X axis title
axs.AxisTitle.Caption='X Axis Title'    #Title text
axs.AxisTitle.Font.Italic=True    #Font Italic
axs.AxisTitle.Font.Color=xw.utils.rgb_to_int((255, 0, 0))    #Font color is red
axs2.HasTitle=True    #Vertical axis has title
axs2.AxisTitle.Caption='Y Axis Title'    #Title text
axs2.AxisTitle.Font.Bold=True    #Font bold

#wb.save()
#wb.close()
#app.kill()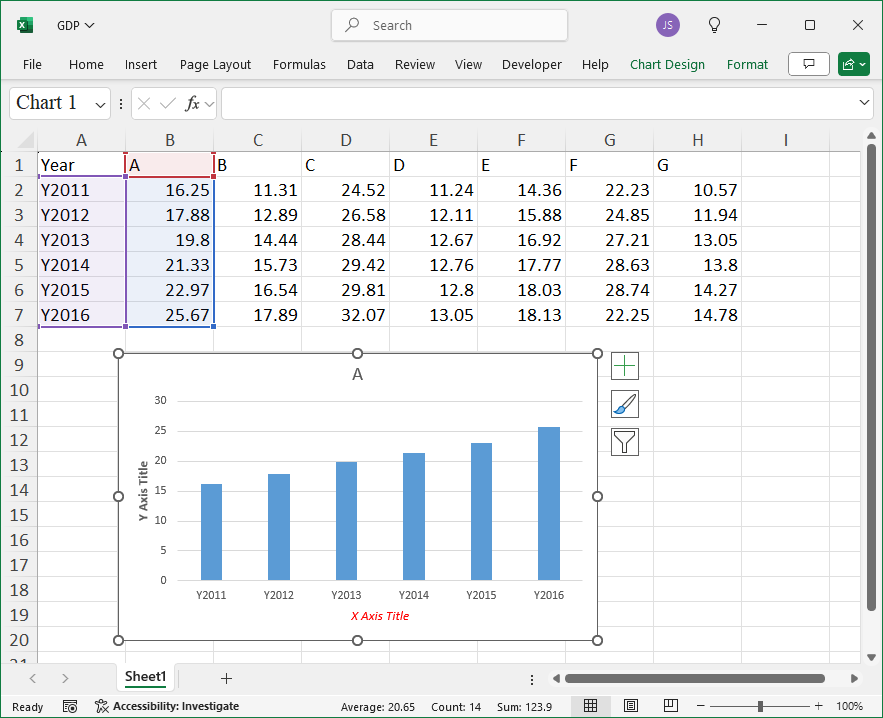
How To Set Chart Series Using xlwings?
Method
You can set the chart type using the `chart_type` property of the chart object or the `ChartType` property of the Chart object. For a chart object `cht`, set the chart type as shown below:
【xlwings】
cht.chart_type=”column_clustered”
【xlwings API】
cht.ChartType=xw.constants.ChartType.xlColumnClustered
The values for the `chart_type` or `ChartType` property are as shown in the table below.
|
API Constant Name |
API Value |
xlwings Value |
Description |
|
xl3DArea |
-4098 |
“3d_area” |
3D Area Chart |
|
xl3DAreaStacked |
78 |
“3d_area_stacked” |
3D Stacked Area Chart |
|
xl3DAreaStacked100 |
79 |
“3d_area_stacked_100” |
Percentage Stacked Area Chart |
|
xl3DBarClustered |
60 |
“3d_bar_clustered” |
3D Clustered Bar Chart |
|
xl3DBarStacked |
61 |
“3d_bar_stacked” |
3D Stacked Bar Chart |
|
xl3DBarStacked100 |
62 |
“3d_bar_stacked_100” |
3D Percentage Stacked Bar Chart |
|
xl3DColumn |
-4100 |
“3d_column” |
3D Column Chart |
|
xl3DColumnClustered |
54 |
“3d_column_clustered” |
3D Clustered Column Chart |
|
xl3DColumnStacked |
55 |
“3d_column_stacked” |
3D Stacked Column Chart |
|
xl3DColumnStacked100 |
56 |
“3d_column_stacked_100” |
3D Percentage Stacked Column Chart |
|
xl3DLine |
-4101 |
“3d_line” |
3D Line Chart |
|
xl3DPie |
-4102 |
“3d_pie” |
3D Pie Chart |
|
xl3DPieExploded |
70 |
“3d_pie_exploded” |
Exploded 3D Pie Chart |
|
xlArea |
1 |
“area” |
Area Chart |
|
xlAreaStacked |
76 |
“area_stacked” |
Stacked Area Chart |
|
xlAreaStacked100 |
77 |
“area_stacked_100” |
Percentage Stacked Area Chart |
|
xlBarClustered |
57 |
“bar_clustered” |
Clustered Bar Chart |
|
xlBarOfPie |
71 |
“bar_of_pie” |
Bar of Pie Chart |
|
xlBarStacked |
58 |
“bar_stacked” |
Stacked Bar Chart |
|
xlBarStacked100 |
59 |
“bar_stacked_100” |
Percentage Stacked Bar Chart |
|
xlBubble |
个 |
“bubble” |
Bubble Chart |
|
xlBubble3DEffect |
87 |
“bubble_3d_effect” |
3D Bubble Chart |
|
xlColumnClustered |
51 |
“column_clustered” |
Clustered Column Chart |
|
xlColumnStacked |
52 |
“column_stacked” |
Stacked Column Chart |
|
xlColumnStacked100 |
53 |
“column_stacked_100” |
Percentage Stacked Column Chart |
|
xlConeBarClustered |
102 |
“cone_bar_clustered” |
Clustered Cone Bar Chart |
|
xlConeBarStacked |
103 |
“cone_bar_stacked” |
Stacked Cone Bar Chart |
|
xlConeBarStacked100 |
104 |
“cone_bar_stacked_100” |
Percentage Stacked Cone Bar Chart |
|
xlConeCol |
105 |
“cone_col” |
3D Cone Column Chart |
|
xlConeColClustered |
99 |
“cone_col_clustered” |
Clustered Cone Column Chart |
|
xlConeColStacked |
100 |
“cone_col_stacked” |
Stacked Cone Column Chart |
|
xlConeColStacked100 |
101 |
“cone_col_stacked_100” |
Percentage Stacked Cone Column Chart |
|
xlCylinderBarClustered |
95 |
“cylinder_bar_clustered” |
Clustered Cylinder Bar Chart |
|
xlCylinderBarStacked |
96 |
“cylinder_bar_stacked” |
Stacked Cylinder Bar Chart |
|
xlCylinderBarStacked100 |
97 |
“cylinder_bar_stacked_100” |
Percentage Stacked Cylinder Bar Chart |
|
xlCylinderCol |
98 |
“cylinder_col” |
3D Cylinder Column Chart |
|
xlCylinderColClustered |
92 |
“cylinder_col_clustered” |
Clustered Cylinder Column Chart |
|
xlCylinderColStacked |
93 |
“cylinder_col_stacked” |
Stacked Cylinder Column Chart |
|
xlCylinderColStacked100 |
94 |
“cylinder_col_stacked_100” |
Percentage Stacked Cylinder Column Chart |
|
xlDoughnut |
-4120 |
“doughnut” |
Doughnut Chart |
|
xlDoughnutExploded |
80 |
“doughnut_exploded” |
Exploded Doughnut Chart |
|
xlLine |
4 |
“line” |
Line Chart |
|
xlLineMarkers |
65 |
“line_markers” |
Line Chart with Data Markers |
|
xlLineMarkersStacked |
66 |
“line_markers_stacked” |
Stacked Line Chart with Data Markers |
|
xlLineMarkersStacked100 |
67 |
“line_markers_stacked_100” |
Percentage Stacked Line Chart with Data Markers |
|
xlLineStacked |
63 |
“line_stacked” |
Stacked Line Chart |
|
xlLineStacked100 |
64 |
“line_stacked_100” |
Percentage Stacked Line Chart |
|
xlPie |
5 |
“pie” |
Pie Chart |
|
xlPieExploded |
69 |
“pie_exploded” |
Exploded Pie Chart |
|
xlPieOfPie |
68 |
“pie_of_pie” |
Pie of Pie Chart |
|
xlPyramidBarClustered |
109 |
“pyramid_bar_clustered” |
Compound Bar Pyramid Chart |
|
xlPyramidBarStacked |
110 |
“pyramid_bar_stacked” |
Stacked Bar Pyramid Chart |
|
xlPyramidBarStacked100 |
111 |
“pyramid_bar_stacked_100” |
Percentage Stacked Bar Pyramid Chart |
|
xlPyramidCol |
112 |
“pyramid_col” |
3D Column Pyramid Chart |
|
xlPyramidColClustered |
106 |
“pyramid_col_clustered” |
Compound Column Pyramid Chart |
|
xlPyramidColStacked |
107 |
“pyramid_col_stacked” |
Stacked Column Pyramid Chart |
|
xlPyramidColStacked100 |
108 |
“pyramid_col_stacked_100” |
Percentage Stacked Column Pyramid Chart |
|
xlRadar |
-4151 |
“radar” |
Radar Chart. |
|
xlRadarFilled |
82 |
“radar_filled” |
Filled Radar Chart |
|
xlRadarMarkers |
81 |
“radar_markers” |
Radar Chart with Data Markers |
|
xlRegionMap |
140 |
|
Map Chart |
|
xlStockHLC |
88 |
“stock_hlc” |
High-Low-Close Stock Chart |
|
xlStockOHLC |
89 |
“stock_ohlc” |
Open-High-Low-Close Stock Chart |
|
xlStockVHLC |
90 |
“stock_vhlc” |
Volume-High-Low-Close Stock Chart |
|
xlStockVOHLC |
91 |
“stock_vohlc” |
Volume-Open-High-Low-Close Stock Chart |
|
xlSurface |
83 |
“surface” |
3D Surface Chart |
|
xlSurfaceTopView |
85 |
“surface_top_view” |
Surface Chart (Top View) |
|
xlSurfaceTopViewWireframe |
86 |
“surface_top_view_wireframe” |
Surface Chart (Top View Wireframe) |
|
xlSurfaceWireframe |
84 |
“surface_wireframe” |
3D Surface Chart (Wireframe) |
|
xlXYScatter |
-4169 |
“xy_scatter” |
Scatter Plot |
|
xlXYScatterLines |
74 |
“xy_scatter_lines” |
Line Scatter Plot |
|
xlXYScatterLinesNoMarkers |
75 |
“xy_scatter_lines_no_markers” |
Line Scatter Plot Without Markers |
|
xlXYScatterSmooth |
72 |
“xy_scatter_smooth” |
Smooth Line Scatter Plot |
|
xlXYScatterSmoothNoMarkers |
73 |
“xy_scatter_smooth_no_markers” |
Smooth Line Scatter Plot Without Markers |
sht.api.Range(‘A1’).CurrentRegion.Select() #Data
sht.api.Shapes.AddChart2(-1,xw.constants.ChartType.xlColumnClustered,20,150,300,200,True)
Sample Code
#Chart type

import xlwings as xw
import os

root = os.getcwd()
app = xw.App(visible=True, add_book=False)
wb=app.books.open('GDP.xlsx',read_only=False)
sht=wb.sheets(1)

sht.api.Range('A1').CurrentRegion.Select()    #Data
sht.api.Shapes.AddChart2(-1,xw.constants.ChartType.xlColumnClustered,20,150,300,200,True)
sht.api.Shapes.AddChart2(-1,xw.constants.ChartType.xlBarClustered,400,150,300,200,True)
sht.api.Shapes.AddChart2(-1,xw.constants.ChartType.xlConeBarStacked,20,400,300,200,True)
sht.api.Shapes.AddChart2(-1,xw.constants.ChartType.xlLineMarkersStacked,400,400,300,200,True)
sht.api.Shapes.AddChart2(-1,xw.constants.ChartType.xlXYScatter,20,650,300,200,True)
sht.api.Shapes.AddChart2(-1,xw.constants.ChartType.xlPieOfPie,400,650,300,200,True)

#wb.save()
#wb.close()
#app.kill()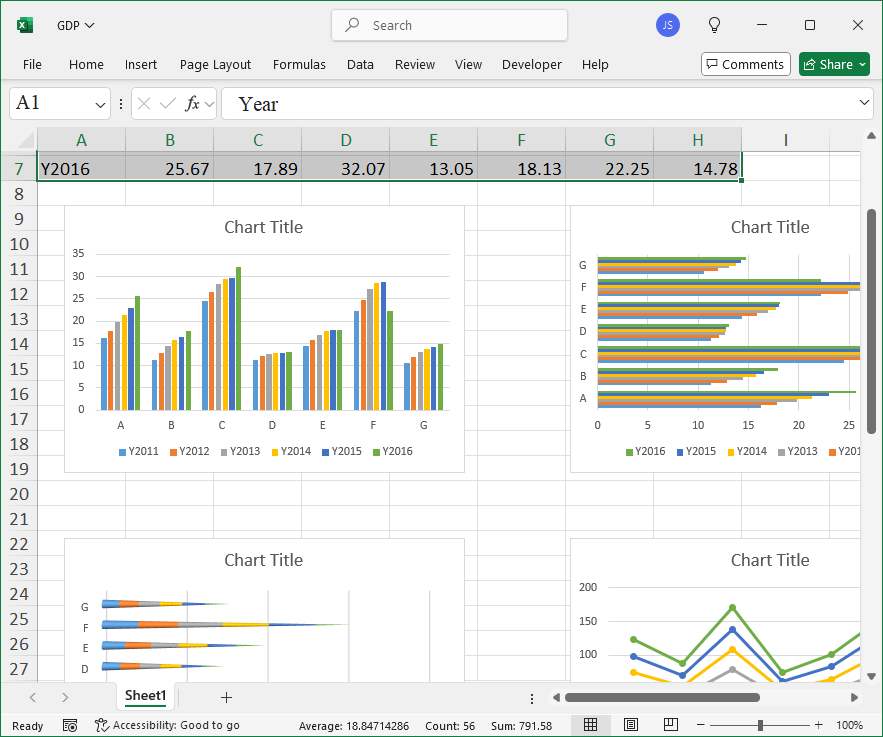
How To Bind Data Using xlwings?
Method
There are three methods for binding data to a chart:
– Use the `Select` method on a cell range to select data.
– Use the `SetSourceData` method of the `Chart` object to bind data.
– Use the `ChartWizard` method in the API approach to bind data.
The `SetSourceData` method of the `Chart` object allows you to set the source data range for the specified chart. The syntax is as follows:
cht.SetSourceData(Source, PlotBy)
Here, `cht` is the generated `Chart` object, and the parameters are as follows:
– `Source` – A `Range` object that specifies the source data range for the chart.
– `PlotBy` – Specifies how the data is plotted. A value of 1 means the data is plotted by columns, and a value of 2 means it is plotted by rows.
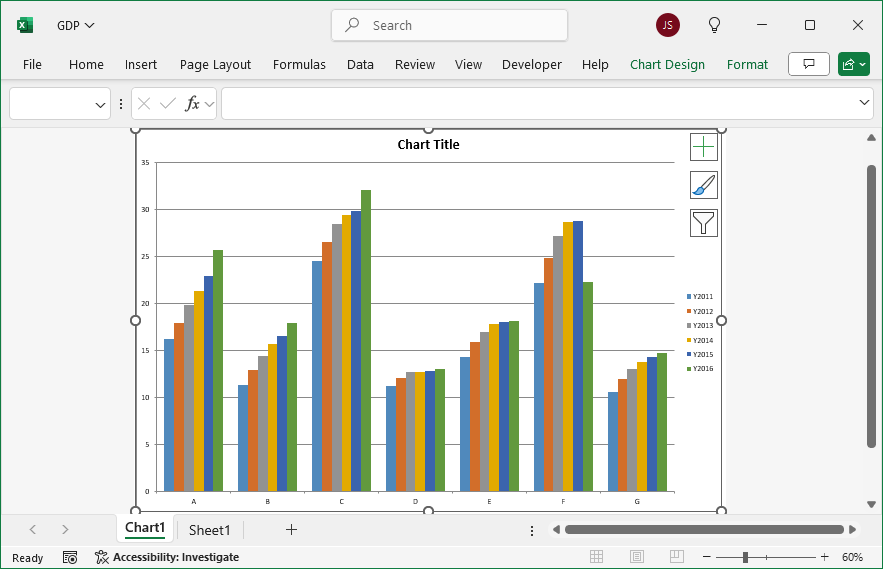
How To Create a Chart Worksheet Using xlwings?
Method
To create a chart worksheet (a chart that occupies the entire worksheet), use the `Add` method from the `Charts` collection. The syntax is as follows:
wb.api.Charts.Add(Before,After,Count,Type)
Here, `wb` represents the specified workbook object. The parameters are optional and are explained as follows:
– `Before` – Specifies a worksheet object, and the newly created chart worksheet will be placed before this worksheet.
– `After` – Specifies a worksheet object, and the newly created chart worksheet will be placed after this worksheet.
– `Count` – Specifies the number of chart worksheets to add. The default value is 1.
– `Type` – Specifies the chart type to add.
Note: If both `Before` and `After` are omitted, the newly created chart worksheet will be inserted before the active worksheet.
cht=wb.api.Charts.Add()
cht.SetSourceData(Source=sht.api.Range(“A1:H7”), PlotBy=1)
cht.ChartType=xw.constants.ChartType.xlColumnClustered
cht.HasTitle=True
Sample Code
#Create chart worksheet

import xlwings as xw
import os

root=os.getcwd()
app=xw.App(visible=True, add_book=False)
wb=app.books.open('GDP.xlsx',read_only=False)
sht=wb.sheets('Sheet1')

cht=wb.api.Charts.Add()
cht.SetSourceData(Source=sht.api.Range("A1:H7"), PlotBy=1)
cht.ChartType=xw.constants.ChartType.xlColumnClustered
cht.HasTitle=True

#wb.save()
#wb.close()
#app.kill()