Method
Using the `Points` property of a Series object, you can get all the data points in a series. By using an index, you can extract and set one or more specific points. A single point is represented by a Point object, and its properties and methods can be used to modify the point. This is mainly used for line charts, scatter plots, and radar charts.
In the following example, the properties of the third point in the line chart of series 2 are modified. The foreground and background colors are set to blue, the marker style is changed to a diamond, and the marker size is set to 10.
sht.api.Range(‘A1:B7’).Select()
cht=sht.api.Shapes.AddChart().Chart
ser2=cht.SeriesCollection(‘P2’) #Second series
ser2.ChartType=xw.constants.ChartType.xlLine #Line chart
ser2.Smooth=True #Smooth processing
ser2.MarkerStyle=xw.constants.MarkerStyle.xlMarkerStyleTriangle #Markers
ser2.MarkerForegroundColor=xw.utils.rgb_to_int((0,0,255)) #Color
ser2.HasDataLabels=True #Data labels
ser2.Points(3).MarkerForegroundColor=xw.utils.rgb_to_int((0,0,255))
ser2.Points(3).MarkerBackgroundColor=xw.utils.rgb_to_int((0,0,255))
ser2.Points(3).MarkerStyle=xw.constants.MarkerStyle.xlMarkerStyleDiamond
ser2.Points(3).MarkerSize=10
Sample Code
#Set Points in Series

import xlwings as xw
import os

root = os.getcwd()
app = xw.App(visible=True, add_book=False)
wb=app.books.open(root+r'/P1P2.xlsx',read_only=False)
sht=wb.sheets(1)

sht.api.Range('A1:B7').Select()
cht=sht.api.Shapes.AddChart().Chart
ser2=cht.SeriesCollection('P2')    #Second series
ser2.ChartType=xw.constants.ChartType.xlLine    #Line chart
ser2.Smooth=True    #Smooth processing
ser2.MarkerStyle=xw.constants.MarkerStyle.xlMarkerStyleTriangle    #Markers
ser2.MarkerForegroundColor=xw.utils.rgb_to_int((0,0,255))    #Color
ser2.HasDataLabels=True    #Data labels
ser2.Points(3).MarkerForegroundColor=xw.utils.rgb_to_int((0,0,255))
ser2.Points(3).MarkerBackgroundColor=xw.utils.rgb_to_int((0,0,255))
ser2.Points(3).MarkerStyle=xw.constants.MarkerStyle.xlMarkerStyleDiamond
ser2.Points(3).MarkerSize=10

#wb.save()
#wb.close()
#app.kill()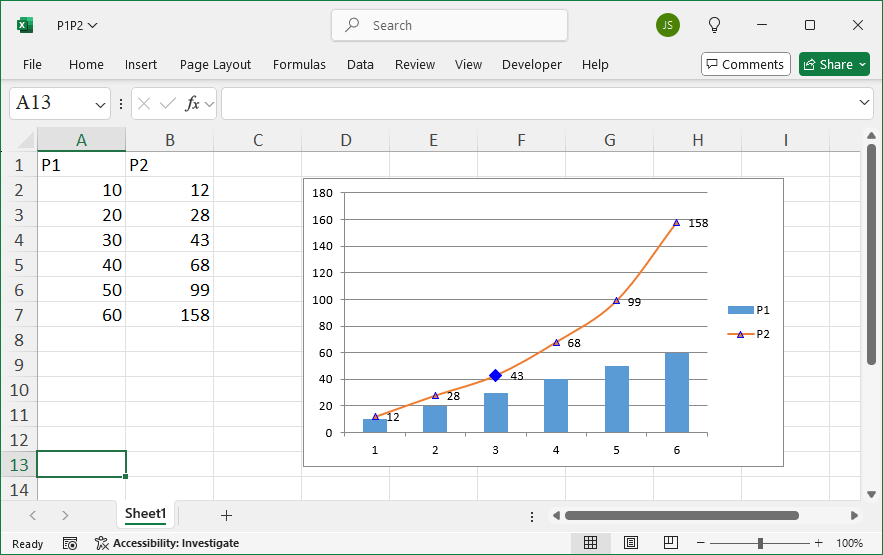
Leave a Reply