Method
Each Chart object has a `SeriesCollection` property, which returns a collection containing all series in the chart. What is a series? In a composite bar chart, each row of data corresponds to a composite bar, and within each composite bar, there are two different-colored individual bars. All individual bars of the same color form a series. Therefore, the chart has two series. A series is represented by a Series object.
In the example below, the second series is referenced, and its `ChartType` property is used to change the chart type to a line chart. The `Smooth` property is set to `True` to smooth the line. The `MarkerStyle` property is used to set the markers at data points as triangles, and the `MarkerForegroundColor` property sets the marker color to blue. The `HasDataLabel` property is set to `True` to display data labels.
sht.api.Range(‘A1:B7’).Select()
cht=sht.api.Shapes.AddChart().Chart
ser2=cht.SeriesCollection(‘P2’) #Second series
ser2.ChartType=xw.constants.ChartType.xlLine #Line chart
ser2.Smooth=True #Smooth processing
ser2.MarkerStyle=xw.constants.MarkerStyle.xlMarkerStyleTriangle #Markers
ser2.MarkerForegroundColor=xw.utils.rgb_to_int((0,0,255)) #Color
ser2.HasDataLabels=True #Data labels
Sample Code
#Set series

import xlwings as xw
import os

root = os.getcwd()
app = xw.App(visible=True, add_book=False)
wb=app.books.open(root+r'/P1P2.xlsx',read_only=False)
sht=wb.sheets(1)

sht.api.Range('A1:B7').Select()
cht=sht.api.Shapes.AddChart().Chart
ser2=cht.SeriesCollection('P2')    #Second series
ser2.ChartType=xw.constants.ChartType.xlLine    #Line chart
ser2.Smooth=True    #Smooth processing
ser2.MarkerStyle=xw.constants.MarkerStyle.xlMarkerStyleTriangle    #Markers
ser2.MarkerForegroundColor=xw.utils.rgb_to_int((0,0,255))    #Color
ser2.HasDataLabels=True    #Data labels

#wb.save()
#wb.close()
#app.kill()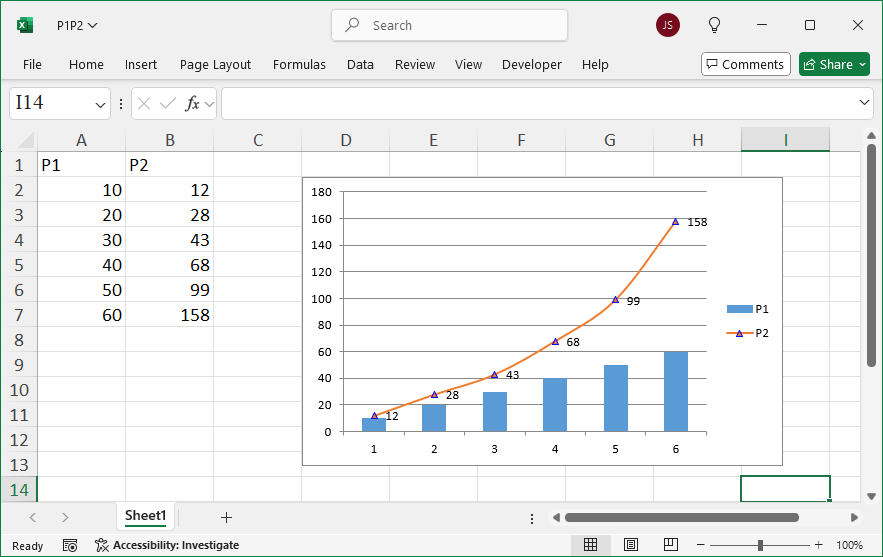
Leave a Reply