Method
To create a chart worksheet (a chart that occupies the entire worksheet), use the `Add` method from the `Charts` collection. The syntax is as follows:
wb.api.Charts.Add(Before,After,Count,Type)
Here, `wb` represents the specified workbook object. The parameters are optional and are explained as follows:
– `Before` – Specifies a worksheet object, and the newly created chart worksheet will be placed before this worksheet.
– `After` – Specifies a worksheet object, and the newly created chart worksheet will be placed after this worksheet.
– `Count` – Specifies the number of chart worksheets to add. The default value is 1.
– `Type` – Specifies the chart type to add.
Note: If both `Before` and `After` are omitted, the newly created chart worksheet will be inserted before the active worksheet.
cht=wb.api.Charts.Add()
cht.SetSourceData(Source=sht.api.Range(“A1:H7”), PlotBy=1)
cht.ChartType=xw.constants.ChartType.xlColumnClustered
cht.HasTitle=True
Sample Code
#Create chart worksheet

import xlwings as xw
import os

root=os.getcwd()
app=xw.App(visible=True, add_book=False)
wb=app.books.open('GDP.xlsx',read_only=False)
sht=wb.sheets('Sheet1')

cht=wb.api.Charts.Add()
cht.SetSourceData(Source=sht.api.Range("A1:H7"), PlotBy=1)
cht.ChartType=xw.constants.ChartType.xlColumnClustered
cht.HasTitle=True

#wb.save()
#wb.close()
#app.kill()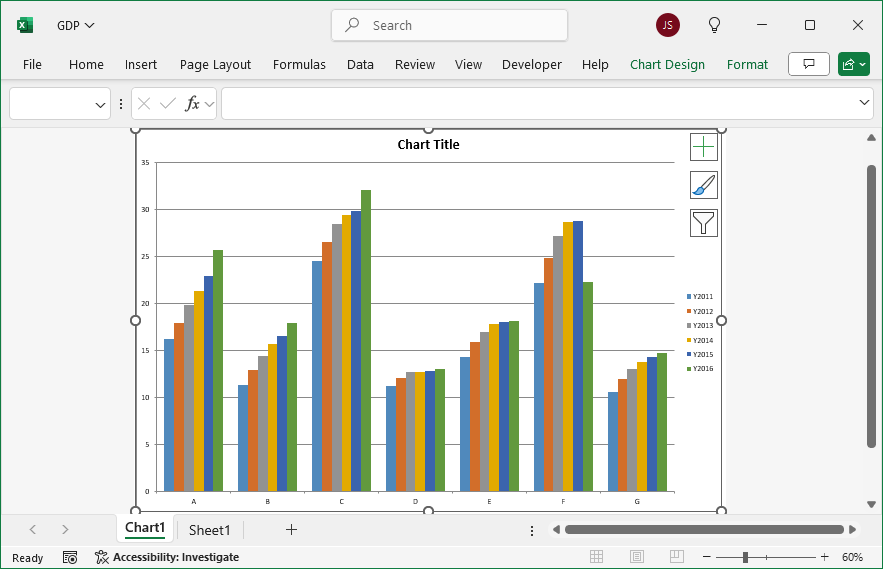
Leave a Reply