Archive

How To Set Built-in Styles for Excel Charts Using xlwings?

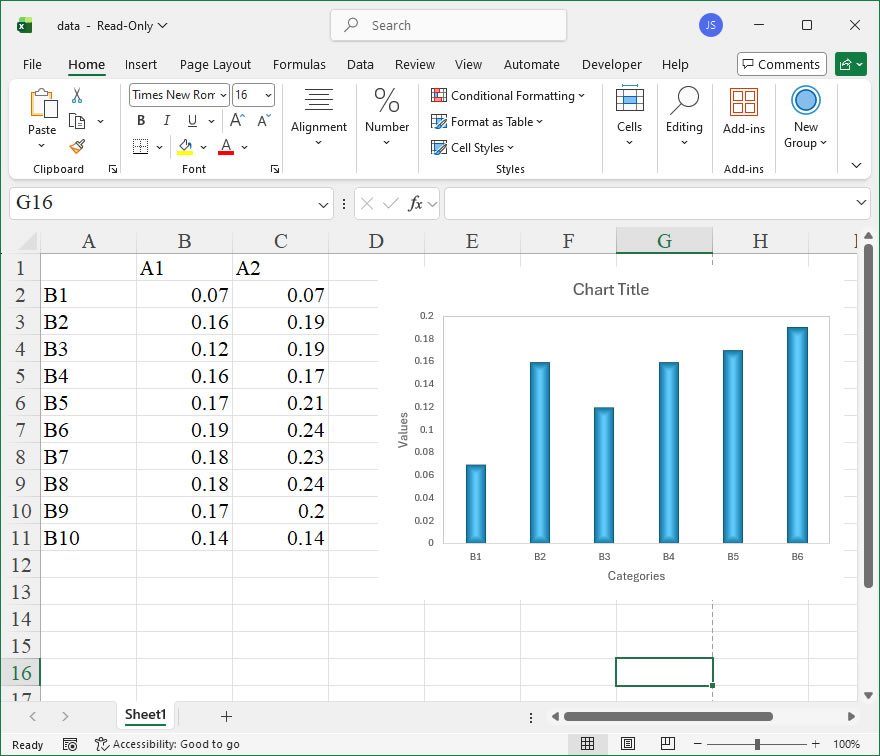
【Example】

【Code】

import xlwings as xw
import os

root=os.getcwd()
app=xw.App(visible=True,add_book=False)
wb=app.books.open(root+r'/data.xlsx',read_only=False)
sht=wb.sheets('Sheet1')

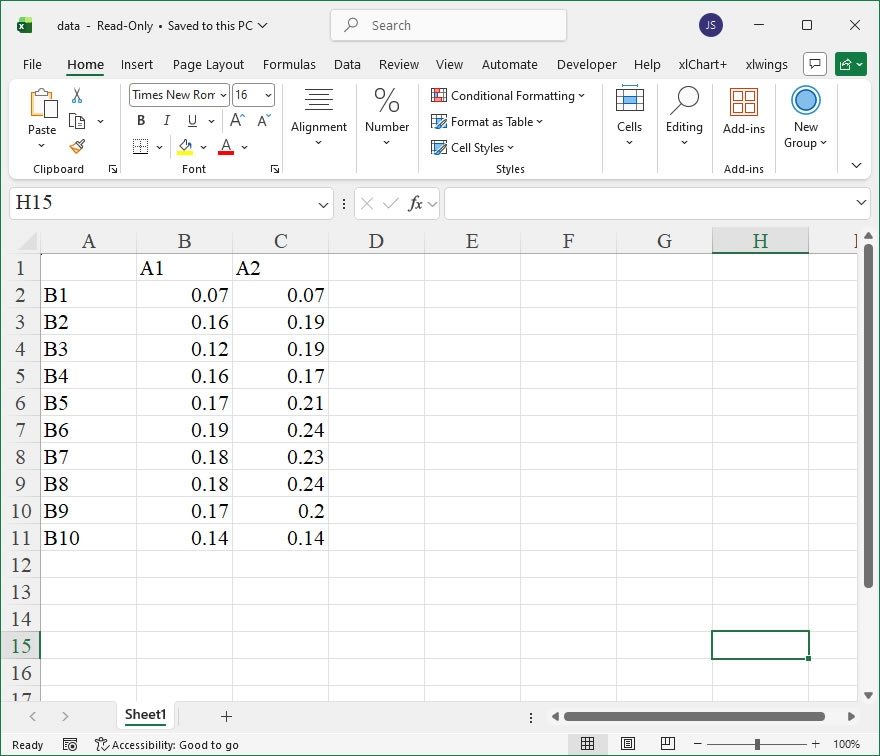
sht.api.Range('A2:C11').Select()  #数据
cht1=sht.api.Shapes.AddChart2(228,xw.constants.ChartType.xlLine,10,20,350,250,True).Chart
cht2=sht.api.Shapes.AddChart2(230,xw.constants.ChartType.xlLine,20,20,350,250,True).Chart
cht3=sht.api.Shapes.AddChart2(232,xw.constants.ChartType.xlLine,30,20,350,250,True).Chart
cht4=sht.api.Shapes.AddChart2(233,xw.constants.ChartType.xlLine,40,20,350,250,True).Chart

cht1.Export(root+'/cht1.jpg')
cht1.Export(root+'/cht1.svg')
cht1.ExportAsFixedFormat(0,root+'/cht1.pdf')

cht2.Export(root+'/cht2.jpg')
cht2.Export(root+'/cht2.svg')
cht2.ExportAsFixedFormat(0,root+'/cht2.pdf')

cht3.Export(root+'/cht3.jpg')
cht3.Export(root+'/cht3.svg')
cht3.ExportAsFixedFormat(0,root+'/cht3.pdf')

cht4.Export(root+'/cht4.jpg')
cht4.Export(root+'/cht4.svg')
cht4.ExportAsFixedFormat(0,root+'/cht4.pdf')

#wb.save()
#app.kill()
How To Set 3D Effects Using xlwings?

【Example】

【Code】

import xlwings as xw
import os

def set_style(cht):
    cht.ChartArea.Format.Line.Visible=False
    cht.PlotArea.Format.Fill.Visible=False
    cht.PlotArea.Format.Line.Visible=True
    cht.PlotArea.Format.Line.ForeColor.RGB=xw.utils.rgb_to_int((200,200,200))
    #cht.PlotArea.Format.Line.ForeColor.ObjectThemeColor = msoThemeColorText1
    ax1=cht.Axes(1)
    ax2=cht.Axes(2)
    ax1.HasTitle=True
    ax1.AxisTitle.Text='Categories'
    ax1.AxisTitle.Font.Size=10
    ax1.TickLabels.Font.Size=8
    #ax1.TickLabels.NumberFormat='0.00'
    ax1.HasMajorGridlines=False
    ax2.HasTitle=True
    ax2.AxisTitle.Text='Values'
    ax2.AxisTitle.Font.Size=10
    ax2.TickLabels.Font.Size=8
    ax2.HasMajorGridlines=False
    cht.HasTitle=True
    #cht.ChartTitle.Caption='Plot'
    #cht.ChartTitle.Font.Size=12

root=os.getcwd()
app=xw.App(visible=True,add_book=False)
wb=app.books.open(root+r'/data.xlsx',read_only=False)
sht=wb.sheets('Sheet1')

sht.api.Range('A2:B7').Select()  #数据
shp=sht.api.Shapes.AddChart2(-1,xw.constants.ChartType.xlColumnClustered,20,20,350,250,True)
cht=shp.Chart  #添加图表
threed=cht.SeriesCollection(1).Format.ThreeD
threed.BevelTopType=3    #msoBevelAngle
threed.BevelTopInset=36
threed.BevelTopDepth=6
threed.PresetMaterial=2    #msoMaterialMetal2
threed.LightAngle=60
threed.PresetLighting=1    #msoLightRigMorning

set_style(cht)

cht.Export(root+'/cht.jpg')
cht.Export(root+'/cht.svg')
cht.ExportAsFixedFormat(0,root+'/cht.pdf')

#wb.save()
#app.kill()

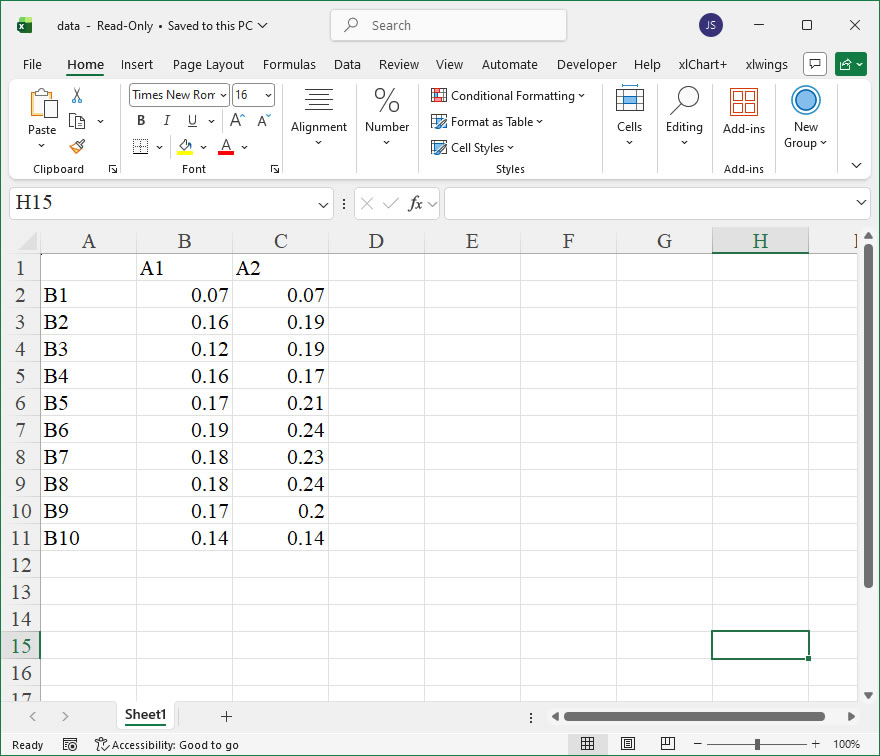
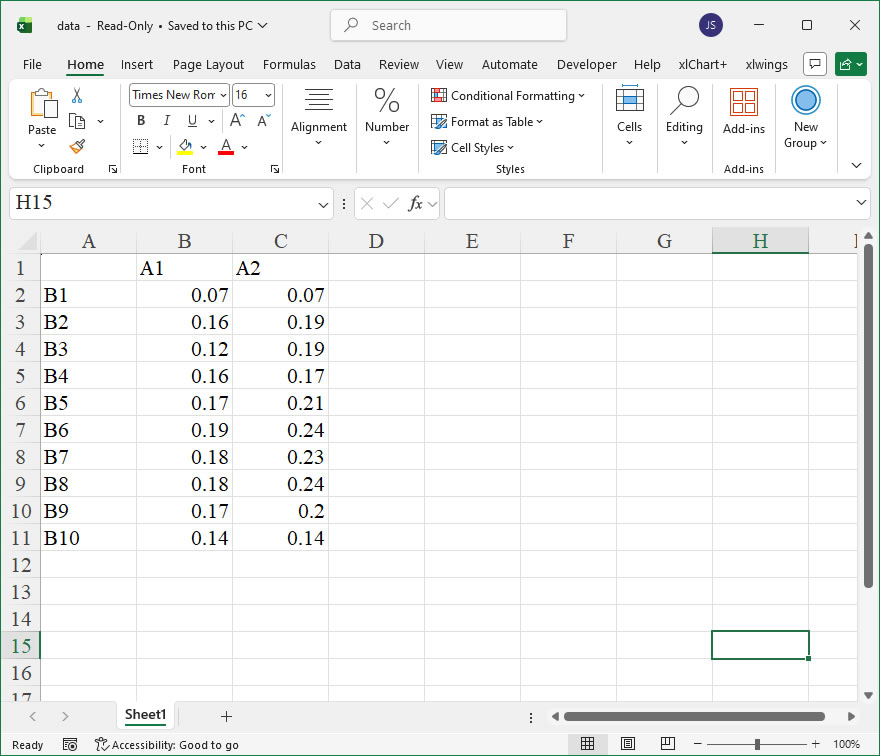
How To Set Edge Softening Using xlwings?

【Example】

【Code】

import xlwings as xw
import os

def set_style(cht):
    cht.ChartArea.Format.Line.Visible=False
    cht.PlotArea.Format.Fill.Visible=False
    cht.PlotArea.Format.Line.Visible=True
    cht.PlotArea.Format.Line.ForeColor.RGB=xw.utils.rgb_to_int((200,200,200))
    #cht.PlotArea.Format.Line.ForeColor.ObjectThemeColor = msoThemeColorText1
    ax1=cht.Axes(1)
    ax2=cht.Axes(2)
    ax1.HasTitle=True
    ax1.AxisTitle.Text='Categories'
    ax1.AxisTitle.Font.Size=10
    ax1.TickLabels.Font.Size=8
    #ax1.TickLabels.NumberFormat='0.00'
    ax1.HasMajorGridlines=False
    ax2.HasTitle=True
    ax2.AxisTitle.Text='Values'
    ax2.AxisTitle.Font.Size=10
    ax2.TickLabels.Font.Size=8
    ax2.HasMajorGridlines=False
    cht.HasTitle=True
    #cht.ChartTitle.Caption='Plot'
    #cht.ChartTitle.Font.Size=12

root=os.getcwd()
app=xw.App(visible=True,add_book=False)
wb=app.books.open(root+r'/data.xlsx',read_only=False)
sht=wb.sheets('Sheet1')

sht.api.Range('A2:B7').Select()  #数据
shp=sht.api.Shapes.AddChart2(-1,xw.constants.ChartType.xlColumnClustered,20,20,350,250,True)
cht=shp.Chart  #添加图表
glow=cht.SeriesCollection(1).Format.Glow
glow.Color.ObjectThemeColor=1    #msoThemeColorAccent1
#glow.Color.TintAndShade=0
glow.Color.Brightness=0
glow.Transparency=0.6000000238
glow.Radius=8

sht.api.Range('A2:C11').Select()  #数据
shp2=sht.api.Shapes.AddChart2(-1,xw.constants.ChartType.xlLine,30,20,350,250,True)
cht2=shp2.Chart  #添加图表
glow2=cht2.SeriesCollection(1).Format.Glow
glow2.Color.ObjectThemeColor=1    #msoThemeColorAccent1
#glow2.Color.TintAndShade=0
glow2.Color.Brightness=0
glow2.Transparency=0.6000000238
glow2.Radius=5
glow3=cht2.SeriesCollection(2).Format.Glow
glow3.Color.ObjectThemeColor=1    #msoThemeColorAccent1
#glow3.Color.TintAndShade=0
glow3.Color.Brightness=0
glow3.Transparency=0.6000000238
glow3.Radius=8

set_style(cht)
set_style(cht2)

cht.Export(root+'/cht.jpg')
cht.Export(root+'/cht.svg')
cht.ExportAsFixedFormat(0,root+'/cht.pdf')
cht2.Export(root+'/cht2.jpg')
cht.Export(root+'/cht2.svg')
cht2.ExportAsFixedFormat(0,root+'/cht2.pdf')

#wb.save()
#app.kill()
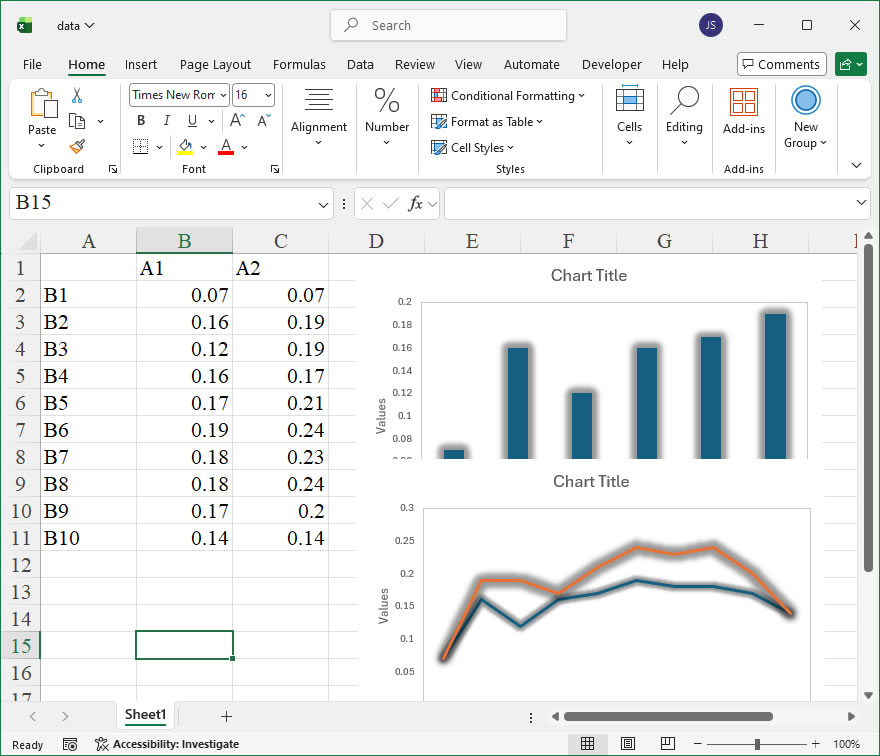
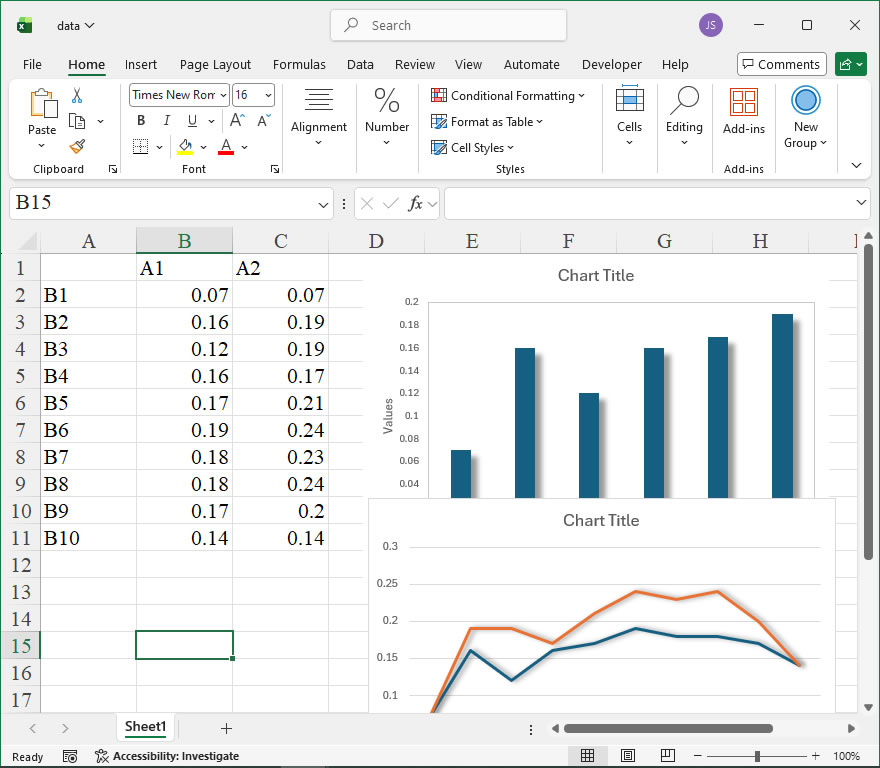
How To Set Effects: Glow Using xlwings?

【Example】

【Code】

import xlwings as xw
import os

def set_style(cht):
    cht.ChartArea.Format.Line.Visible=False
    cht.PlotArea.Format.Fill.Visible=False
    cht.PlotArea.Format.Line.Visible=True
    cht.PlotArea.Format.Line.ForeColor.RGB=xw.utils.rgb_to_int((200,200,200))
    #cht.PlotArea.Format.Line.ForeColor.ObjectThemeColor = msoThemeColorText1
    ax1=cht.Axes(1)
    ax2=cht.Axes(2)
    ax1.HasTitle=True
    ax1.AxisTitle.Text='Categories'
    ax1.AxisTitle.Font.Size=10
    ax1.TickLabels.Font.Size=8
    #ax1.TickLabels.NumberFormat='0.00'
    ax1.HasMajorGridlines=False
    ax2.HasTitle=True
    ax2.AxisTitle.Text='Values'
    ax2.AxisTitle.Font.Size=10
    ax2.TickLabels.Font.Size=8
    ax2.HasMajorGridlines=False
    cht.HasTitle=True
    #cht.ChartTitle.Caption='Plot'
    #cht.ChartTitle.Font.Size=12

root=os.getcwd()
app=xw.App(visible=True,add_book=False)
wb=app.books.open(root+r'/data.xlsx',read_only=False)
sht=wb.sheets('Sheet1')

sht.api.Range('A2:B7').Select()  #数据
shp=sht.api.Shapes.AddChart2(-1,xw.constants.ChartType.xlColumnClustered,20,20,350,250,True)
cht=shp.Chart  #添加图表
shadow=cht.SeriesCollection(1).Format.Shadow
shadow.Type=21
shadow.Visible=True
shadow.Style=2    #msoShadowStyleOuterShadow
shadow.Blur=4
shadow.OffsetX=4.9497474683
shadow.OffsetY=4.9497474683
shadow.RotateWithShape=False
shadow.ForeColor.RGB=xw.utils.rgb_to_int((0,0,0))
shadow.Transparency=0.599999994
shadow.Size=100

sht.api.Range('A2:C11').Select()  #数据
shp2=sht.api.Shapes.AddChart2(-1, xw.constants.ChartType.xlLine, 30, 20, 350, 250, True)
cht2=shp2.Chart  #添加图表
cht2.SeriesCollection(1).Format.Shadow.Type=24
cht2.SeriesCollection(2).Format.Shadow.Type=24

set_style(cht)

cht.Export(root+'/cht.jpg')
cht.Export(root+'/cht.svg')
cht.ExportAsFixedFormat(0,root+'/cht.pdf')
cht2.Export(root+'/cht2.jpg')
cht2.Export(root+'/cht2.svg')
cht2.ExportAsFixedFormat(0,root+'/cht2.pdf')

#wb.save()
#app.kill()
How To Set Picture/Texture Fill for Areas Using xlwings?

【Method】

FillFormat object

  • UserPicture method
  • UserTextured method

sht.api.Range(‘A1:B7’).Select()

cht=sht.api.Shapes.AddChart().Chart

ser=cht.SeriesCollection(‘P1’)      #First series

ff=ser.Format.Fill

ff.UserPicture(root+r’/picpy.jpg’)

ser2=cht.SeriesCollection(‘P2’)      #Second series

ff2=ser2.Format.Fill

ff2.UserTextured(root+r’/picpy2.jpg’)

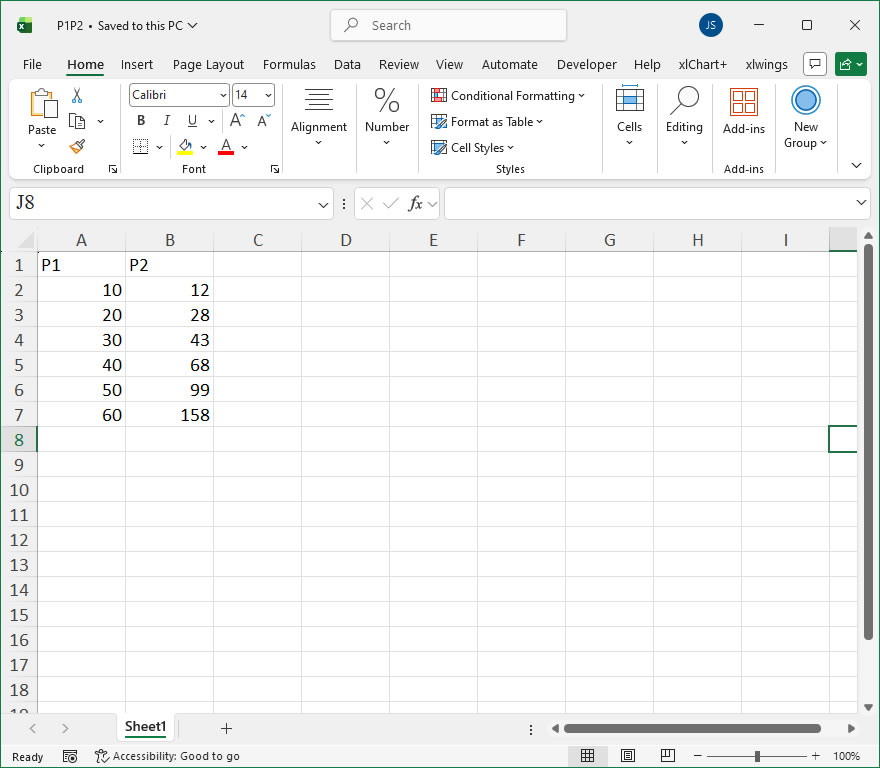
【Example】

【Code】

#Area settings - Picture and texture fill

import xlwings as xw
import os

root = os.getcwd()
app = xw.App(visible=True, add_book=False)
wb=app.books.open(root+r'/P1P2.xlsx',read_only=False)
sht=wb.sheets(1)

sht.api.Range('A1:B7').Select()
cht=sht.api.Shapes.AddChart().Chart
ser=cht.SeriesCollection('P1')      #First series
ff=ser.Format.Fill
ff.UserPicture(root+r'/picpy.jpg')
ser2=cht.SeriesCollection('P2')      #Second series
ff2=ser2.Format.Fill
ff2.UserTextured(root+r'/picpy2.jpg')

#wb.save()
#wb.close()
#app.kill()

How To Set Pattern Fill for Areas Using xlwings?

【Method】

FillFormat object

  • Patterned method

sht.api.Range(‘A1:B7’).Select()

cht=sht.api.Shapes.AddChart().Chart

ser=cht.SeriesCollection(‘P1’)      #First series

ff=ser.Format.Fill

ff.ForeColor.RGB=xw.utils.rgb_to_int((0,0,255))

ff.Patterned(43)

ser2=cht.SeriesCollection(‘P2’)      #Second series

ff2=ser2.Format.Fill

ff2.ForeColor.RGB=xw.utils.rgb_to_int((255,0,0))

ff2.TwoColorGradient(1,1)

ff2.BackColor.RGB=xw.utils.rgb_to_int((255,255,0))

【Example】

【Code】

#Area settings - Two-color gradient and pattern fill

import xlwings as xw
import os

root = os.getcwd()
app = xw.App(visible=True, add_book=False)
wb=app.books.open(root+r'/P1P2.xlsx',read_only=False)
sht=wb.sheets(1)

sht.api.Range('A1:B7').Select()
cht=sht.api.Shapes.AddChart().Chart
ser=cht.SeriesCollection('P1')      #First series
ff=ser.Format.Fill
ff.ForeColor.RGB=xw.utils.rgb_to_int((0,0,255))
ff.Patterned(43)
ser2=cht.SeriesCollection('P2')      #Second series
ff2=ser2.Format.Fill
ff2.ForeColor.RGB=xw.utils.rgb_to_int((255,0,0))
ff2.TwoColorGradient(1,1)
ff2.BackColor.RGB=xw.utils.rgb_to_int((255,255,0))

#wb.save()
#wb.close()
#app.kill()

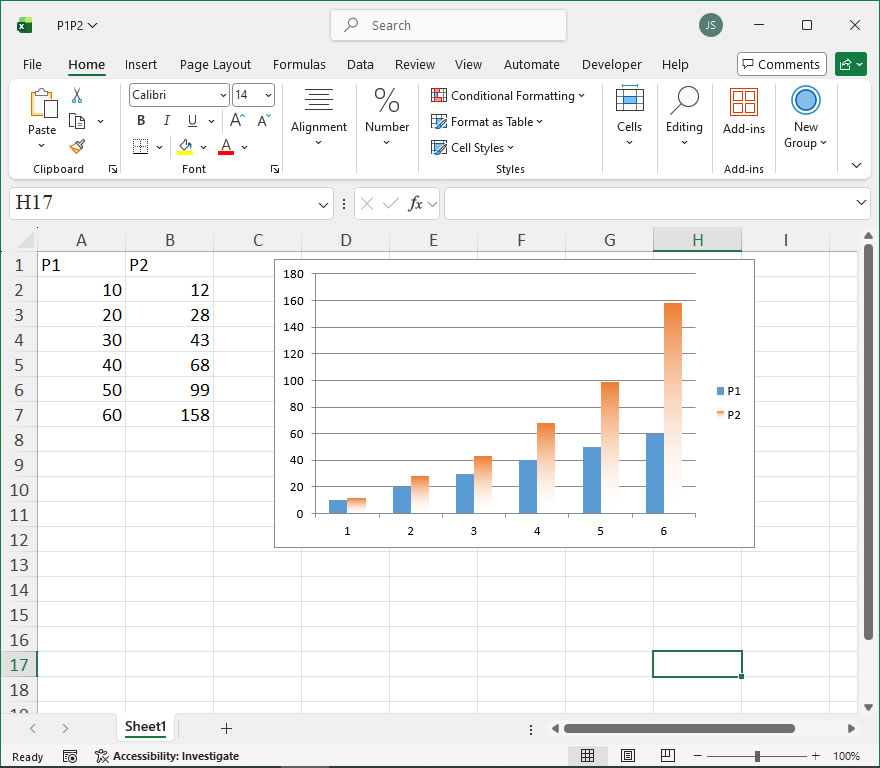
How To Set Transparency and Color Fill of Areas Using xlwings?

【Method】

By referencing the `Format.Fill` property of the Series object, a `FillFormat` object is returned, representing the area object in the series. The members of the `FillFormat` object can be used to set properties for the area object.

– Transparency property

– ForeColor property

– OneColorGradient method

– TwoColorGradient method

– Solid method

sht.api.Range(‘A1:B7’).Select()

cht=sht.api.Shapes.AddChart().Chart

ser=cht.SeriesCollection(‘P1’)    #First series

ff=ser.Format.Fill

ff.Transparency=0.7

ser2=cht.SeriesCollection(‘P2’)    #Second series

ff2=ser2.Format.Fill

ff2.OneColorGradient(1,1,1)

【Example】

【Code】

#Area settings - Transparency and solid gradient

import xlwings as xw
import os

root = os.getcwd()
app = xw.App(visible=True, add_book=False)
wb=app.books.open(root+r'/P1P2.xlsx',read_only=False)
sht=wb.sheets(1)

sht.api.Range('A1:B7').Select()
cht=sht.api.Shapes.AddChart().Chart
ser=cht.SeriesCollection('P1')    #First series
ff=ser.Format.Fill
ff.Transparency=0.7
ser2=cht.SeriesCollection('P2')    #Second series
ff2=ser2.Format.Fill
ff2.OneColorGradient(1,1,1)

#wb.save()
#wb.close()
#app.kill()

How To Set Properties of Line Graphic Elements Using xlwings?

【Method】

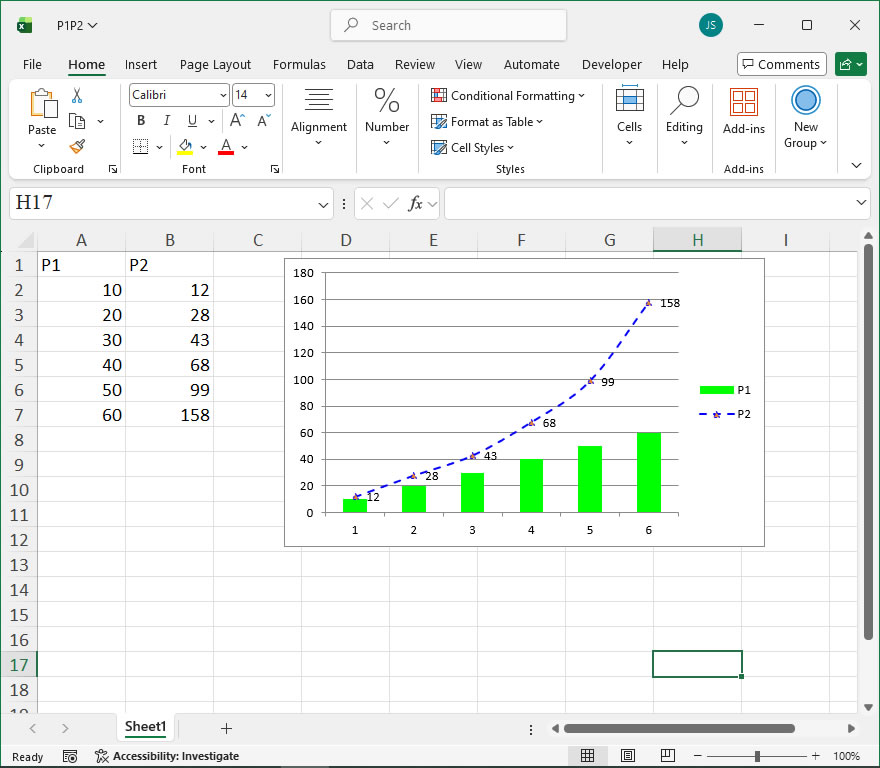
By referencing the `Format.Line` property of a Series object, a `LineFormat` object is returned, representing the line object in the series. The members of the `LineFormat` object are used to set the line properties.

sht.api.Range(‘A1:B7’).Select()

cht=sht.api.Shapes.AddChart().Chart

ser2=cht.SeriesCollection(‘P2’)    #Second series

ser2.ChartType=xw.constants.ChartType.xlLine    #Line chart

ser2.Smooth=True    #Smooth processing

ser2.MarkerStyle=xw.constants.MarkerStyle.xlMarkerStyleTriangle    #Markers

ser2.MarkerForegroundColor=xw.utils.rgb_to_int((0,0,255))    #Color

ser2.HasDataLabels=True    #Data labels

【Example】

  
【Code】

#Line chart element settings

import xlwings as xw
import os

root = os.getcwd()
app = xw.App(visible=True, add_book=False)
wb=app.books.open(root+r'/P1P2.xlsx',read_only=False)
sht=wb.sheets(1)

sht.api.Range('A1:B7').Select()
cht=sht.api.Shapes.AddChart().Chart
ser2=cht.SeriesCollection('P2')    #Second series
ser2.ChartType=xw.constants.ChartType.xlLine    #Line chart
ser2.Smooth=True    #Smooth processing
ser2.MarkerStyle=xw.constants.MarkerStyle.xlMarkerStyleTriangle    #Markers
ser2.MarkerForegroundColor=xw.utils.rgb_to_int((0,0,255))    #Color
ser2.HasDataLabels=True    #Data labels
ser=cht.SeriesCollection('P1')
ser.Format.Fill.ForeColor.RGB=xw.utils.rgb_to_int((0,255,0))
ser.Format.Fill.ForeColor.ObjectThemeColor=10
ser.Format.Fill.ForeColor.SchemeColor=3
ser2.Format.Line.DashStyle=4
ser2.Format.Line.ForeColor.RGB=xw.utils.rgb_to_int((0,0,255))

#wb.save()
#wb.close()
#app.kill()

How To Set Chart Colors Using xlwings?

【Method】

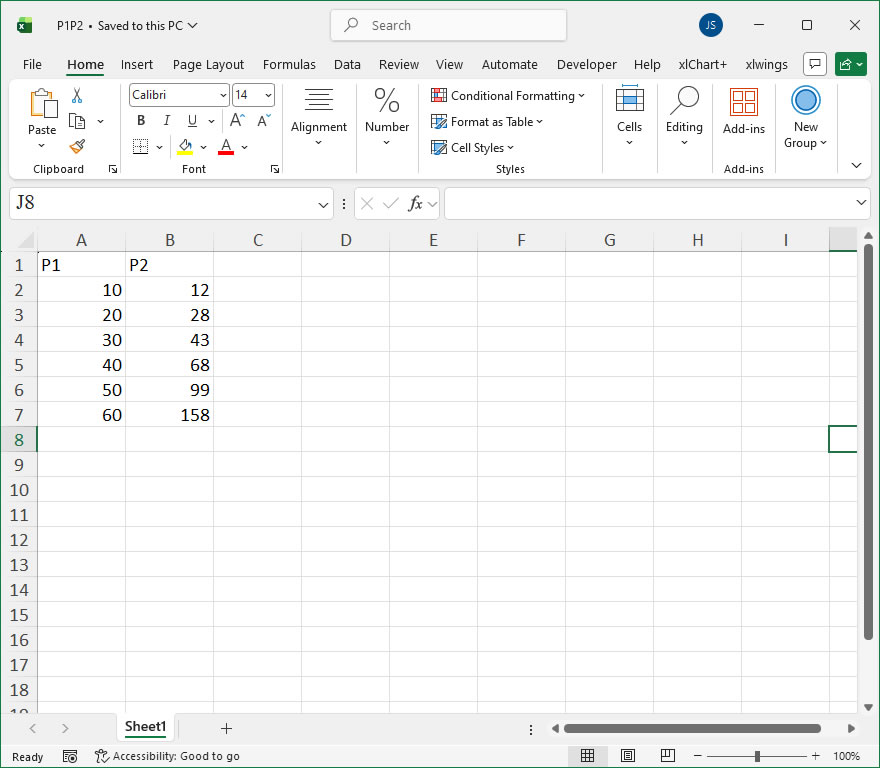
sht.api.Range(‘A1:B7’).Select()

cht=sht.api.Shapes.AddChart().Chart

ser2=cht.SeriesCollection(‘P2’)    #Second series

ser2.ChartType=xw.constants.ChartType.xlLine    #Line chart

ser2.Smooth=True    #Smooth processing

ser2.MarkerStyle=xw.constants.MarkerStyle.xlMarkerStyleTriangle    #Markers

ser2.MarkerForegroundColor=xw.utils.rgb_to_int((0,0,255))    #Color

ser2.HasDataLabels=True    #Data labels

ser=cht.SeriesCollection(‘P1’)

ser.Format.Fill.ForeColor.RGB=xw.utils.rgb_to_int((0,255,0))

ser.Format.Fill.ForeColor.ObjectThemeColor=10

ser.Format.Fill.ForeColor.SchemeColor=3

【Example】

 
【Code】

#Color Settings

import xlwings as xw
import os

root = os.getcwd()
app = xw.App(visible=True, add_book=False)
wb=app.books.open(root+r'/P1P2.xlsx',read_only=False)
sht=wb.sheets(1)

sht.api.Range('A1:B7').Select()
cht=sht.api.Shapes.AddChart().Chart
ser2=cht.SeriesCollection('P2')    #Second series
ser2.ChartType=xw.constants.ChartType.xlLine    #Line chart
ser2.Smooth=True    #Smooth processing
ser2.MarkerStyle=xw.constants.MarkerStyle.xlMarkerStyleTriangle    #Markers
ser2.MarkerForegroundColor=xw.utils.rgb_to_int((0,0,255))    #Color
ser2.HasDataLabels=True    #Data labels
ser=cht.SeriesCollection('P1')
ser.Format.Fill.ForeColor.RGB=xw.utils.rgb_to_int((0,255,0))
#ser.Format.Fill.ForeColor.ObjectThemeColor=10
#ser.Format.Fill.ForeColor.SchemeColor=3

#wb.save()
#wb.close()
#app.kill()

How To Set Properties of Individual Points in a Series Using xlwings?

Method

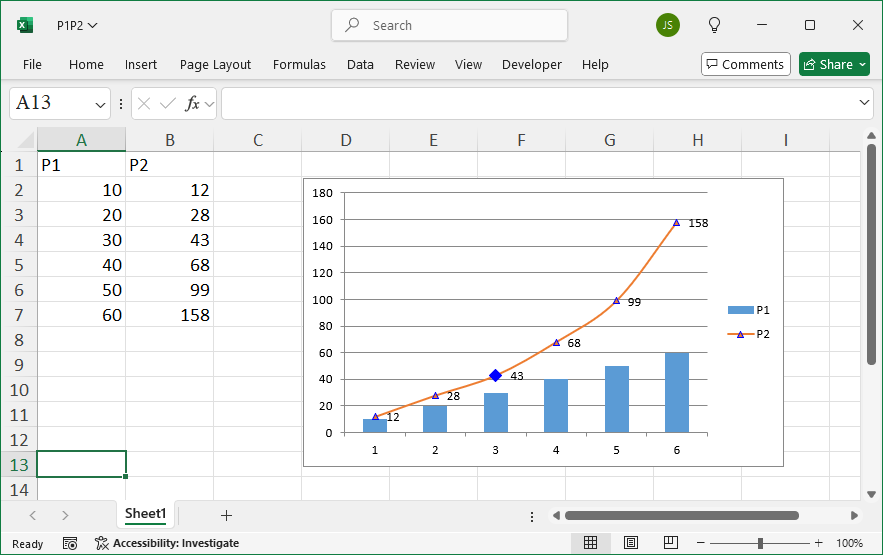
Using the `Points` property of a Series object, you can get all the data points in a series. By using an index, you can extract and set one or more specific points. A single point is represented by a Point object, and its properties and methods can be used to modify the point. This is mainly used for line charts, scatter plots, and radar charts.


In the following example, the properties of the third point in the line chart of series 2 are modified. The foreground and background colors are set to blue, the marker style is changed to a diamond, and the marker size is set to 10.


sht.api.Range(‘A1:B7’).Select()

cht=sht.api.Shapes.AddChart().Chart

ser2=cht.SeriesCollection(‘P2’)    #Second series

ser2.ChartType=xw.constants.ChartType.xlLine    #Line chart

ser2.Smooth=True    #Smooth processing

ser2.MarkerStyle=xw.constants.MarkerStyle.xlMarkerStyleTriangle    #Markers

ser2.MarkerForegroundColor=xw.utils.rgb_to_int((0,0,255))    #Color

ser2.HasDataLabels=True    #Data labels

ser2.Points(3).MarkerForegroundColor=xw.utils.rgb_to_int((0,0,255))

ser2.Points(3).MarkerBackgroundColor=xw.utils.rgb_to_int((0,0,255))

ser2.Points(3).MarkerStyle=xw.constants.MarkerStyle.xlMarkerStyleDiamond

ser2.Points(3).MarkerSize=10

Sample Code

#Set Points in Series

import xlwings as xw
import os

root = os.getcwd()
app = xw.App(visible=True, add_book=False)
wb=app.books.open(root+r'/P1P2.xlsx',read_only=False)
sht=wb.sheets(1)

sht.api.Range('A1:B7').Select()
cht=sht.api.Shapes.AddChart().Chart
ser2=cht.SeriesCollection('P2')    #Second series
ser2.ChartType=xw.constants.ChartType.xlLine    #Line chart
ser2.Smooth=True    #Smooth processing
ser2.MarkerStyle=xw.constants.MarkerStyle.xlMarkerStyleTriangle    #Markers
ser2.MarkerForegroundColor=xw.utils.rgb_to_int((0,0,255))    #Color
ser2.HasDataLabels=True    #Data labels
ser2.Points(3).MarkerForegroundColor=xw.utils.rgb_to_int((0,0,255))
ser2.Points(3).MarkerBackgroundColor=xw.utils.rgb_to_int((0,0,255))
ser2.Points(3).MarkerStyle=xw.constants.MarkerStyle.xlMarkerStyleDiamond
ser2.Points(3).MarkerSize=10

#wb.save()
#wb.close()
#app.kill()
Set Properties of Individual Points in a Series Using xlwings