【Method】
By referencing the `Format.Line` property of a Series object, a `LineFormat` object is returned, representing the line object in the series. The members of the `LineFormat` object are used to set the line properties.
sht.api.Range(‘A1:B7’).Select()
cht=sht.api.Shapes.AddChart().Chart
ser2=cht.SeriesCollection(‘P2’) #Second series
ser2.ChartType=xw.constants.ChartType.xlLine #Line chart
ser2.Smooth=True #Smooth processing
ser2.MarkerStyle=xw.constants.MarkerStyle.xlMarkerStyleTriangle #Markers
ser2.MarkerForegroundColor=xw.utils.rgb_to_int((0,0,255)) #Color
ser2.HasDataLabels=True #Data labels
【Example】
【Code】
#Line chart element settings
import xlwings as xw
import os
root = os.getcwd()
app = xw.App(visible=True, add_book=False)
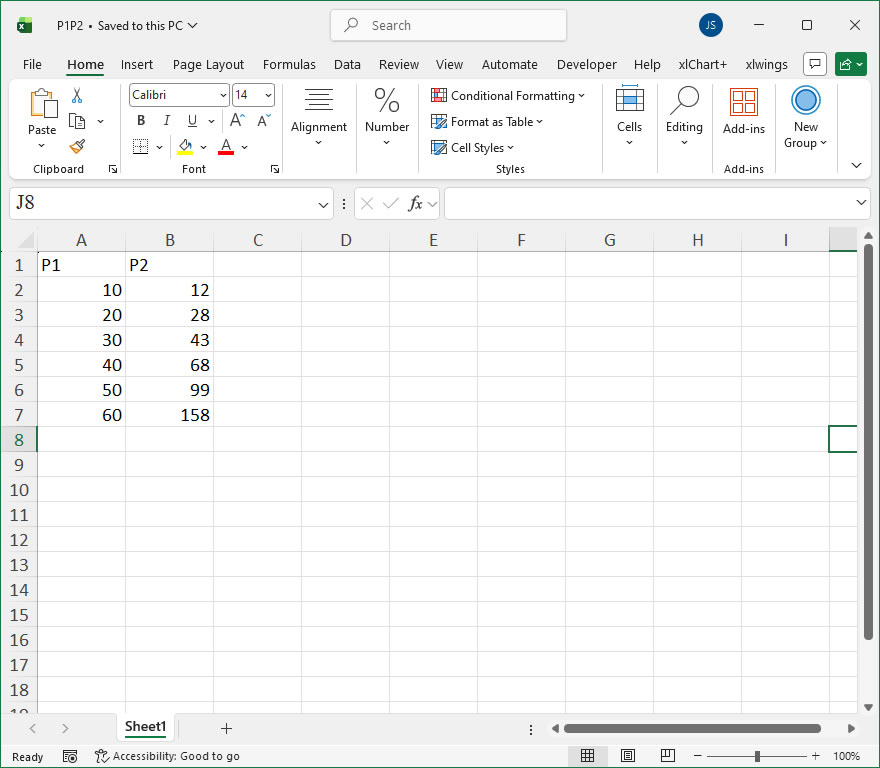
wb=app.books.open(root+r'/P1P2.xlsx',read_only=False)
sht=wb.sheets(1)
sht.api.Range('A1:B7').Select()
cht=sht.api.Shapes.AddChart().Chart
ser2=cht.SeriesCollection('P2') #Second series
ser2.ChartType=xw.constants.ChartType.xlLine #Line chart
ser2.Smooth=True #Smooth processing
ser2.MarkerStyle=xw.constants.MarkerStyle.xlMarkerStyleTriangle #Markers
ser2.MarkerForegroundColor=xw.utils.rgb_to_int((0,0,255)) #Color
ser2.HasDataLabels=True #Data labels
ser=cht.SeriesCollection('P1')
ser.Format.Fill.ForeColor.RGB=xw.utils.rgb_to_int((0,255,0))
ser.Format.Fill.ForeColor.ObjectThemeColor=10
ser.Format.Fill.ForeColor.SchemeColor=3
ser2.Format.Line.DashStyle=4
ser2.Format.Line.ForeColor.RGB=xw.utils.rgb_to_int((0,0,255))
#wb.save()
#wb.close()
#app.kill()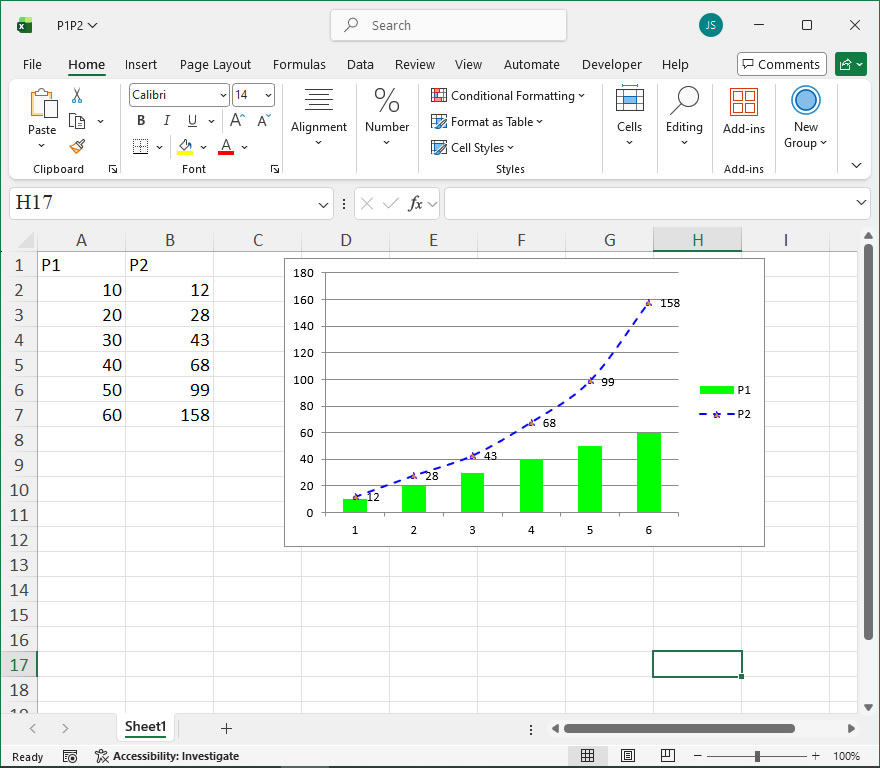
Leave a Reply