The **ScaleType** property of the **Axis** object returns or sets the scale type for the value axis, as shown in the table below. When the **ScaleType** property is set to `xw.constants.ScaleType.xlScaleLogarithmic`, the axis uses a logarithmic scale, allowing you to create a logarithmic scale chart.
The **AxisGroup** property of the **Series** object is used to assign a series to either the primary axis (when the value is 1) or the secondary axis (when the value is 2).
– Set up the axes
You can access the **Axis** object through the **Chart** object with the following syntax:
axs=cht.Axes(Type,AxisGroup)
Where `cht` is the **Chart** object. The **Type** parameter indicates the type of axis. A value of 1 means a category axis, while 2 means a value axis. The **AxisGroup** parameter specifies whether the axis is primary (1) or secondary (2). By default, the primary axis is displayed on the left, and the secondary axis is displayed on the right. This allows the creation of a dual-axis chart, where two charts are overlaid using the same horizontal axis and different vertical axes.
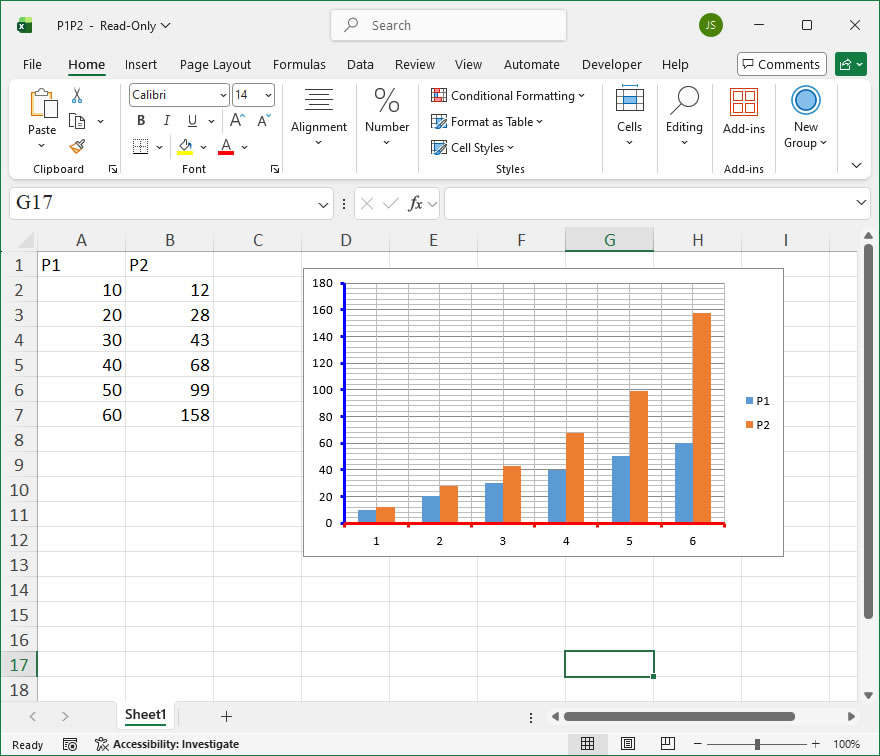
Gridlines are represented by the **Gridlines** object. You can use its **Border** or **Format** properties to set the gridline color, line style, width, and other attributes. The **MajorGridlines** and **MinorGridlines** properties of the **Axis** object return **Gridlines** objects for the major and minor gridlines, respectively. Before setting these properties, the **HasMajorGridlines** and/or **HasMinorGridlines** properties of the **Axis** object must be set to `True`.
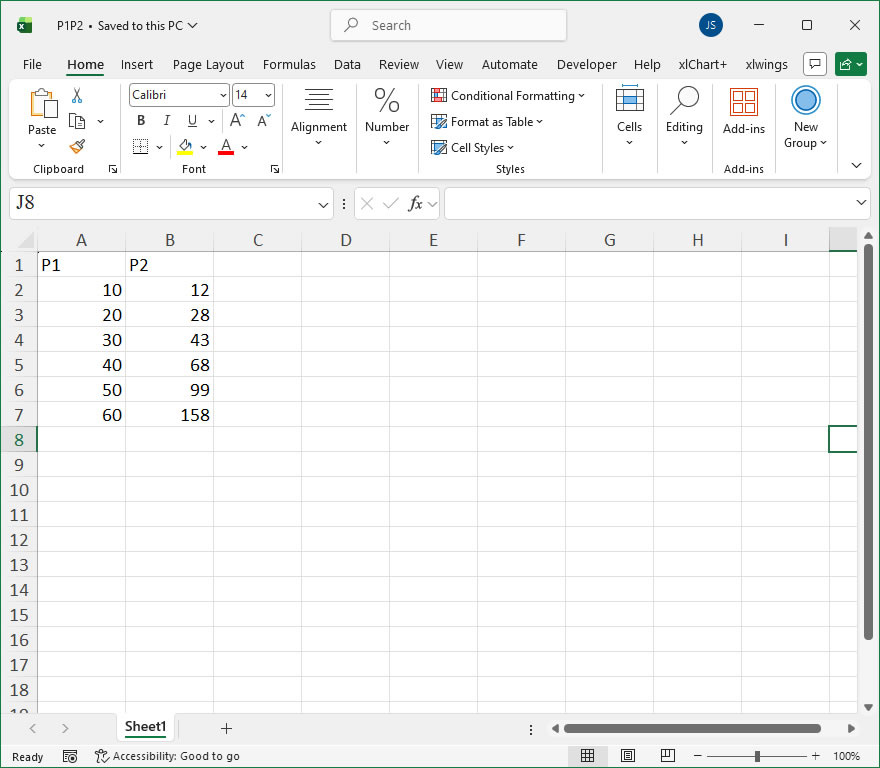
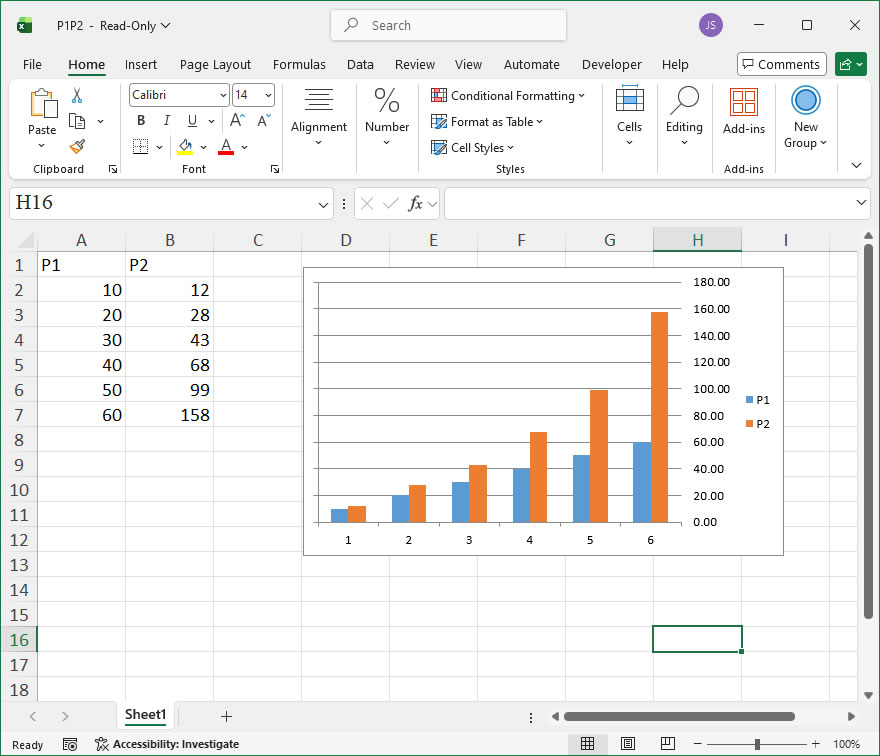
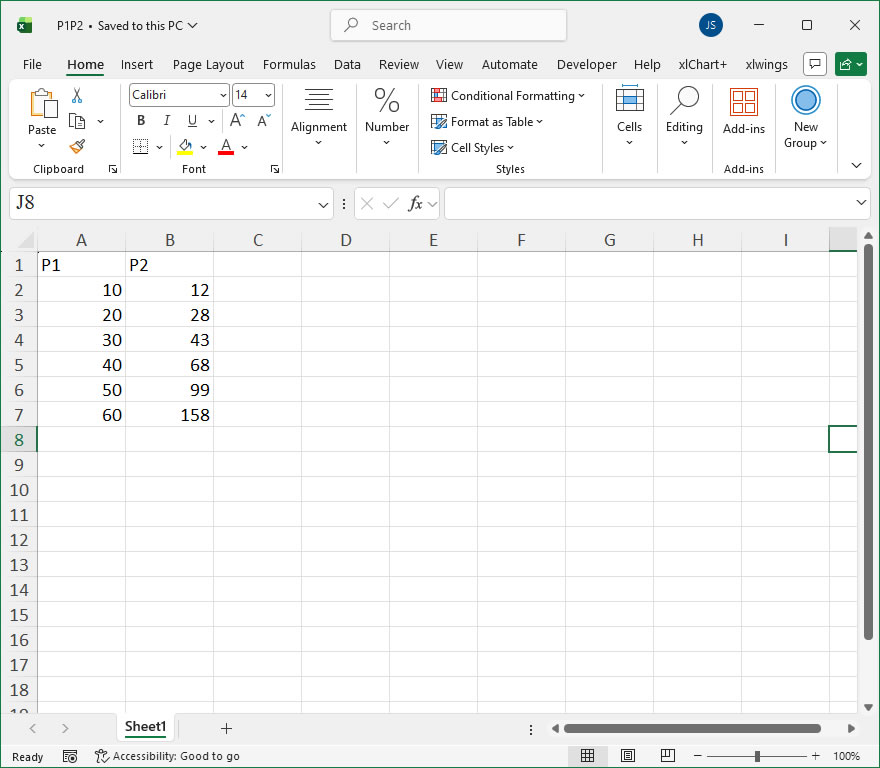
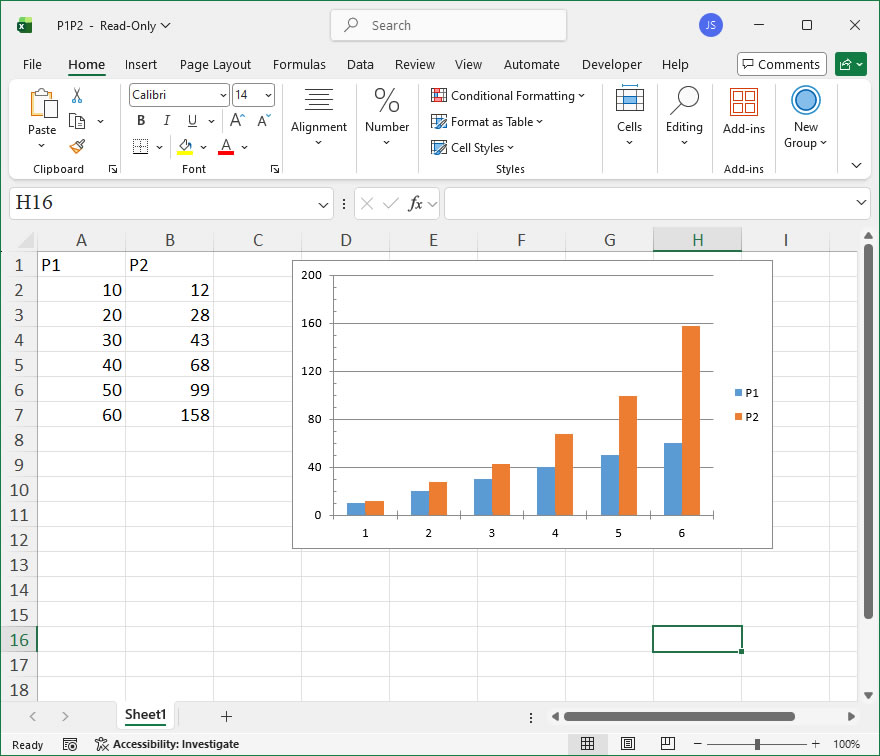
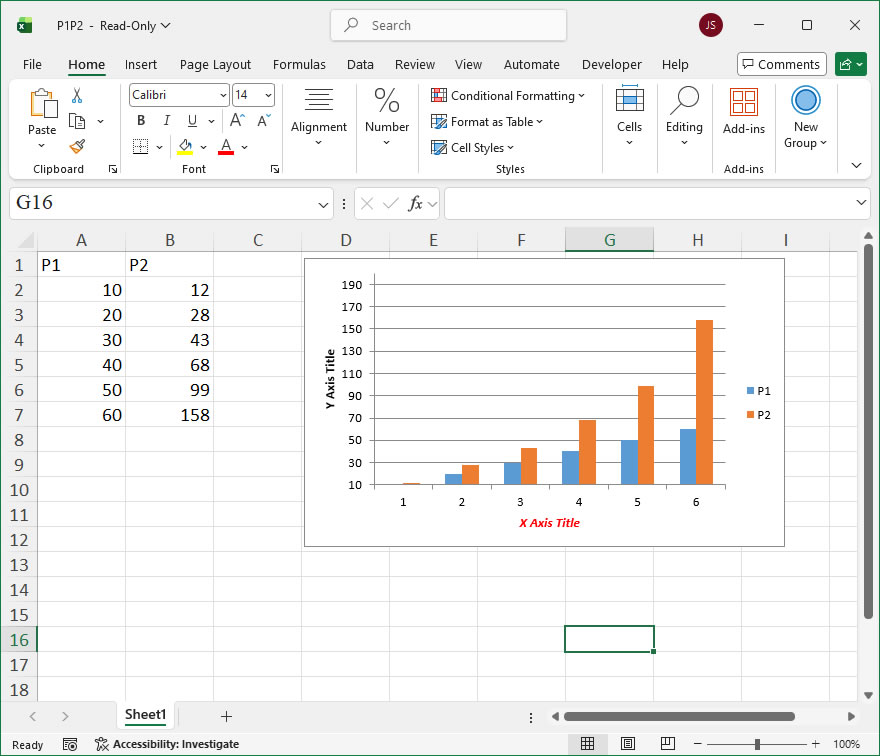
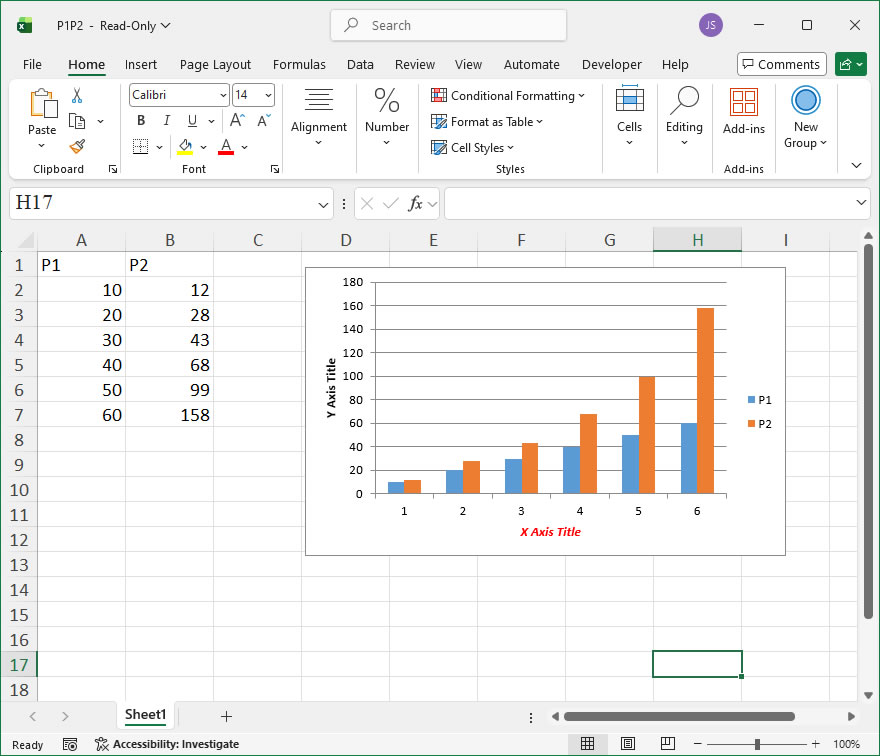
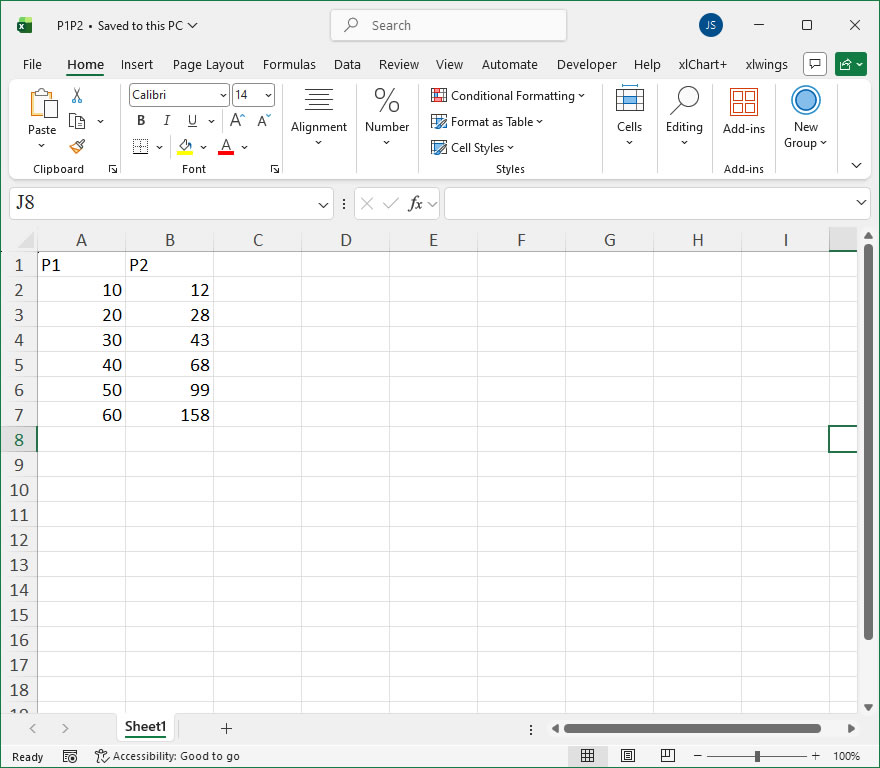
sht.api.Range(‘A1:B7’).Select() #Data
cht=sht.api.Shapes.AddChart().Chart #Add chart
axs=cht.Axes(1) #Horizontal axis
axs2=cht.Axes(2) #Vertical axis
axs.HasMajorGridlines=True #Show major gridlines for horizontal axis
The text labels corresponding to the positions of the major tick marks on the axis are called **tick labels**. These labels annotate the values or categories corresponding to the major tick marks.
For a category axis, the text of the tick labels represents the names of the associated categories in the chart. By default, the tick labels for a category axis are numbers, which start from 1 and increase in order from left to right. The **TickLabelSpacing** property can be used to set how many categories are displayed before a tick label is shown.
For a value axis, the text labels correspond to the major unit, minimum scale, and maximum scale properties of the axis. To change the tick label text for a value axis, you need to modify the values of these properties.
The **TickLabels** property of the **Axis** object returns a **TickLabels** object that represents the tick labels on the axis. By using the properties and methods of the **TickLabels** object, you can set various properties of the tick labels, such as font, number format, display direction, offset, and alignment.
Use the **TickLabelPosition** property to specify the position of the tick labels on the axis. The values for this property are constants or values as listed in the table below:
Name
Value
Description
xlTickLabelPositionHigh
-4127
Top or right side of the chart
xlTickLabelPositionLow
-4134
Bottom or left side of the chart
xlTickLabelPositionNextToAxis
4
Next to the axis (where the axis is not at any side of the chart)
xlTickLabelPositionNone
-4142
No tick labels
The **TickLabelSpacing** property allows you to return or set the number of categories or data series between each tick label. This property is only applicable for category axes and series axes and can be set to a value between 1 and 31999.
When the **TickLabelSpacingIsAuto** property is set to `True`, Excel will automatically adjust the spacing of the tick labels.
Tick marks are short lines on the axis used to help determine the position of data points on the chart. There are major and minor tick marks. Use the **MajorTickMark** and **MinorTickMark** properties of the **Axis** object to set the major and minor tick marks.
The possible values for **MajorTickMark** and **MinorTickMark** are as follows:
Name
Value
Description
xlTickMarkCross
4
Across the axis
xlTickMarkInside
2
Inside the axis
xlTickMarkNone
-4142
No marker
xlTickMarkOutside
3
Outside the axis
Use the **TickMarkSpacing** property to return or set the spacing of major tick marks, indicating how often a major tick mark is displayed for every set of data points. This is only applicable for category axes and series axes and can be a value between 1 and 31999.
Use the **MajorUnit** and **MinorUnit** properties to set the units for the major and minor tick marks on the value axis.
Set **MajorUnitIsAuto** and **MinorUnitIsAuto** properties to `True` to have Excel automatically calculate the major and minor tick units for the value axis.
For the vertical axis (which is a value axis), use the **MinimumScale** and **MaximumScale** properties of the vertical axis object to set the minimum and maximum values for the value axis.
Use the **HasTitle** property of the **Axis** object to set whether the axis title is displayed, and the **AxisTitle** property to set the text content of the axis title. Note that the **HasTitle** property must be set to `True` before the **AxisTitle** property can be set. The **AxisTitle** property returns an **AxisTitle** object, which you can use to set the title text and font for the axis.
In Excel, the **Axis** object represents a single axis, and its plural form, the **Axes** object, represents multiple axes and the coordinate system they form. For a 2D coordinate system, there are horizontal and vertical axes; for a 3D coordinate system, there are axes in three directions.
To access the **Axis** object using the API, the syntax is as follows:
axs=cht.Axes(Type,AxisGroup)
Where `cht` is the **Chart** object, and the two parameters are:
– **Type** – A required parameter, with values 1, 2, or 3. When `Type = 1`, the axis displays categories (usually for the horizontal axis in a chart); when `Type = 2`, the axis displays values (usually for the vertical axis); when `Type = 3`, the axis displays data series (only used for 3D charts).
– **AxisGroup** – An optional parameter that specifies whether the axis is primary or secondary. If set to 2, it means the axis is a secondary axis. If set to 1, it means the axis is a primary axis.
You can use the **Chart** object’s **Axes** property to get the horizontal and vertical axes and set their properties. The **Border** property can be used to modify the axis’s color, line style, width, etc.