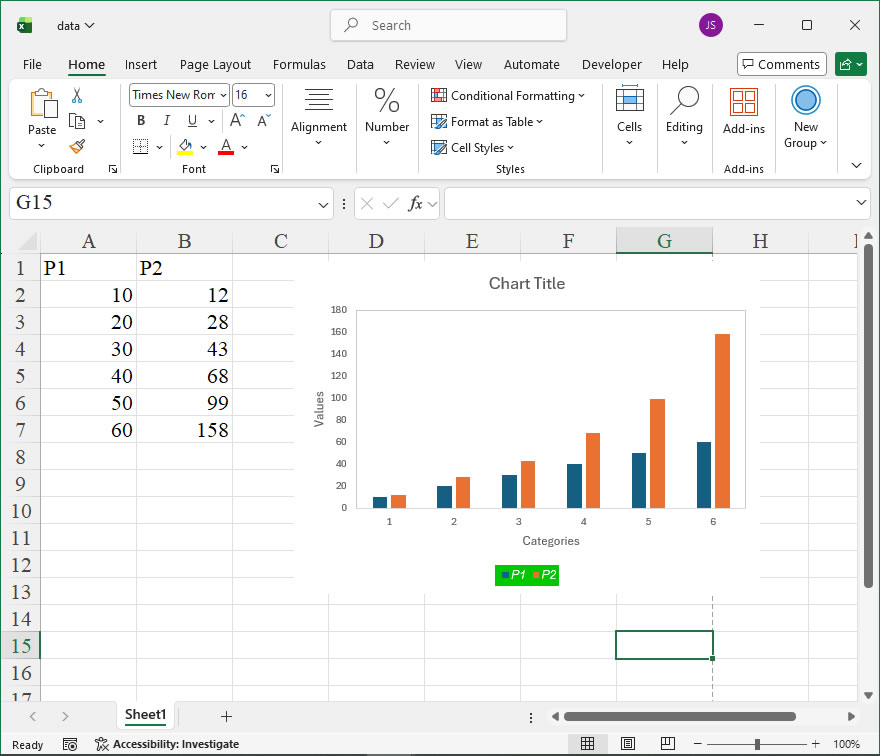
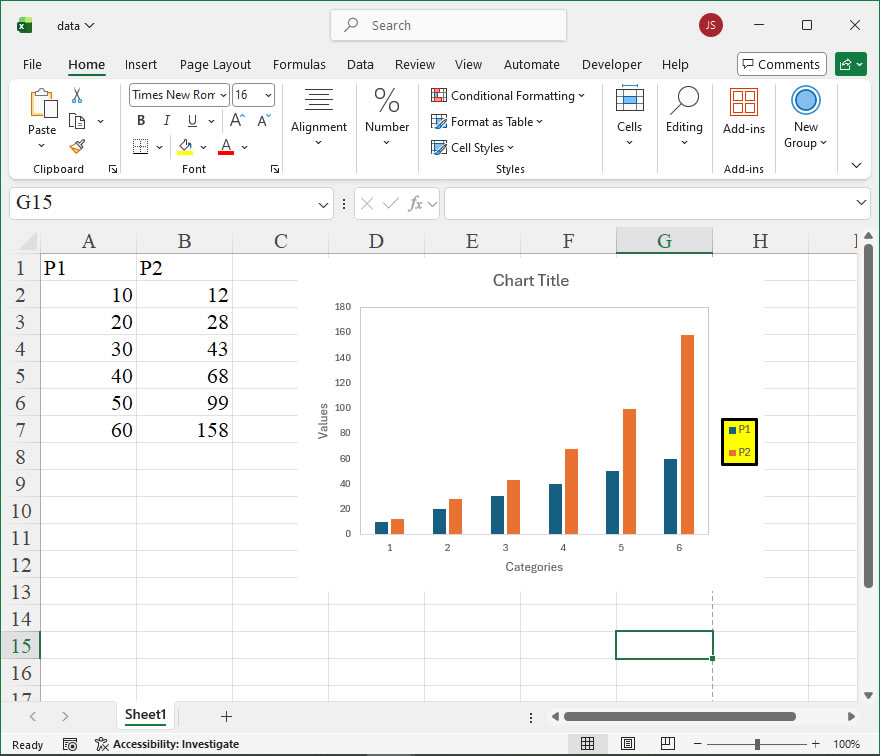
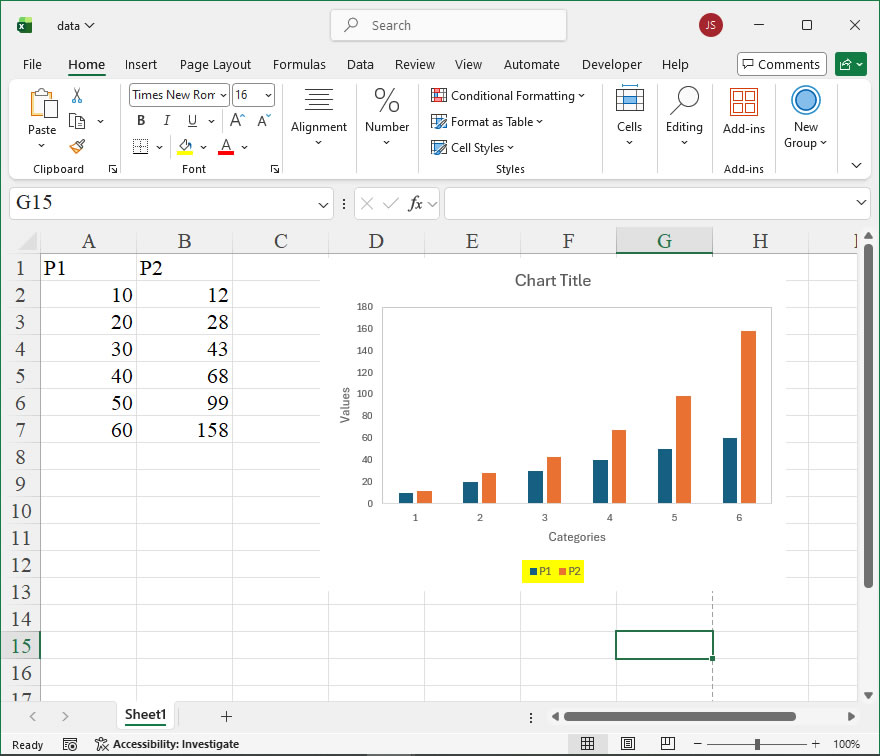
The legend is represented by the `Legend` object. You can use the `HasLegend` property of the `Chart` object to show or hide the legend, and the `Legend` property to return the `Legend` object. Using the properties and methods of the `Legend` object, you can modify the appearance, font, and position of the legend.
The `Format` property of the `Legend` object returns a `ChartFormat` object, which can be used to set the background and border of the legend. The `Font` property returns a `Font` object to set the font. The `Position` property determines the position of the legend. The values for the `Position` property are shown in the table below.
Name
Value
Description
xlLegendPositionBottom
-4107
Display legend at the bottom
xlLegendPositionCorner
2
Display legend at the top-right corner of the chart
xlLegendPositionCustom
-4161
Display legend at a custom position
xlLegendPositionLeft
-4131
Display legend on the left side
xlLegendPositionRight
-4152
Display legend on the right side
xlLegendPositionTop
-4160
Display legend at the top
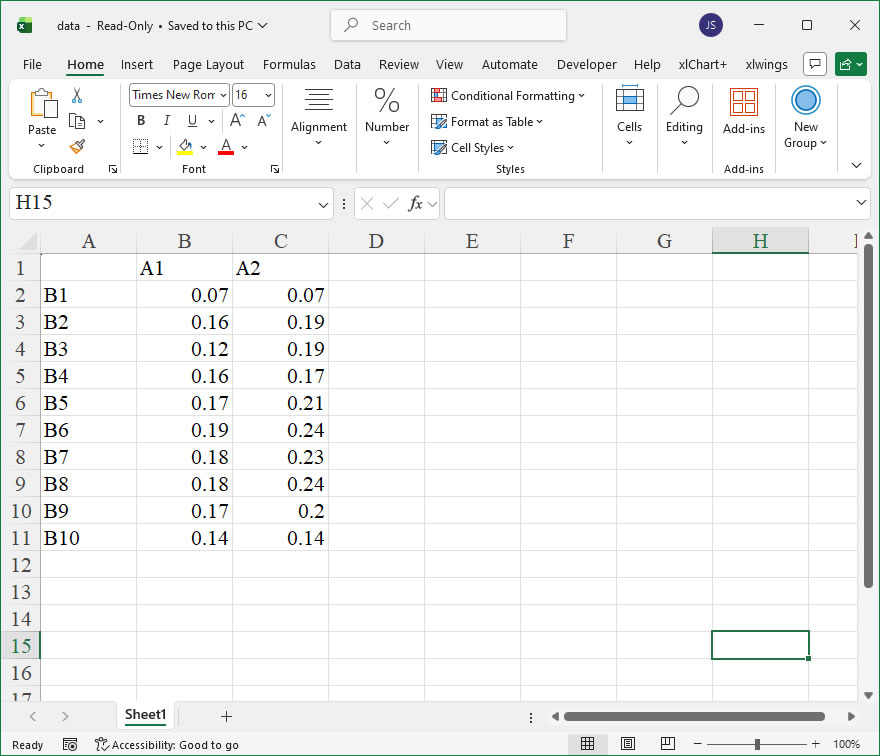
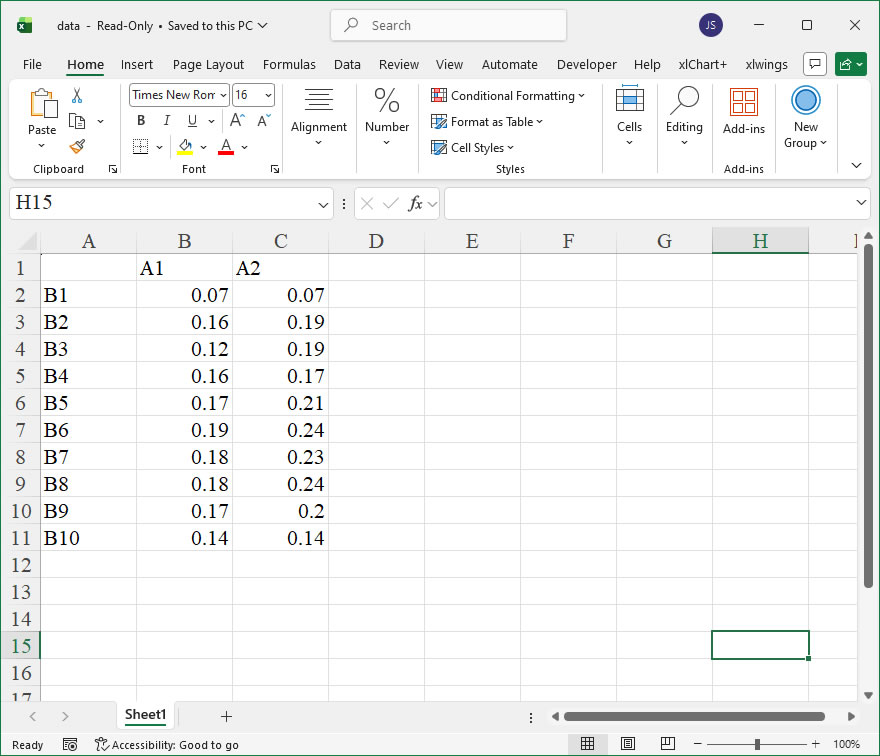
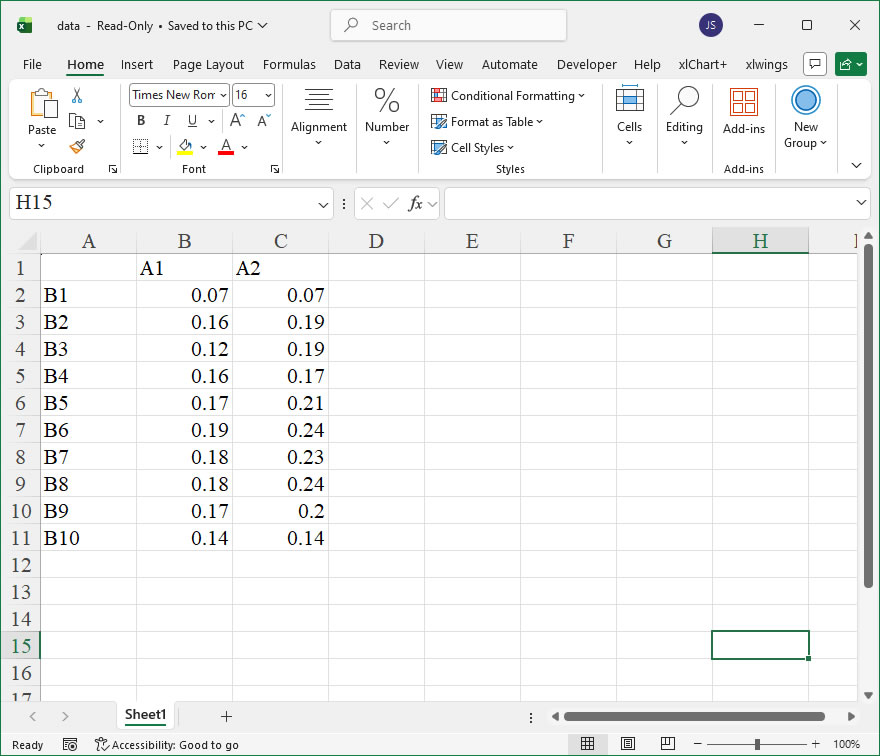
sht.api.Range(‘A1:B7’).Select()
sht.api.Range(‘A1:B7’).Select() #Data
cht=sht.api.Shapes.AddChart().Chart #Add chart
cht.Legend.Font.Italic=True #Legend font italicized
The chart area is the rectangular area that contains the entire chart, while the plot area is the rectangular area defined by the two axes. In Excel, the chart area is represented by the `ChartArea` object, and the plot area is represented by the `PlotArea` object. You can access these areas using the `ChartArea` and `PlotArea` properties of the `Chart` object.
By continuously referencing the `ChartArea` and `PlotArea` objects’ `Format.Fill` property, you can set the fill properties of both areas, such as their color, transparency, gradient fills, pattern fills, picture fills, texture fills, etc.
Using the `Format.Shadow` property of the `ChartArea` and `PlotArea` objects, you can set additional shadow properties for these areas. The `Format.Shadow` property returns a `ShadowFormat` object with the following main properties:
– **Visible**: Determines whether the shadow is visible.
– **Blur**: Gets or sets the blur radius of the shadow.
– **Transparency**: Gets or sets the transparency of the shadow (from 0.0 for opaque to 1.0 for fully transparent).
– **OffsetX**: Gets or sets the horizontal offset of the shadow in points. Positive values shift the shadow to the right, while negative values shift it to the left.
– **OffsetY**: Gets or sets the vertical offset of the shadow in points. Positive values shift the shadow downward, while negative values shift it upward.
The chart area is the rectangular area that contains the entire chart, while the plot area is the rectangular area defined by the two axes. In Excel, the chart area is represented by the `ChartArea` object, and the plot area is represented by the `PlotArea` object. You can access these areas using the `ChartArea` and `PlotArea` properties of the `Chart` object.
By continuously referencing the `ChartArea` and `PlotArea` objects’ `Format.Fill` property, you can set the fill properties of both areas, such as their color, transparency, gradient fills, pattern fills, picture fills, texture fills, etc.
Using the `Format.Shadow` property of the `ChartArea` and `PlotArea` objects, you can set additional shadow properties for these areas. The `Format.Shadow` property returns a `ShadowFormat` object with the following main properties:
– **Visible**: Determines whether the shadow is visible.
– **Blur**: Gets or sets the blur radius of the shadow.
– **Transparency**: Gets or sets the transparency of the shadow (from 0.0 for opaque to 1.0 for fully transparent).
– **OffsetX**: Gets or sets the horizontal offset of the shadow in points. Positive values shift the shadow to the right, while negative values shift it to the left.
– **OffsetY**: Gets or sets the vertical offset of the shadow in points. Positive values shift the shadow downward, while negative values shift it upward.
The chart area is the rectangular area that contains the entire chart, while the plot area is the rectangular area defined by the two axes. In Excel, the chart area is represented by the `ChartArea` object, and the plot area is represented by the `PlotArea` object. You can access these areas using the `ChartArea` and `PlotArea` properties of the `Chart` object.
By continuously referencing the `ChartArea` and `PlotArea` objects’ `Format.Fill` property, you can set the fill properties of both areas, such as their color, transparency, gradient fills, pattern fills, picture fills, texture fills, etc.
Using the `Format.Shadow` property of the `ChartArea` and `PlotArea` objects, you can set additional shadow properties for these areas. The `Format.Shadow` property returns a `ShadowFormat` object with the following main properties:
– **Visible**: Determines whether the shadow is visible.
– **Blur**: Gets or sets the blur radius of the shadow.
– **Transparency**: Gets or sets the transparency of the shadow (from 0.0 for opaque to 1.0 for fully transparent).
– **OffsetX**: Gets or sets the horizontal offset of the shadow in points. Positive values shift the shadow to the right, while negative values shift it to the left.
– **OffsetY**: Gets or sets the vertical offset of the shadow in points. Positive values shift the shadow downward, while negative values shift it upward.
The `SetElement` method of the `Chart` object allows you to set chart elements for the specified chart. The method has one parameter that provides options for setting. The possible values of the parameter are shown in the table below.
Use the **AxisBetweenCategories** property of the **Axis** object to set the intersection point between the value axis and the category axis. If the value is `True`, the intersection occurs in the middle of the categories; if it is `False`, the intersection occurs at the middle point of the categories.
The **Crosses** property of the **Axis** object returns or sets the point at which the axis intersects with another axis. The possible values for this property are as follows: