【Method】
The legend is represented by the `Legend` object. You can use the `HasLegend` property of the `Chart` object to show or hide the legend, and the `Legend` property to return the `Legend` object. Using the properties and methods of the `Legend` object, you can modify the appearance, font, and position of the legend.
The `Format` property of the `Legend` object returns a `ChartFormat` object, which can be used to set the background and border of the legend. The `Font` property returns a `Font` object to set the font. The `Position` property determines the position of the legend. The values for the `Position` property are shown in the table below.
|
Name |
Value |
Description |
|
xlLegendPositionBottom |
-4107 |
Display legend at the bottom |
|
xlLegendPositionCorner |
2 |
Display legend at the top-right corner of the chart |
|
xlLegendPositionCustom |
-4161 |
Display legend at a custom position |
|
xlLegendPositionLeft |
-4131 |
Display legend on the left side |
|
xlLegendPositionRight |
-4152 |
Display legend on the right side |
|
xlLegendPositionTop |
-4160 |
Display legend at the top |
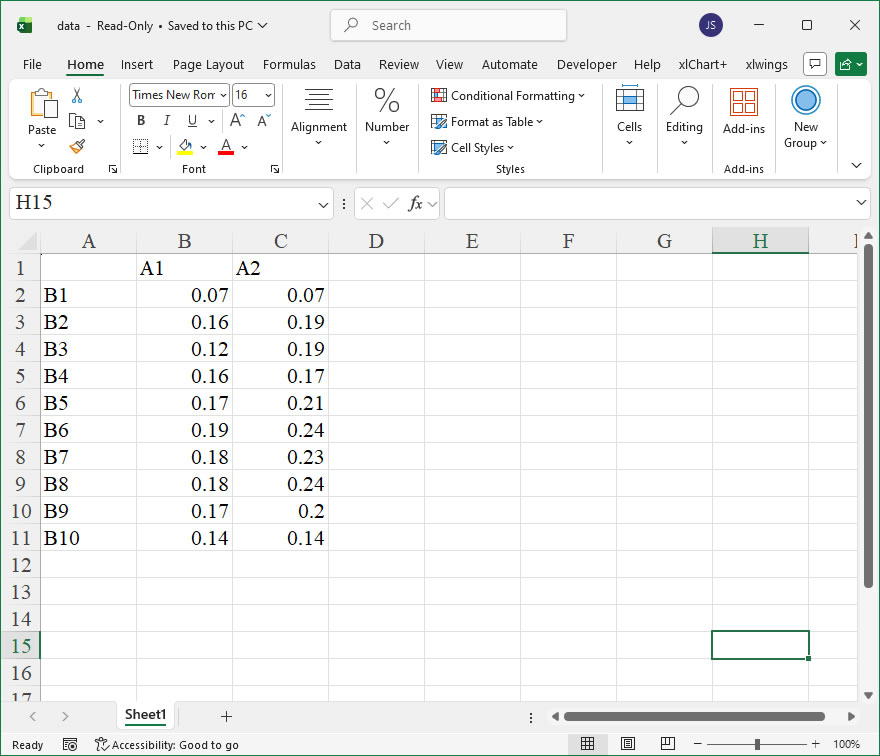
sht.api.Range(‘A1:B7’).Select()
sht.api.Range(‘A1:B7’).Select() #Data
cht=sht.api.Shapes.AddChart().Chart #Add chart
cht.Legend.Font.Italic=True #Legend font italicized
cht.Legend.Format.Fill.ForeColor.RGB=xw.utils.rgb_to_int((255,255,0))
cht.Legend.Format.Line.ForeColor.RGB=xw.utils.rgb_to_int((0,0,255))
cht.Legend.Position=-4107 #Legend positioned below the chart
【Example】
【Code】
import xlwings as xw
import os

def set_style(cht):
    cht.ChartArea.Format.Line.Visible=False
    cht.PlotArea.Format.Fill.Visible=False
    cht.PlotArea.Format.Line.Visible=True
    cht.PlotArea.Format.Line.ForeColor.RGB=xw.utils.rgb_to_int((200,200,200))
    #cht.PlotArea.Format.Line.ForeColor.ObjectThemeColor = msoThemeColorText1
    ax1=cht.Axes(1)
    ax2=cht.Axes(2)
    ax1.HasTitle=True
    ax1.AxisTitle.Text='Categories'
    ax1.AxisTitle.Font.Size=10
    ax1.TickLabels.Font.Size=8
    #ax1.TickLabels.NumberFormat='0.00'
    ax1.HasMajorGridlines=False
    ax2.HasTitle=True
    ax2.AxisTitle.Text='Values'
    ax2.AxisTitle.Font.Size=10
    ax2.TickLabels.Font.Size=8
    ax2.HasMajorGridlines=False
    cht.HasTitle=True
    #cht.ChartTitle.Caption='Plot'
    #cht.ChartTitle.Font.Size=12

root=os.getcwd()
app=xw.App(visible=True, add_book=False)
wb=app.books.open(root+r'/data.xlsx',read_only=False)
sht=wb.sheets('Sheet1')

sht.api.Range('A1:B7').Select()    #
cht=sht.api.Shapes.AddChart2(-1, \
          xw.constants.ChartType.xlColumnClustered,20,20,350,250,True).Chart
cht.HasLegend=True
leg=cht.Legend
leg.Position=xw.constants.LegendPosition.xlLegendPositionBottom
leg.Format.Fill.ForeColor.RGB=xw.utils.rgb_to_int((255,255,0))

set_style(cht)

cht.Export(root+'/cht.jpg')
cht.Export(root+'/cht.svg')
cht.ExportAsFixedFormat(0,root+'/cht.pdf')

#wb.save()
#app.kill()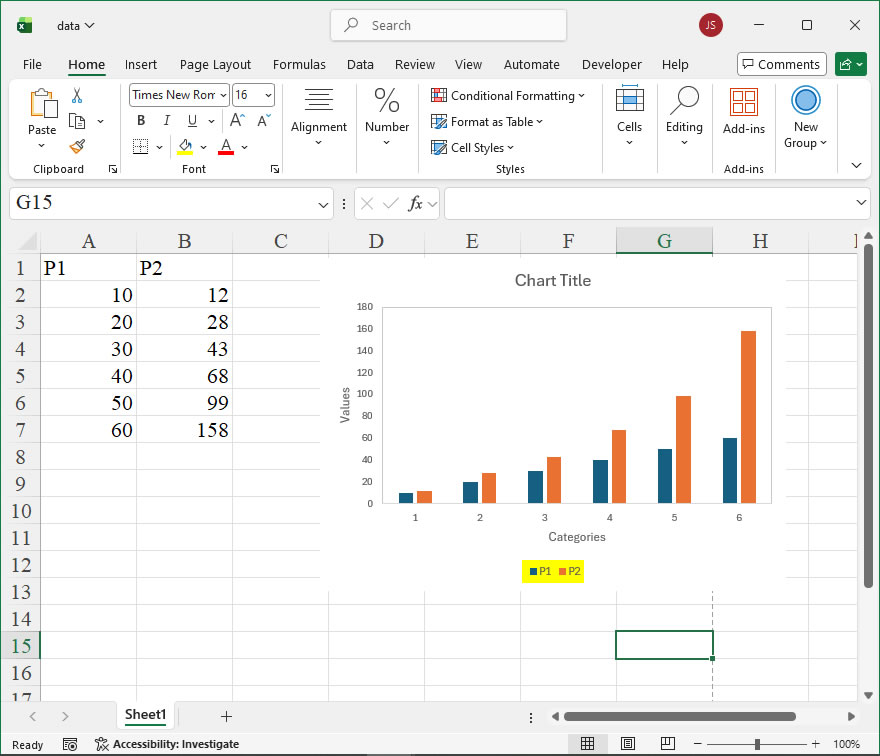
Leave a Reply