【Method】
The text labels corresponding to the positions of the major tick marks on the axis are called **tick labels**. These labels annotate the values or categories corresponding to the major tick marks.
For a category axis, the text of the tick labels represents the names of the associated categories in the chart. By default, the tick labels for a category axis are numbers, which start from 1 and increase in order from left to right. The **TickLabelSpacing** property can be used to set how many categories are displayed before a tick label is shown.
For a value axis, the text labels correspond to the major unit, minimum scale, and maximum scale properties of the axis. To change the tick label text for a value axis, you need to modify the values of these properties.
The **TickLabels** property of the **Axis** object returns a **TickLabels** object that represents the tick labels on the axis. By using the properties and methods of the **TickLabels** object, you can set various properties of the tick labels, such as font, number format, display direction, offset, and alignment.
Use the **TickLabelPosition** property to specify the position of the tick labels on the axis. The values for this property are constants or values as listed in the table below:
|
Name |
Value |
Description |
|
xlTickLabelPositionHigh |
-4127 |
Top or right side of the chart |
|
xlTickLabelPositionLow |
-4134 |
Bottom or left side of the chart |
|
xlTickLabelPositionNextToAxis |
4 |
Next to the axis (where the axis is not at any side of the chart) |
|
xlTickLabelPositionNone |
-4142 |
No tick labels |
The **TickLabelSpacing** property allows you to return or set the number of categories or data series between each tick label. This property is only applicable for category axes and series axes and can be set to a value between 1 and 31999.
When the **TickLabelSpacingIsAuto** property is set to `True`, Excel will automatically adjust the spacing of the tick labels.
sht.api.Range(‘A1:B7’).Select() #Data
cht=sht.api.Shapes.AddChart().Chart #Add chart
axs=cht.Axes(1) #Horizontal axis
axs2=cht.Axes(2) #Vertical axis
tl=axs2.TickLabels #Vertical axis tick labels
tl.NumberFormat = ‘0.00’ #Number format
axs2.TickLabelPosition=xw.constants.Constants.xlHigh
【Example】
【Code】
#Axis - Tick labels

import xlwings as xw
import os

root = os.getcwd()
app = xw.App(visible=True, add_book=False)
wb=app.books.open(root+r'/P1P2.xlsx',read_only=False)
sht=wb.sheets(1)

sht.api.Range('A1:B7').Select()    #Data
cht=sht.api.Shapes.AddChart().Chart    #Add chart
axs=cht.Axes(1)    #Horizontal axis
axs2=cht.Axes(2)    #Vertical axis
tl=axs2.TickLabels    #Vertical axis tick labels
tl.NumberFormat = '0.00'    #Number format

axs2.TickLabelPosition=xw.constants.Constants.xlHigh

#wb.save()
#wb.close()
#app.kill()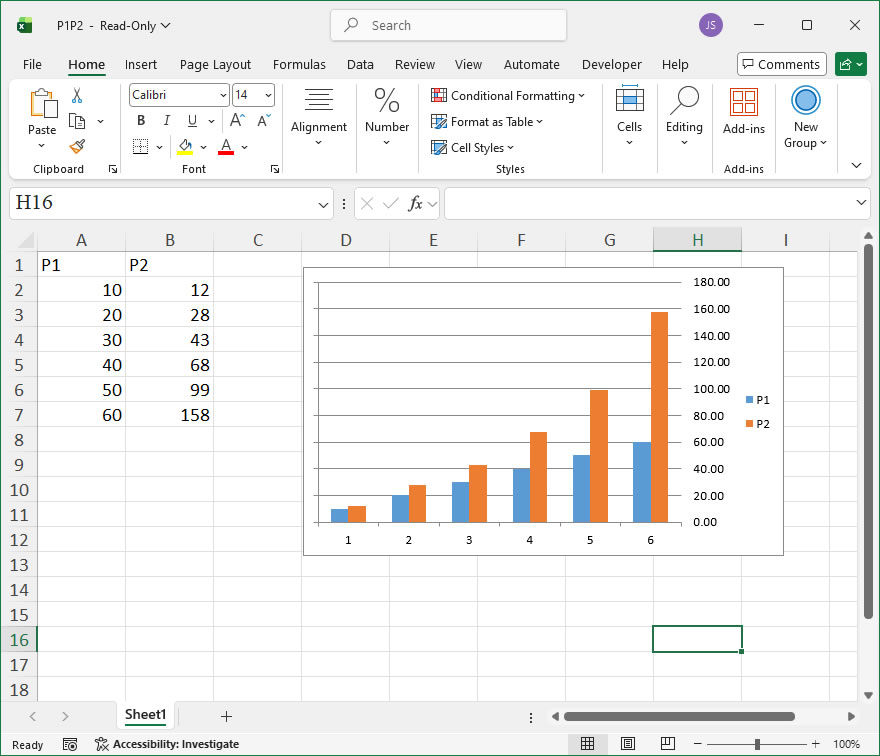
Leave a Reply