Archive

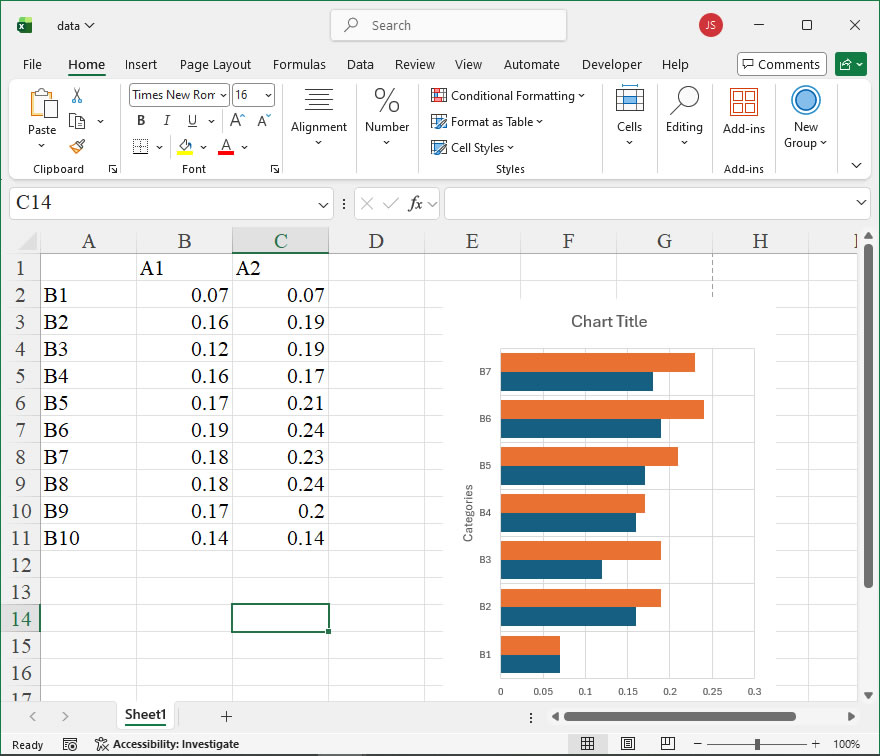
How To Create Stacked Bar Chart Using xlwings?

Example

Code

import xlwings as xw
import os

def set_style(cht):
    cht.ChartArea.Format.Line.Visible=False
    cht.PlotArea.Format.Fill.Visible = False
    cht.PlotArea.Format.Line.Visible = False
    cht.PlotArea.Format.Line.ForeColor.RGB=xw.utils.rgb_to_int((200,200,200))
    #cht.PlotArea.Format.Line.ForeColor.ObjectThemeColor = msoThemeColorText1
    ax1 = cht.Axes(1)
    ax2 = cht.Axes(2)
    ax1.HasTitle = True
    ax1.AxisTitle.Text = 'Categories'
    ax1.AxisTitle.Font.Size = 10
    ax1.TickLabels.Font.Size = 8
    #ax1.TickLabels.NumberFormat = '0.00'
    ax1.HasMajorGridlines = True
    ax2.HasTitle = True
    ax2.AxisTitle.Text = 'Values'
    ax2.AxisTitle.Font.Size = 10
    ax2.TickLabels.Font.Size = 8
    ax2.HasMajorGridlines = True
    cht.HasTitle = True
    #cht.ChartTitle.Caption = 'Plot'
    #cht.ChartTitle.Font.Size = 12

root=os.getcwd()
app=xw.App(visible=True,add_book=False)
wb=app.books.open(root+r'/data.xlsx',read_only=False)
sht=wb.sheets('Sheet1')

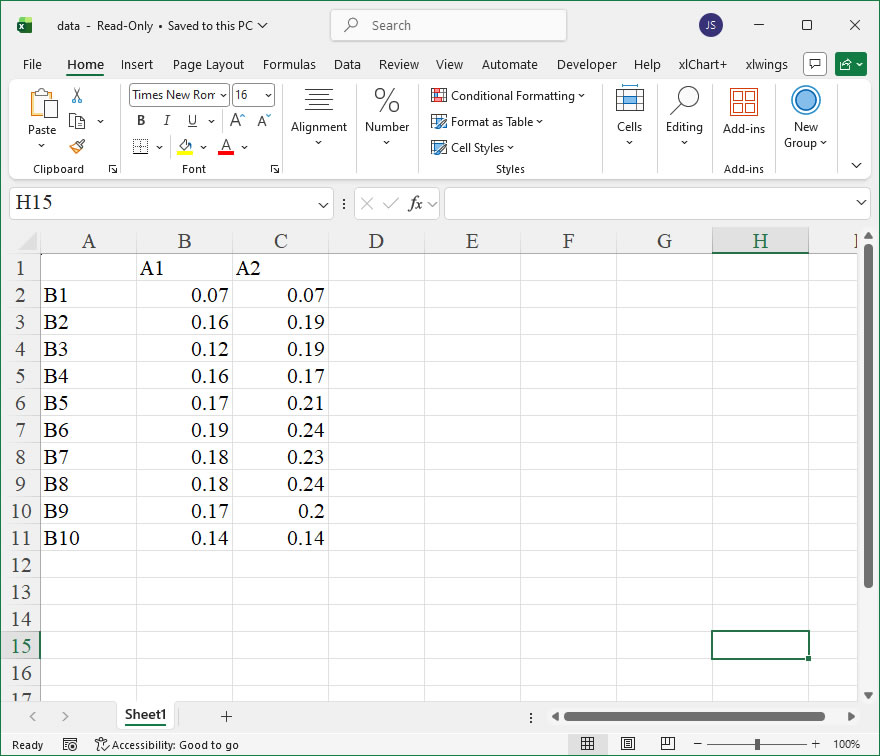
sht.api.Range('A2:D7').Select()  #
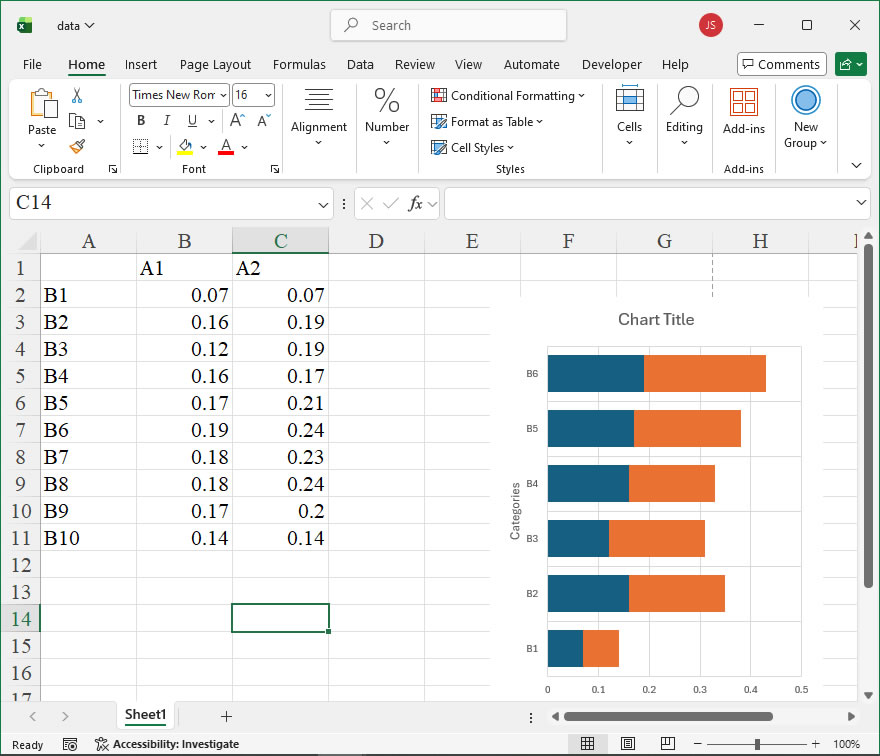
shp=sht.api.Shapes.AddChart2(-1,xw.constants.ChartType.xlBarStacked,20,20,250,350,True)
cht=shp.Chart  #
cht.ChartGroups(1).GapWidth=50

set_style(cht)

cht.Export(root+'/cht.jpg')
cht.Export(root+'/cht.svg')
cht.ExportAsFixedFormat(0,root+'/cht.pdf')

#wb.save()
#app.kill()

How to use Application.ActiveCell in the xlwings API way

The Application.ActiveCell property in Excel’s object model is a crucial feature for interacting with the currently selected cell in the active worksheet. In xlwings, this functionality is accessed through the api property, which provides a direct gateway to the underlying Excel COM (Component Object Model) objects. This allows for precise control and manipulation of the active cell, enabling dynamic data analysis and visualization workflows.

Functionality
The ActiveCell property returns a Range object that represents the single active cell in the active window of the Excel application. If a range of cells is selected, the active cell is the one within that selection where data entry would occur (typically highlighted with a white background in the selection). It is essential for operations that depend on the user’s current focus or for automating tasks relative to the active selection. Through xlwings, you can read or write values, apply formatting, or use it as a reference point for navigating or expanding selections.

Syntax
In xlwings, the ActiveCell is accessed via the Application object from the api. The general syntax is:

active_cell = xw.apps.active.api.ActiveCell

Alternatively, if you have a specific app instance (e.g., when multiple Excel instances are open), you can use:

app = xw.App(visible=True) # or get an existing app
active_cell = app.api.ActiveCell

The returned object is a COM proxy to Excel’s Range, which means you can chain it with other properties and methods available in the Excel object model. Key parameters for related methods (when called on active_cell) include:

  • For reading or writing values: active_cell.Value or active_cell.Value2 (use Value2 for unformatted values).
  • For formatting: properties like active_cell.Font.Bold = True.
  • For navigation: methods like active_cell.Offset(RowOffset, ColumnOffset), where RowOffset and ColumnOffset are integer values specifying the number of rows and columns to move (positive for down/right, negative for up/left).

Examples
Here are practical xlwings API code examples demonstrating the use of Application.ActiveCell:

  1. Reading the active cell’s value:
import xlwings as xw
# Ensure Excel is running and a cell is selected
wb = xw.books.active # Get active workbook
active_cell = xw.apps.active.api.ActiveCell
value = active_cell.Value
print(f"The active cell value is: {value}")
  1. Writing a value to the active cell and applying formatting:
import xlwings as xw
app = xw.App(visible=True)
wb = app.books.open('example.xlsx')
active_cell = app.api.ActiveCell
active_cell.Value = "Updated Data"
active_cell.Font.Bold = True
active_cell.Interior.Color = 65535 # Yellow fill
wb.save()
app.quit()
  1. Using the active cell as a starting point to select a range:
import xlwings as xw
active_cell = xw.apps.active.api.ActiveCell
# Select a range starting from the active cell, e.g., 3 rows down and 2 columns right
target_range = active_cell.Offset(3, 2).Resize(5, 4) # Resize to 5 rows by 4 columns
target_range.Value = [[1, 2, 3, 4] for _ in range(5)] # Fill with sample data
  1. Checking the address of the active cell:
import xlwings as xw
active_cell = xw.apps.active.api.ActiveCell
address = active_cell.Address # Returns absolute address like "$A$1"
print(f"Active cell address: {address}")
How To Create Clustered Bar Chart Using xlwings?

Example

Code

import xlwings as xw
import os

def set_style(cht):
    cht.ChartArea.Format.Line.Visible=False
    cht.PlotArea.Format.Fill.Visible = False
    cht.PlotArea.Format.Line.Visible = False
    cht.PlotArea.Format.Line.ForeColor.RGB=xw.utils.rgb_to_int((200,200,200))
    #cht.PlotArea.Format.Line.ForeColor.ObjectThemeColor = msoThemeColorText1
    ax1 = cht.Axes(1)
    ax2 = cht.Axes(2)
    ax1.HasTitle = True
    ax1.AxisTitle.Text = 'Categories'
    ax1.AxisTitle.Font.Size = 10
    ax1.TickLabels.Font.Size = 8
    #ax1.TickLabels.NumberFormat = '0.00'
    ax1.HasMajorGridlines = True
    ax2.HasTitle = True
    ax2.AxisTitle.Text = 'Values'
    ax2.AxisTitle.Font.Size = 10
    ax2.TickLabels.Font.Size = 8
    ax2.HasMajorGridlines = True
    cht.HasTitle = True
    #cht.ChartTitle.Caption = 'Plot'
    #cht.ChartTitle.Font.Size = 12

root=os.getcwd()
app=xw.App(visible=True,add_book=False)
wb=app.books.open(root+r'/data.xlsx',read_only=False)
sht=wb.sheets('Sheet1')

sht.api.Range('A2:C8').Select()  #
shp=sht.api.Shapes.AddChart2(-1,xw.constants.ChartType.xlBarClustered,20,20,250,350,True)
cht=shp.Chart  #
cht.ChartGroups(1).GapWidth=50

set_style(cht)

cht.Export(root+'/cht.jpg')
cht.Export(root+'/cht.svg')
cht.ExportAsFixedFormat(0,root+'/cht.pdf')

#wb.save()
#app.kill()

How to use Application.Wait in the xlwings API way

The Application.Wait method in Excel’s object model is a useful tool for introducing pauses or delays in macro execution, allowing other processes to complete or simply timing operations. In xlwings, this functionality is accessed through the api property, which provides direct access to the underlying Excel object model. The method suspends all Microsoft Excel activity and may prevent the user from interacting with the application during the wait period, so it should be used judiciously, typically for short, controlled delays.

Functionality:
The primary purpose of Application.Wait is to pause the execution of a VBA macro or, in this context, a Python script using xlwings, until a specified time is reached. It is often employed to wait for external data refreshes, allow animations to complete, or synchronize with other applications. Unlike time.sleep() in Python, which halts the entire Python process, Application.Wait specifically halts Excel’s calculation and UI thread, which can be necessary when Excel needs to catch up with operations.

Syntax in xlwings:
The xlwings API call follows the pattern: app.api.Wait(Time). Here, app is an instance of the xlwings App class, representing the Excel application.

  • Parameter: Time (required). This is a variant (date/time) argument that specifies the time at which to resume macro execution. It can be provided as a string or a Python datetime object. Excel expects the time in a format it recognizes, typically as a string like "hh:mm:ss" or a serial number representing the date and time.

Parameter Details:
The Time parameter is the future time when execution should continue. If the provided time is in the past, the method returns False immediately, and execution continues without waiting. The time is evaluated based on Excel’s system clock. To specify a duration (e.g., wait 5 seconds), you need to calculate the target time by adding the delay to the current time. For example, use datetime.now() + timedelta(seconds=5) to wait for 5 seconds.

Code Examples:

  1. Basic Wait Until a Specific Time: This example pauses the macro until 10 seconds after the current time.
import xlwings as xw
from datetime import datetime, timedelta

app = xw.App(visible=True)
# Open a workbook or perform operations
target_time = datetime.now() + timedelta(seconds=10)
app.api.Wait(target_time) # Wait until 10 seconds from now
app.quit()
  1. Wait for a Fixed Duration with Validation: This example waits for 3 seconds and checks if the wait was successful (i.e., the time was in the future).
import xlwings as xw
from datetime import datetime, timedelta

app = xw.App(visible=True)
wb = app.books.open('example.xlsx')
delay = timedelta(seconds=3)
success = app.api.Wait(datetime.now() + delay)
if success:
    print("Wait completed successfully.")
else:
    print("Wait was not executed (time in past).")
# Continue with other operations, like refreshing data
wb.save()
app.quit()
  1. Using a String Time Format: You can also pass the time as a string, though this is less common in dynamic scripts.
import xlwings as xw

app = xw.App(visible=True)
# Wait until 2:30 PM on the current day
app.api.Wait("14:30:00")
app.quit()

Considerations:

  • During the wait, Excel becomes unresponsive, so avoid long waits in interactive applications. For longer pauses, consider alternative methods like time.sleep() in a background thread or using events.
  • The Application.Wait method returns a Boolean value: True if the wait was successful (i.e., the specified time was in the future), and False if not. This can be used for error handling.
  • In xlwings, ensure that the Excel application is properly instantiated via xw.App() before calling api.Wait. Misuse may lead to runtime errors or unexpected behavior.

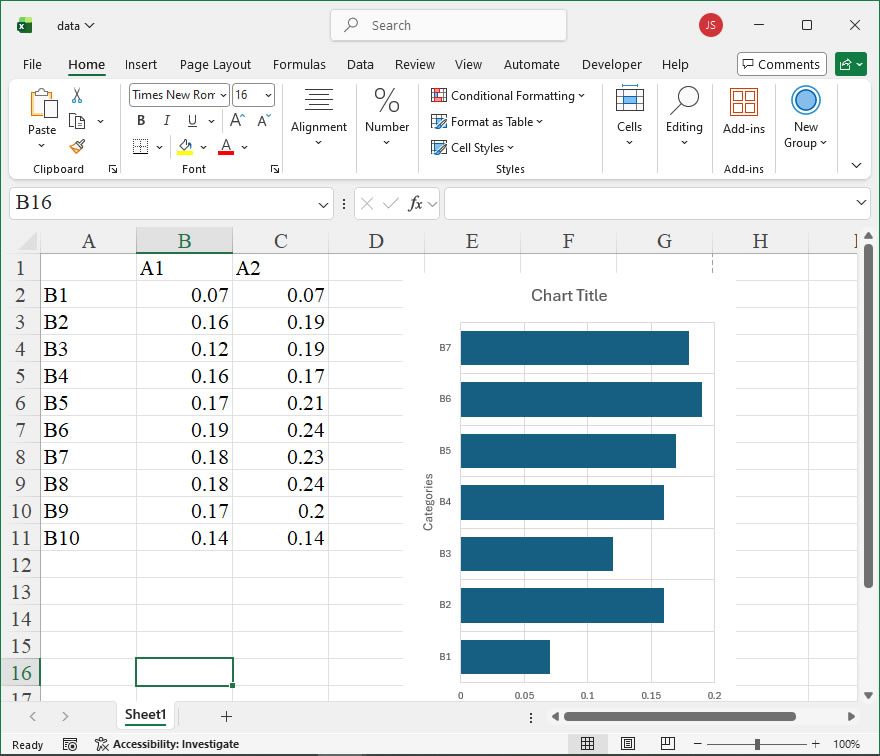
How To Create Simple Bar Chart Using xlwings?

Example

Code

import xlwings as xw
import os

def set_style(cht):
    cht.ChartArea.Format.Line.Visible=False
    cht.PlotArea.Format.Fill.Visible = False
    cht.PlotArea.Format.Line.Visible = False
    cht.PlotArea.Format.Line.ForeColor.RGB=xw.utils.rgb_to_int((200,200,200))
    #cht.PlotArea.Format.Line.ForeColor.ObjectThemeColor = msoThemeColorText1
    ax1 = cht.Axes(1)
    ax2 = cht.Axes(2)
    ax1.HasTitle = True
    ax1.AxisTitle.Text = 'Categories'
    ax1.AxisTitle.Font.Size = 10
    ax1.TickLabels.Font.Size = 8
    #ax1.TickLabels.NumberFormat = '0.00'
    ax1.HasMajorGridlines = True
    ax2.HasTitle = True
    ax2.AxisTitle.Text = 'Values'
    ax2.AxisTitle.Font.Size = 10
    ax2.TickLabels.Font.Size = 8
    ax2.HasMajorGridlines = True
    cht.HasTitle = True
    #cht.ChartTitle.Caption = 'Plot'
    #cht.ChartTitle.Font.Size = 12

root=os.getcwd()
app=xw.App(visible=True,add_book=False)
wb=app.books.open(root+r'/data.xlsx',read_only=False)
sht=wb.sheets('Sheet1')

sht.api.Range('A2:B8').Select()  #
shp=sht.api.Shapes.AddChart2(-1,xw.constants.ChartType.xlBarClustered,20,20,250,350,True)
cht=shp.Chart  #
cht.ChartGroups(1).GapWidth=50

set_style(cht)

cht.Export(root+'/cht.jpg')
cht.Export(root+'/cht.svg')
cht.ExportAsFixedFormat(0,root+'/cht.pdf')

#wb.save()
#app.kill()

How to use Application.Volatile in the xlwings API way

The Application.Volatile method in Excel, when invoked via xlwings, marks a user-defined function (UDF) as volatile. A volatile function recalculates every time a calculation occurs in any open workbook, not just when its direct precedents change. This is essential for functions that depend on dynamic data like real-time feeds, random numbers, or the current time. In xlwings, you typically use this within a Python function decorated with @xw.func to control its recalculation behavior.

Functionality:
It ensures that the UDF recalculates with every workbook calculation cycle. This is useful for functions that need to return updated values continuously, such as those fetching live data. However, overuse can slow down performance due to excessive recalculation.

Syntax in xlwings:
In xlwings, you call Application.Volatile within a UDF by accessing the Excel application object. The method takes one optional parameter:

  • Volatile(True): Marks the function as volatile (default behavior if called without arguments).
  • Volatile(False): Marks the function as non-volatile, meaning it recalculates only when its direct precedents change.

The xlwings API call format is:

xw.apps.active.api.Volatile(True) # For the active Excel application

Here, xw.apps.active refers to the active Excel application instance, and .api provides access to the underlying Excel object model. The parameter True sets volatility; use False to disable it.

Example Usage:
Consider a UDF that returns a random number, which should change on every recalculation. Without volatility, it might only update when explicitly triggered. The xlwings code below defines such a function:

import xlwings as xw
import random

@xw.func
def dynamic_random():
    # Access the Excel application and set the function as volatile
    xw.apps.active.api.Volatile(True)
    # Return a random number between 0 and 1
    return random.random()

# To use this, save the script and import it as an xlwings add-in or run it in an interactive session.

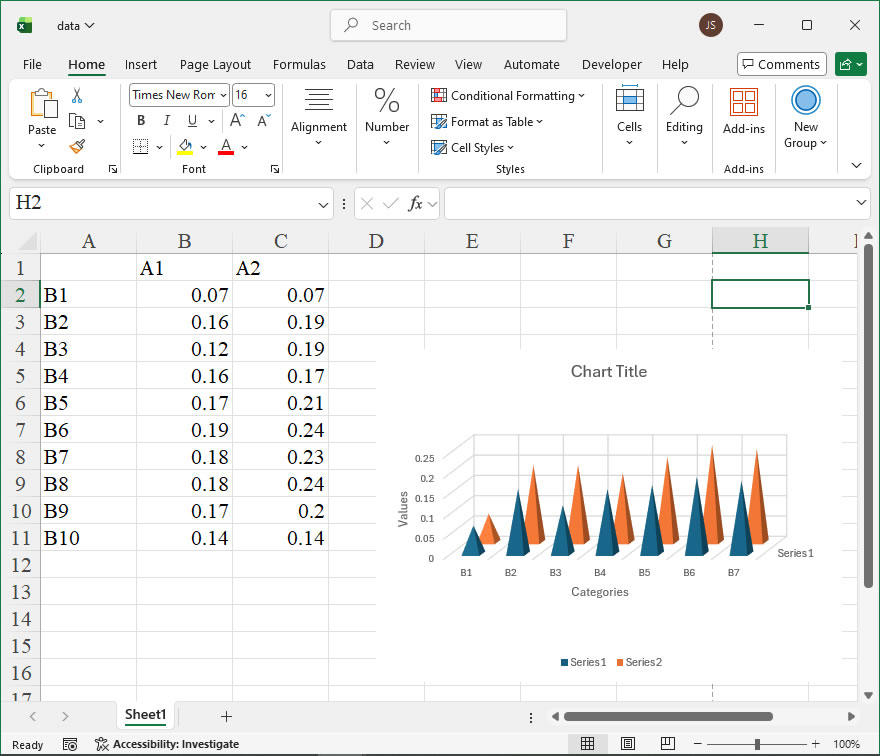
How To Create 3D Square Pyramid Column Chart Using xlwings?

Example

Code

import xlwings as xw
import os

def set_style(cht):
    cht.ChartArea.Format.Line.Visible=False
    cht.PlotArea.Format.Fill.Visible = False
    cht.PlotArea.Format.Line.Visible = False
    cht.PlotArea.Format.Line.ForeColor.RGB=xw.utils.rgb_to_int((200,200,200))
    #cht.PlotArea.Format.Line.ForeColor.ObjectThemeColor = msoThemeColorText1
    ax1 = cht.Axes(1)
    ax2 = cht.Axes(2)
    ax1.HasTitle = True
    ax1.AxisTitle.Text = 'Categories'
    ax1.AxisTitle.Font.Size = 10
    ax1.TickLabels.Font.Size = 8
    #ax1.TickLabels.NumberFormat = '0.00'
    ax1.HasMajorGridlines = True
    ax2.HasTitle = True
    ax2.AxisTitle.Text = 'Values'
    ax2.AxisTitle.Font.Size = 10
    ax2.TickLabels.Font.Size = 8
    ax2.HasMajorGridlines = True
    cht.HasTitle = True
    #cht.ChartTitle.Caption = 'Plot'
    #cht.ChartTitle.Font.Size = 12

root=os.getcwd()
app=xw.App(visible=True,add_book=False)
wb=app.books.open(root+r'/data.xlsx',read_only=False)
sht=wb.sheets('Sheet1')

sht.api.Range('A2:C8').Select()    #
shp=sht.api.Shapes.AddChart2(-1,xw.constants.ChartType.xlPyramidCol,20,20,350,250,True)
cht=shp.Chart  #

set_style(cht)

cht.Export(root+'/cht.jpg')
cht.Export(root+'/cht.svg')
cht.ExportAsFixedFormat(0,root+'/cht.pdf')

#wb.save()
#app.kill()

How to use Application.Union in the xlwings API way

The Application.Union method in Excel VBA is used to create a single, combined range from two or more individual ranges. This combined range object can then be used for subsequent operations, such as formatting or data manipulation, applied uniformly across all the included cells. In xlwings, this functionality is accessed through the api property of an xlwings object, which provides direct access to the underlying Excel object model. This allows Python scripts to leverage Excel’s powerful range combination logic seamlessly.

Functionality
The primary function of Union is to create a composite Range object. This is particularly useful when you need to perform the same action on multiple, non-contiguous cell blocks without having to loop through each range separately. It streamlines code and improves efficiency.

Syntax in xlwings
The syntax follows the pattern of accessing the VBA method through the xlwings api:

combined_range = xw.apps[0].api.Union(Range1, Range2, ...)
  • xw.apps[0].api: This accesses the Application object of the first open Excel instance via xlwings.
  • .Union(): The method call.
  • Parameters: Range1, Range2, …: These are two or more Range objects that you want to combine. You must provide at least two Range arguments. These ranges can refer to different worksheets or even different workbooks.
  • Return Value: The method returns a new Range object representing the union of all specified ranges.

Code Example
The following xlwings script demonstrates the use of Application.Union. It creates a union of three separate ranges on a sheet and then applies a yellow background fill to all cells within the combined range.

import xlwings as xw

# Connect to the active Excel instance and workbook
app = xw.apps.active
wb = app.books.active
sheet = wb.sheets['Sheet1']

# Define three separate, non-adjacent ranges
range1 = sheet.range('A1:B2')
range2 = sheet.range('D4')
range3 = sheet.range('C6:E7')

# Use the Application.Union method via the api property
# Note: We use .api on the sheet's range objects to get the native Excel Range objects for the Union method.
combined_range = app.api.Union(range1.api, range2.api, range3.api)

# Apply formatting to the entire unioned range
combined_range.Interior.Color = (255, 255, 0) # Yellow fill

# The action above fills cells A1, A2, B1, B2, D4, and the block C6:E7.

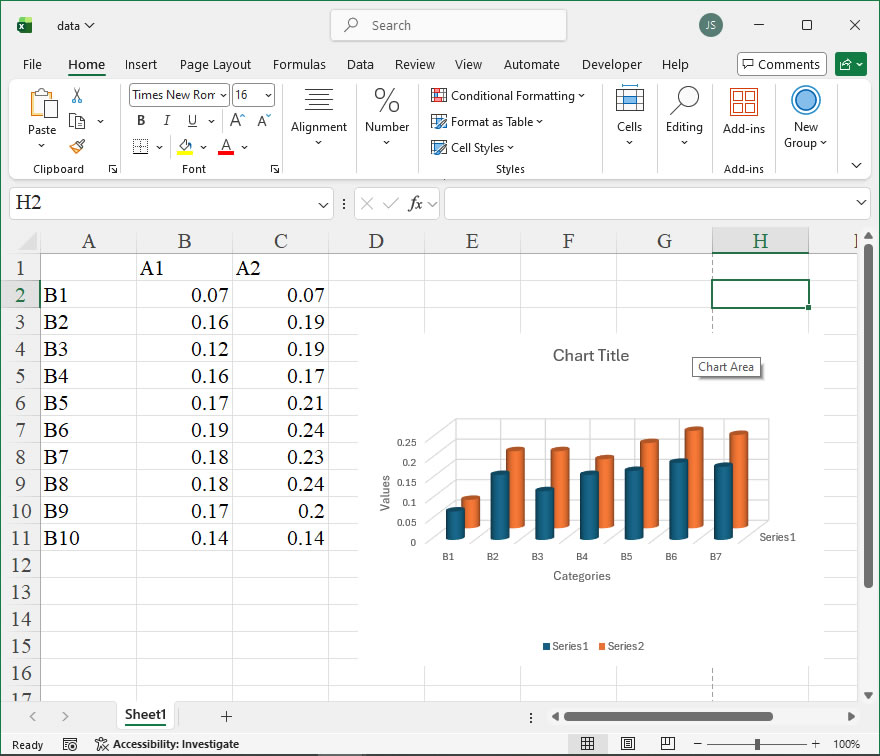
How To Create 3D Cylinder Column Chart Using xlwings?

Example

Code

import xlwings as xw
import os

def set_style(cht):
    cht.ChartArea.Format.Line.Visible=False
    cht.PlotArea.Format.Fill.Visible = False
    cht.PlotArea.Format.Line.Visible = False
    cht.PlotArea.Format.Line.ForeColor.RGB=xw.utils.rgb_to_int((200,200,200))
    #cht.PlotArea.Format.Line.ForeColor.ObjectThemeColor = msoThemeColorText1
    ax1 = cht.Axes(1)
    ax2 = cht.Axes(2)
    ax1.HasTitle = True
    ax1.AxisTitle.Text = 'Categories'
    ax1.AxisTitle.Font.Size = 10
    ax1.TickLabels.Font.Size = 8
    #ax1.TickLabels.NumberFormat = '0.00'
    ax1.HasMajorGridlines = True
    ax2.HasTitle = True
    ax2.AxisTitle.Text = 'Values'
    ax2.AxisTitle.Font.Size = 10
    ax2.TickLabels.Font.Size = 8
    ax2.HasMajorGridlines = True
    cht.HasTitle = True
    #cht.ChartTitle.Caption = 'Plot'
    #cht.ChartTitle.Font.Size = 12

root=os.getcwd()
app=xw.App(visible=True,add_book=False)
wb=app.books.open(root+r'/data.xlsx',read_only=False)
sht=wb.sheets('Sheet1')

sht.api.Range('A2:C8').Select()  #
shp=sht.api.Shapes.AddChart2(-1,xw.constants.ChartType.xlCylinderCol,20,20,350,250,True)
cht=shp.Chart  #

set_style(cht)

cht.Export(root+'/cht.jpg')
cht.Export(root+'/cht.svg')
cht.ExportAsFixedFormat(0,root+'/cht.pdf')

#wb.save()
#app.kill()

How to use Application.Undo in the xlwings API way

The Application.Undo method in Excel’s object model provides a way to reverse the last user-interface action performed in Excel, such as typing in a cell, formatting, or deleting data. In xlwings, this functionality is exposed through the api property, which grants direct access to the underlying Excel COM object. This allows Python scripts to mimic the “Undo” command typically executed by pressing Ctrl+Z, offering a mechanism to revert unintended changes programmatically. It is important to note that the Undo method is primarily designed for actions initiated through the Excel interface and may not work for changes made via VBA or COM automation in certain contexts. However, when called immediately after a user-style action performed via xlwings (like writing a value via the Excel interface), it can be effective.

The syntax for invoking the Undo method in xlwings is straightforward, as it does not take any parameters. The call is made through the Application object accessed from an xlwings App or Book instance. The general format is:

app.api.Undo()

Here, app refers to the xlwings App object representing the Excel application instance. The api property provides the native Excel Application COM object, and Undo() is the method call. No arguments are required or accepted. The method will reverse the last action if an undo history is available; otherwise, it may have no effect or raise an error in some scenarios.

For example, consider a scenario where a user manually types a value into a cell in an open Excel workbook, and then a script needs to undo that action. The following xlwings code demonstrates this:

import xlwings as xw

# Connect to the active Excel instance
app = xw.apps.active

# Assume a user just typed "Test" into cell A1 of the active sheet manually
# To undo that entry programmatically:
app.api.Undo()

# This will revert the change in cell A1, restoring its previous value or clearing it if it was empty.

Another example involves performing an action through xlwings that mimics user interaction, followed by an undo. Note that not all xlwings operations populate the undo stack, as many bypass the UI. However, using Range.value setter might be treated as a user action in some contexts. A more reliable approach is to simulate keystrokes or use SendKeys, but a simpler method is to leverage Excel’s Application.Run to execute a macro that performs the action, which can then be undone. Below is an illustrative code snippet that writes a value using the Excel interface via Application.Run and then undoes it:

import xlwings as xw

app = xw.apps.active
wb = app.books.active
sheet = wb.sheets[0]

# Use Application.Run to execute a VBA-like operation that can be undone
# First, define a simple VBA function in a module (this requires VBA access; alternatively, use a pre-existing macro)
# For demonstration, assume a macro named "WriteValue" exists that writes to cell B2.
# Since xlwings can run macros, we can call it and then undo.
wb.api.Run("WriteValue") # This macro might set cell B2 to "Hello"
app.api.Undo() # This should undo the macro's action, reverting cell B2