Archive

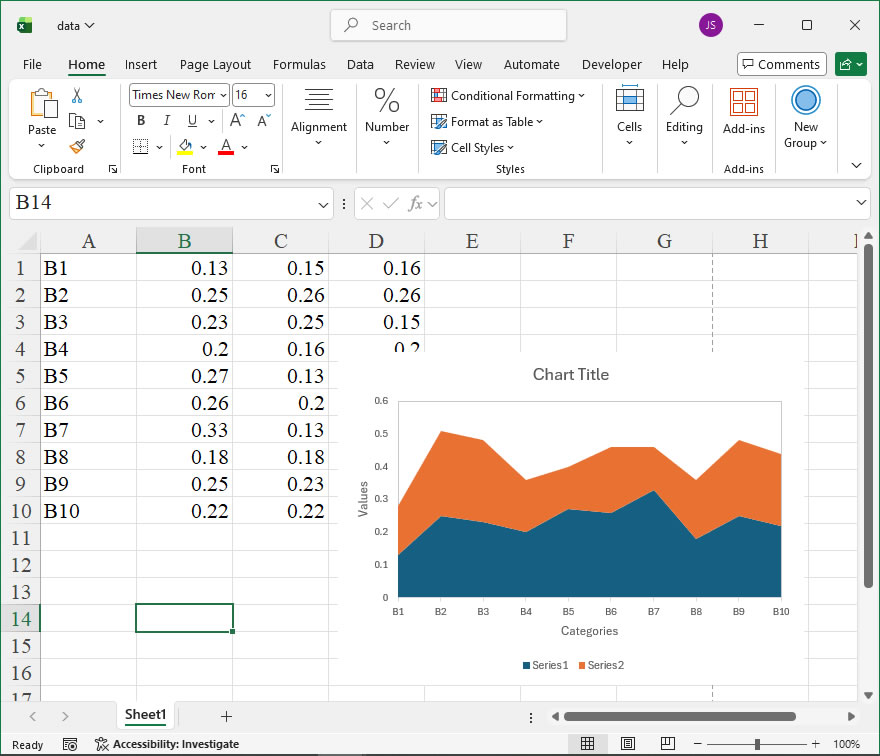
How To Create Stacked Area Chart Using xlwings?

Example

Code

import xlwings as xw
import os

def set_style(cht):
    cht.ChartArea.Format.Line.Visible=False
    cht.PlotArea.Format.Fill.Visible = False
    cht.PlotArea.Format.Line.Visible = True
    cht.PlotArea.Format.Line.ForeColor.RGB=xw.utils.rgb_to_int((200,200,200))
    #cht.PlotArea.Format.Line.ForeColor.ObjectThemeColor = msoThemeColorText1
    ax1 = cht.Axes(1)
    ax2 = cht.Axes(2)
    ax1.HasTitle = True
    ax1.AxisTitle.Text = 'Categories'
    ax1.AxisTitle.Font.Size = 10
    ax1.TickLabels.Font.Size = 8
    #ax1.TickLabels.NumberFormat = '0.00'
    ax1.HasMajorGridlines = False
    ax2.HasTitle = True
    ax2.AxisTitle.Text = 'Values'
    ax2.AxisTitle.Font.Size = 10
    ax2.TickLabels.Font.Size = 8
    ax2.HasMajorGridlines = False
    cht.HasTitle = True
    #cht.ChartTitle.Caption = 'Plot'
    #cht.ChartTitle.Font.Size = 12

root=os.getcwd()
app=xw.App(visible=True,add_book=False)
wb=app.books.open(root+r'/data.xlsx',read_only=False)
sht=wb.sheets('Sheet1')

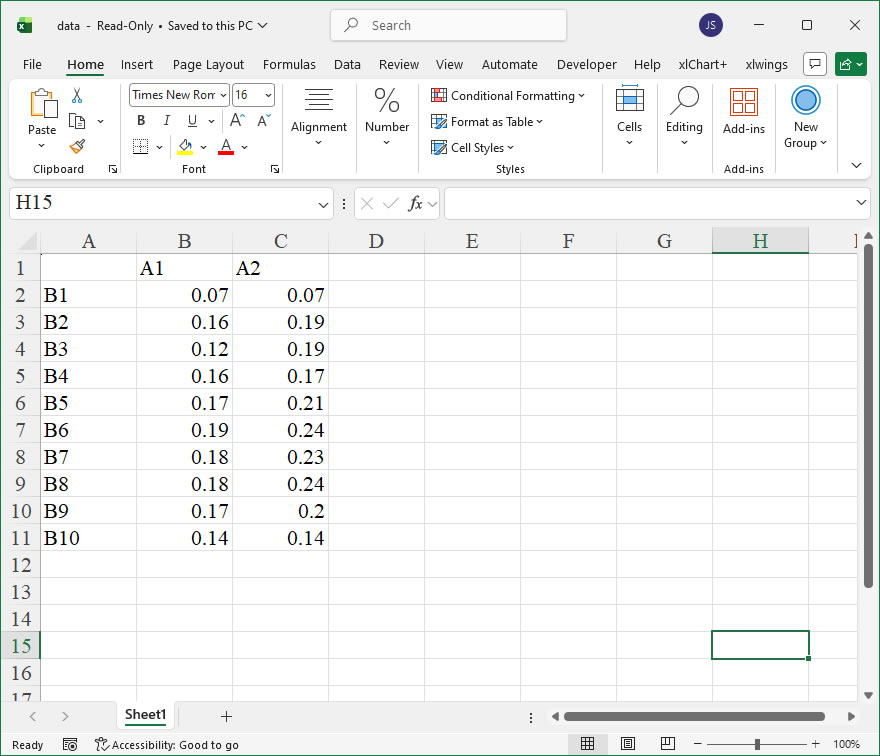
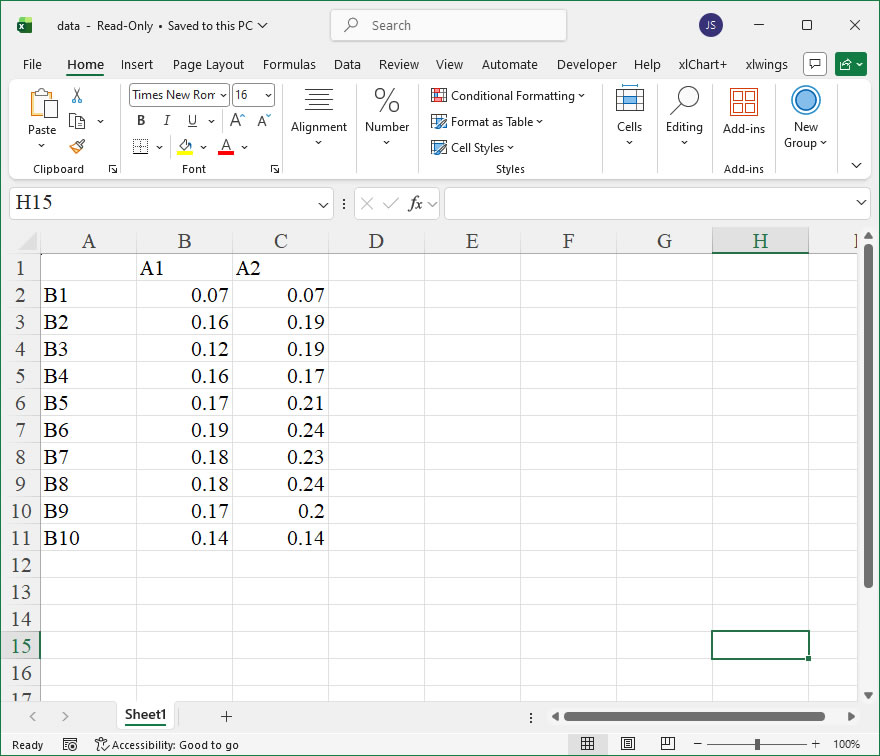
sht.api.Range('A1:C10').Select()  #
shp=sht.api.Shapes.AddChart2(-1,xw.constants.ChartType.xlAreaStacked,20,20,350,250,True)
cht=shp.Chart  #

set_style(cht)

cht.Export(root+'/cht.jpg')
cht.Export(root+'/cht.svg')
cht.ExportAsFixedFormat(0,root+'/cht.pdf')

#wb.save()
#app.kill()

How to use Application.ActiveSheet in the xlwings API way

In the Excel object model, the Application object represents the entire Excel application, and its ActiveSheet property is crucial for interacting with the currently active worksheet in the active workbook. This is particularly useful in automation scripts where operations need to be performed on the sheet that the user is currently viewing or has selected. In xlwings, a powerful Python library for Excel automation, the ActiveSheet property can be accessed through the App object, which corresponds to the Excel Application. This property returns a Sheet object, enabling developers to read, write, and manipulate data, formats, and other elements directly on the active sheet without needing to reference it by name. This dynamic access simplifies code when dealing with user interactions or when the active sheet changes during runtime.

The syntax for accessing the ActiveSheet property in xlwings is straightforward. After establishing a connection to Excel (either by creating a new instance or connecting to an existing one), you can retrieve the active sheet using the App object. The general format is as follows:

import xlwings as xw

# Connect to the active instance of Excel
app = xw.apps.active

# Access the active sheet
active_sheet = app.active_sheet

Here, app represents the Application object in Excel, and active_sheet is a Sheet object in xlwings. This property does not take any parameters, as it simply returns the currently active worksheet. If no workbook is open or no sheet is active, it may raise an error, so it’s good practice to handle such scenarios with error checking. The returned Sheet object can then be used to call various methods and properties, such as range, cells, or name, to perform specific tasks.

For example, to read data from a specific cell on the active sheet, you can use the range method. Suppose you want to get the value from cell A1 on the active sheet. The code would be:

import xlwings as xw

# Connect to Excel
app = xw.apps.active

# Get the active sheet
active_sheet = app.active_sheet

# Read the value from cell A1
cell_value = active_sheet.range('A1').value
print(f"The value in A1 is: {cell_value}")

This example demonstrates how ActiveSheet provides a direct entry point to the user’s current context in Excel. Another common use case is to write data to the active sheet. For instance, you might want to insert a timestamp or update a cell with calculated results. Here’s how you can set a value in cell B2:

import xlwings as xw
from datetime import datetime

app = xw.apps.active
active_sheet = app.active_sheet

# Write the current date and time to cell B2
active_sheet.range('B2').value = datetime.now()
print("Timestamp added to B2.")

Additionally, you can perform more complex operations, such as clearing contents or formatting. To clear all data from the active sheet, use the clear method:

import xlwings as xw

app = xw.apps.active
active_sheet = app.active_sheet

# Clear all contents and formats from the active sheet
active_sheet.clear()
print("Active sheet cleared.")

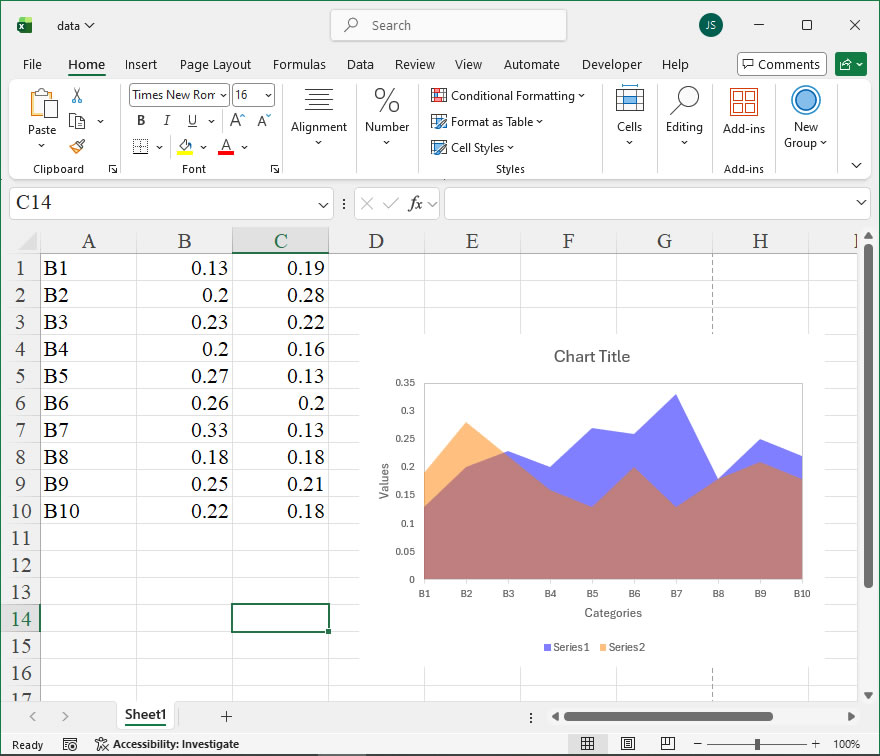
How To Create Complex Area Chart Using xlwings?

Example

Code

import xlwings as xw
import os

def set_style(cht):
    cht.ChartArea.Format.Line.Visible=False
    cht.PlotArea.Format.Fill.Visible = False
    cht.PlotArea.Format.Line.Visible = True
    cht.PlotArea.Format.Line.ForeColor.RGB=xw.utils.rgb_to_int((200,200,200))
    #cht.PlotArea.Format.Line.ForeColor.ObjectThemeColor = msoThemeColorText1
    ax1 = cht.Axes(1)
    ax2 = cht.Axes(2)
    ax1.HasTitle = True
    ax1.AxisTitle.Text = 'Categories'
    ax1.AxisTitle.Font.Size = 10
    ax1.TickLabels.Font.Size = 8
    #ax1.TickLabels.NumberFormat = '0.00'
    ax1.HasMajorGridlines = False
    ax2.HasTitle = True
    ax2.AxisTitle.Text = 'Values'
    ax2.AxisTitle.Font.Size = 10
    ax2.TickLabels.Font.Size = 8
    ax2.HasMajorGridlines = False
    cht.HasTitle = True
    #cht.ChartTitle.Caption = 'Plot'
    #cht.ChartTitle.Font.Size = 12

root=os.getcwd()
app=xw.App(visible=True,add_book=False)
wb=app.books.open(root+r'/data.xlsx',read_only=False)
sht=wb.sheets('Sheet1')

sht.api.Range('A1:C10').Select()  #
shp=sht.api.Shapes.AddChart2(-1,xw.constants.ChartType.xlArea,20,20,350,250,True)
cht=shp.Chart  #
cht.SeriesCollection(1).Format.Fill.ForeColor.RGB=xw.utils.rgb_to_int((0,176,80))
cht.SeriesCollection(1).Format.Fill.ForeColor.RGB=xw.utils.rgb_to_int((0,0,255))
cht.SeriesCollection(2).Format.Fill.ForeColor.RGB=xw.utils.rgb_to_int((255,128,0))
cht.SeriesCollection(1).Format.Fill.Transparency=0.5
cht.SeriesCollection(2).Format.Fill.Transparency=0.5

set_style(cht)

cht.Export(root+'/cht.jpg')
cht.Export(root+'/cht.svg')
cht.ExportAsFixedFormat(0,root+'/cht.pdf')

#wb.save()
#app.kill()

How to use Application.ActiveProtectedViewWindow in the xlwings API way

The ActiveProtectedViewWindow property of the Application object in Excel returns a ProtectedViewWindow object that represents the active Protected View window. This is particularly useful when working with files opened in Protected View, a security feature that opens potentially unsafe files (like those from the internet) in a restricted mode to prevent malicious code from running. Through xlwings, you can access this property to interact with the active Protected View window, such as checking its existence, obtaining details about the opened file, or even closing it. This enables automation scripts to handle files that trigger Protected View, ensuring robust workflow management even with security-restricted documents.

Syntax in xlwings:

app.active_protected_view_window
  • Return Value: This property returns an xlwings ProtectedViewWindow object if there is an active Protected View window. If no Protected View window is active, it returns None.
  • Parameters: The property does not accept any parameters.
  • Important: The ActiveProtectedViewWindow property is only available and meaningful when Excel has a file open in Protected View. Attempting to access it when no Protected View window is active will simply return None, so it’s essential to check for this condition in your code.

Examples of xlwings API Usage:

  1. Checking for an Active Protected View Window:
    This example demonstrates how to verify if a file is currently open in Protected View and print a message accordingly.
import xlwings as xw

app = xw.apps.active # Get the active Excel application
pv_window = app.active_protected_view_window

if pv_window is not None:
    print(f"A Protected View window is active. Source: {pv_window.source_name}")
else:
    print("No active Protected View window found.")
  1. Closing the Active Protected View Window:
    In this scenario, the script closes the active Protected View window. This is useful for automating the process of exiting Protected View, perhaps to proceed with editing the file programmatically.
import xlwings as xw

app = xw.apps.active
pv_window = app.active_protected_view_window

if pv_window:
    print(f"Closing Protected View window for: {pv_window.source_name}")
    pv_window.close() # Closes the Protected View window
else:
    print("No window to close.")
  1. Accessing File Information from Protected View:
    Here, we retrieve and display details about the file in Protected View, such as its name and path, which can be logged or used for further processing.
import xlwings as xw

app = xw.apps.active
pv_window = app.active_protected_view_window

if pv_window:
    print(f"File in Protected View: {pv_window.source_name}")
    print(f"File path: {pv_window.source_path}")
    # The workbook object in Protected View is read-only; you can access data but not modify it.
    wb = pv_window.workbook
    print(f"Workbook name: {wb.name}")

How To Create Simple Area Chart Using xlwings?

Example

Code

import xlwings as xw
import os

def set_style(cht):
    cht.ChartArea.Format.Line.Visible=False
    cht.PlotArea.Format.Fill.Visible = False
    cht.PlotArea.Format.Line.Visible = True
    cht.PlotArea.Format.Line.ForeColor.RGB=xw.utils.rgb_to_int((200,200,200))
    #cht.PlotArea.Format.Line.ForeColor.ObjectThemeColor = msoThemeColorText1
    ax1 = cht.Axes(1)
    ax2 = cht.Axes(2)
    ax1.HasTitle = True
    ax1.AxisTitle.Text = 'Categories'
    ax1.AxisTitle.Font.Size = 10
    ax1.TickLabels.Font.Size = 8
    #ax1.TickLabels.NumberFormat = '0.00'
    ax1.HasMajorGridlines = False
    ax2.HasTitle = True
    ax2.AxisTitle.Text = 'Values'
    ax2.AxisTitle.Font.Size = 10
    ax2.TickLabels.Font.Size = 8
    ax2.HasMajorGridlines = False
    cht.HasTitle = True
    #cht.ChartTitle.Caption = 'Plot'
    #cht.ChartTitle.Font.Size = 12

root=os.getcwd()
app=xw.App(visible=True,add_book=False)
wb=app.books.open(root+r'/data.xlsx',read_only=False)
sht=wb.sheets('Sheet1')

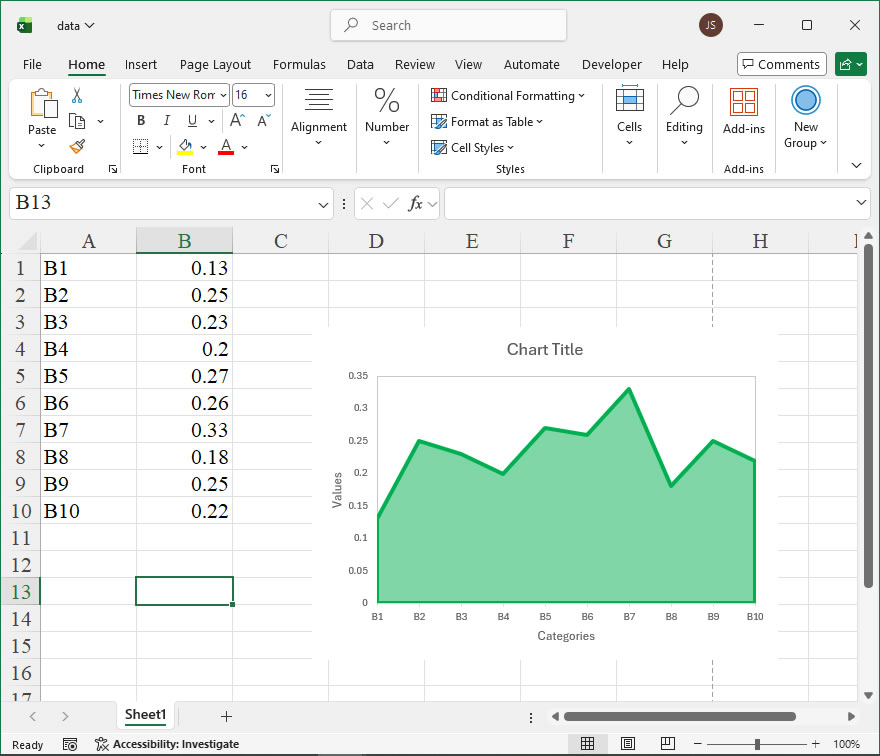
sht.api.Range('A1:B10').Select()  #
shp=sht.api.Shapes.AddChart2(-1,xw.constants.ChartType.xlArea,20,20,350,250,True)
cht=shp.Chart  #
cht.SeriesCollection(1).Format.Fill.ForeColor.RGB=xw.utils.rgb_to_int((0,176,80))
cht.SeriesCollection(1).Format.Fill.Transparency=0.5
cht.SeriesCollection(1).Format.Line.ForeColor.RGB=xw.utils.rgb_to_int((0,176,80))
cht.SeriesCollection(1).Format.Line.Weight=3

set_style(cht)

cht.Export(root+'/cht.jpg')
cht.Export(root+'/cht.svg')
cht.ExportAsFixedFormat(0,root+'/cht.pdf')

#wb.save()
#app.kill()

How to use Application.ActivePrinter in the xlwings API way

The ActivePrinter property of the Application object in Excel’s object model is accessible through the xlwings library, enabling Python scripts to retrieve or set the name of the currently active printer for the Excel application. This is particularly useful for automating print-related tasks, such as ensuring reports are sent to a specific printer without manual intervention, or for auditing and logging which printer is set as default within a workbook session. By using xlwings, you can integrate this Excel functionality directly into Python workflows, allowing for seamless control over printing configurations in automated processes.

Syntax in xlwings:
In xlwings, the ActivePrinter property is accessed through the app object, which represents the Excel application. The property is both readable and writable, meaning you can get the current printer name or change it programmatically. The syntax is straightforward:

  • To get the active printer: app.active_printer
  • To set the active printer: app.active_printer = "Printer Name"
    The property returns or accepts a string value representing the printer name. The name should match exactly as configured in the system, including any driver or port details if applicable. For example, on Windows, it might appear as “HP LaserJet on Ne00:” or a similar format. If the specified printer is not available, Excel may default to another or throw an error, so it’s advisable to verify printer availability beforehand.

Code Examples with xlwings:
Here are practical examples demonstrating how to use the ActivePrinter property in xlwings:

  1. Retrieving the Current Active Printer:
    This example connects to a running Excel instance, retrieves the active printer name, and prints it to the console. It’s useful for diagnostics or logging.
import xlwings as xw
# Connect to the active Excel application
app = xw.apps.active
# Get the active printer name
current_printer = app.active_printer
print(f"The active printer is: {current_printer}")
  1. Setting the Active Printer to a Specific Device:
    This example sets the active printer to a desired printer, such as “Brother MFC-L2750DW series Printer” on a Windows system. Ensure the printer name is accurate to avoid issues.
import xlwings as xw
# Start or connect to Excel
app = xw.App(visible=True) # Open Excel visibly
# Set the active printer
app.active_printer = "Brother MFC-L2750DW series Printer on Ne00:"
# Confirm the change by printing the updated name
print(f"Printer set to: {app.active_printer}")
# Perform other tasks, like printing a workbook
app.books.add().api.PrintOut() # Example print command
app.quit() # Close Excel
  1. Switching Printers Based on Conditions:
    In automated reporting, you might switch printers depending on the document type. This example checks the current printer and changes it if needed.
import xlwings as xw
app = xw.apps.active
# Define printer names (adjust based on your setup)
default_printer = "Microsoft Print to PDF"
backup_printer = "HP OfficeJet Pro 8720 on Ne01:"
# Get current printer
if app.active_printer == default_printer:
    # Switch to backup for high-volume printing
    app.active_printer = backup_printer
    print(f"Switched to backup printer: {backup_printer}")
else:
    print(f"Using current printer: {app.active_printer}")

How To Create 3D Bar Chart Using xlwings?

Example

Code

import xlwings as xw
import os

def set_style(cht):
    cht.ChartArea.Format.Line.Visible=False
    cht.PlotArea.Format.Fill.Visible = False
    cht.PlotArea.Format.Line.Visible = False
    cht.PlotArea.Format.Line.ForeColor.RGB=xw.utils.rgb_to_int((200,200,200))
    #cht.PlotArea.Format.Line.ForeColor.ObjectThemeColor = msoThemeColorText1
    ax1 = cht.Axes(1)
    ax2 = cht.Axes(2)
    ax1.HasTitle = True
    ax1.AxisTitle.Text = 'Categories'
    ax1.AxisTitle.Font.Size = 10
    ax1.TickLabels.Font.Size = 8
    #ax1.TickLabels.NumberFormat = '0.00'
    ax1.HasMajorGridlines = True
    ax2.HasTitle = True
    ax2.AxisTitle.Text = 'Values'
    ax2.AxisTitle.Font.Size = 10
    ax2.TickLabels.Font.Size = 8
    ax2.HasMajorGridlines = True
    cht.HasTitle = True
    #cht.ChartTitle.Caption = 'Plot'
    #cht.ChartTitle.Font.Size = 12

root=os.getcwd()
app=xw.App(visible=True,add_book=False)
wb=app.books.open(root+r'/data.xlsx',read_only=False)
sht=wb.sheets('Sheet1')

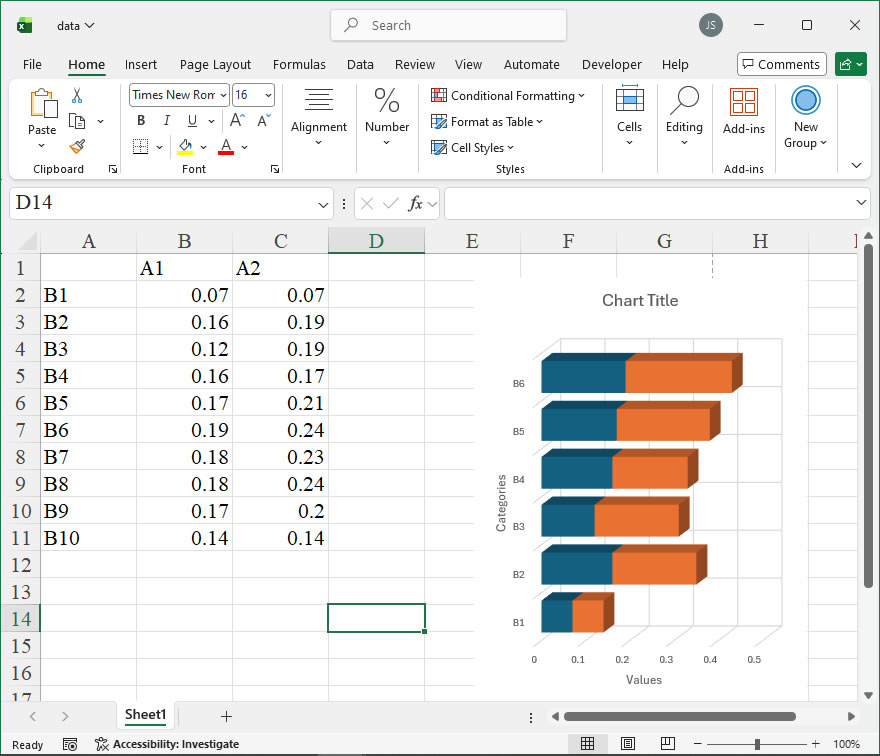
sht.api.Range('A2:D7').Select()  #
shp=sht.api.Shapes.AddChart2(-1,xw.constants.ChartType.xl3DBarStacked,20,20,250,350,True)
cht=shp.Chart  #
cht.ChartGroups(1).GapWidth=50

set_style(cht)

cht.Export(root+'/cht.jpg')
cht.Export(root+'/cht.svg')
cht.ExportAsFixedFormat(0,root+'/cht.pdf')

#wb.save()
#app.kill()

How to use Application.ActiveEncryptionSession in the xlwings API way

The ActiveEncryptionSession property of the Application object in Excel is a read-only property that returns an EncryptionSession object. This property is particularly useful when you are working with encrypted workbooks or files that have Information Rights Management (IRM) restrictions. It provides access to the current encryption session, allowing you to retrieve details about the encryption method, permissions, and other security-related settings that are active for the workbook. This can be essential for automating security audits, managing document access programmatically, or integrating Excel with custom security protocols.

In the xlwings library, which enables Python to interact with Excel via its COM interface, you can access this property through the Application object. The syntax for accessing ActiveEncryptionSession in xlwings is straightforward. Since xlwings mirrors the Excel object model, you typically start by connecting to an Excel instance or creating one, then access the Application object, and finally call the property.

Syntax in xlwings:

encryption_session = app.api.ActiveEncryptionSession

Here, app refers to the xlwings App object, which represents the Excel application. The .api attribute provides direct access to the underlying COM object, allowing you to use Excel’s native properties and methods. The ActiveEncryptionSession property does not take any parameters. It returns an EncryptionSession object, which has its own properties and methods. If no encryption session is active (e.g., the workbook is not encrypted or IRM is not applied), this property may return None or raise an error, so it’s good practice to handle such cases.

Key Points:

  • Return Value: An EncryptionSession object that contains information about the current encryption. This object can have properties like ProviderId, AlgorithmId, BlockSize, KeyLength, and methods to check permissions.
  • Usage Context: Primarily used with workbooks that are encrypted or protected via IRM. It is not applicable for standard, unencrypted files.
  • Error Handling: Always check if the returned object is valid before accessing its properties to avoid runtime errors.

Example Code in xlwings:
Below is a practical example demonstrating how to use the ActiveEncryptionSession property in a Python script with xlwings. This example assumes Excel is running with an encrypted workbook open.

import xlwings as xw

# Connect to the active Excel instance
app = xw.apps.active

# Access the ActiveEncryptionSession property
try:
    encryption_session = app.api.ActiveEncryptionSession

    # Check if an encryption session exists
    if encryption_session is not None:
        # Retrieve encryption details
        provider_id = encryption_session.ProviderId
        algorithm_id = encryption_session.AlgorithmId
        key_length = encryption_session.KeyLength

        print(f"Encryption Provider ID: {provider_id}")
        print(f"Encryption Algorithm ID: {algorithm_id}")
        print(f"Key Length: {key_length}")

    # Example: Check if the session has specific permissions
    # Note: Actual properties may vary based on Excel version and encryption type
    # This is illustrative; refer to Excel's object model for exact properties.
    else:
        print("No active encryption session found. The workbook may not be encrypted.")
except Exception as e:
    print(f"An error occurred: {e}")

In this example, we first connect to the active Excel application using xw.apps.active. Then, we use app.api.ActiveEncryptionSession to get the encryption session object. We retrieve details like the provider and algorithm IDs, and the key length, printing them to the console. Error handling is included to manage cases where no session exists or if there are compatibility issues.

Considerations:

  • The availability and behavior of the ActiveEncryptionSession property can depend on the version of Excel and the type of encryption used (e.g., password-based encryption vs. IRM). It’s recommended to test with your specific environment.
  • xlwings provides a high-level API, but for advanced properties like this, using .api to access the raw COM object is necessary. Ensure that your Python environment has the necessary permissions to interact with Excel’s COM interface.
  • This property is part of Excel’s security features, so it might be subject to system policies or require certain add-ins to be enabled.

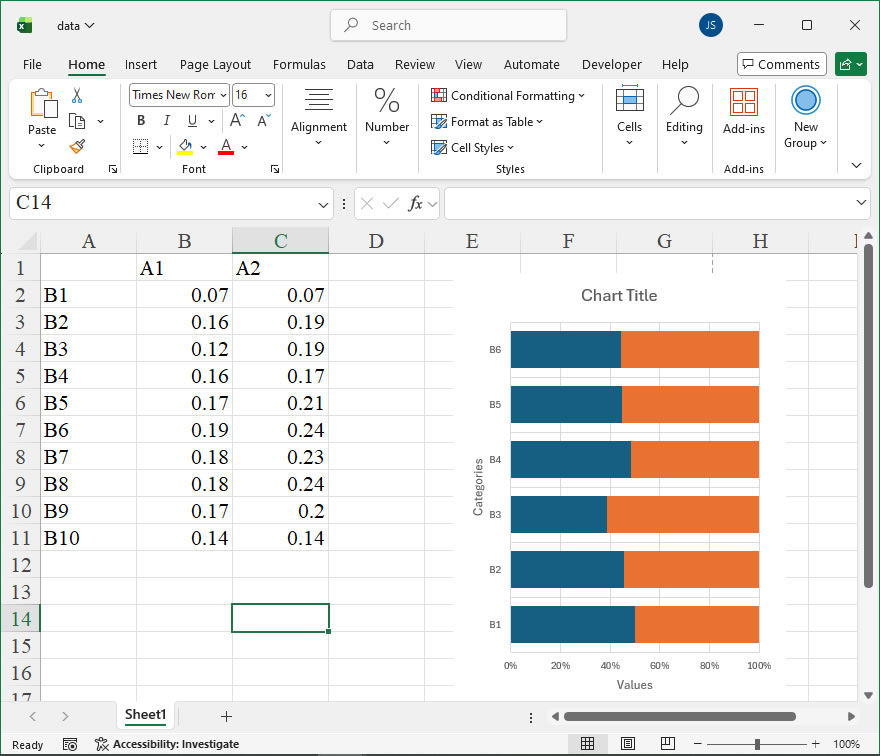
How To Create 100% Stacked Bar Chart Using xlwings?

Example

Code

import xlwings as xw
import os

def set_style(cht):
    cht.ChartArea.Format.Line.Visible=False
    cht.PlotArea.Format.Fill.Visible = False
    cht.PlotArea.Format.Line.Visible = False
    cht.PlotArea.Format.Line.ForeColor.RGB=xw.utils.rgb_to_int((200,200,200))
    #cht.PlotArea.Format.Line.ForeColor.ObjectThemeColor = msoThemeColorText1
    ax1 = cht.Axes(1)
    ax2 = cht.Axes(2)
    ax1.HasTitle = True
    ax1.AxisTitle.Text = 'Categories'
    ax1.AxisTitle.Font.Size = 10
    ax1.TickLabels.Font.Size = 8
    #ax1.TickLabels.NumberFormat = '0.00'
    ax1.HasMajorGridlines = True
    ax2.HasTitle = True
    ax2.AxisTitle.Text = 'Values'
    ax2.AxisTitle.Font.Size = 10
    ax2.TickLabels.Font.Size = 8
    ax2.HasMajorGridlines = True
    cht.HasTitle = True
    #cht.ChartTitle.Caption = 'Plot'
    #cht.ChartTitle.Font.Size = 12

root=os.getcwd()
app=xw.App(visible=True,add_book=False)
wb=app.books.open(root+r'/data.xlsx',read_only=False)
sht=wb.sheets('Sheet1')

sht.api.Range('A2:D7').Select()  #
shp=sht.api.Shapes.AddChart2(-1,xw.constants.ChartType.xlBarStacked100,20,20,250,350,True)
cht=shp.Chart  #
cht.ChartGroups(1).GapWidth=50

set_style(cht)

cht.Export(root+'/cht.jpg')
cht.Export(root+'/cht.svg')
cht.ExportAsFixedFormat(0,root+'/cht.pdf')

#wb.save()
#app.kill()

How to use Application.ActiveChart in the xlwings API way

The Application.ActiveChart property in Excel’s object model is a powerful feature that allows developers to programmatically access and manipulate the currently active chart within an Excel application instance. In xlwings, a Python library that bridges Python and Excel on Windows and macOS, this property is exposed through the api property of the App or Book objects, providing a direct gateway to the underlying COM (Component Object Model) or AppleScript engine. This enables seamless automation of chart-related tasks, such as modifying data series, updating formatting, or extracting chart properties, directly from a Python script.

Functionality
The primary purpose of Application.ActiveChart is to retrieve a reference to the chart that is currently active (i.e., selected or in focus) in the Excel user interface. If no chart is active, accessing this property will return None or raise an error, depending on the context. This property is read-only; you cannot set it to activate a specific chart. Instead, it serves as a starting point for any subsequent operations on the active chart, such as changing its type, adjusting axis scales, or exporting it as an image.

Syntax and Parameters
In xlwings, you access this property via the api property of an App or Book object. The syntax is straightforward, as it does not accept any parameters:

active_chart = xw.apps[0].api.ActiveChart
# Or, if working with a specific workbook:
# active_chart = xw.books['MyWorkbook.xlsx'].api.ActiveChart

Here, xw.apps[0] refers to the first Excel application instance opened, and .api provides access to the native Excel object model. The returned active_chart is a COM object representing the active chart, which you can then use with other xlwings api calls or convert to an xlwings Chart object for more Pythonic interaction. Note that if no chart is active, active_chart will be None, so it’s good practice to check for this condition before proceeding.

Code Examples
Below are practical examples demonstrating how to use Application.ActiveChart with xlwings:

  1. Check if a Chart is Active and Retrieve Its Title:
    This example verifies whether a chart is active and prints its title if available.
import xlwings as xw

# Connect to the active Excel instance
app = xw.apps.active
active_chart = app.api.ActiveChart

if active_chart is not None:
    chart_title = active_chart.ChartTitle.Text
    print(f"Active chart title: {chart_title}")
else:
    print("No chart is currently active.")
  1. Modify the Chart Type of the Active Chart:
    Here, we change the active chart to a clustered column chart, using the Excel constant xlColumnClustered (value 51).
import xlwings as xw

app = xw.apps.active
active_chart = app.api.ActiveChart

if active_chart is not None:
    # Change chart type to clustered column
    active_chart.ChartType = 51 # xlColumnClustered
    print("Chart type updated to clustered column.")
else:
    print("No active chart to modify.")
  1. Extract Data from the Active Chart’s Series:
    This code snippet loops through each series in the active chart and prints its values and X-axis values.
import xlwings as xw

app = xw.apps.active
active_chart = app.api.ActiveChart

if active_chart is not None:
    for series in active_chart.SeriesCollection():
        series_name = series.Name
        series_values = series.Values
        x_values = series.XValues
        print(f"Series: {series_name}, Values: {series_values}, X Values: {x_values}")
  1. Export the Active Chart as an Image:
    The following example exports the active chart to a PNG file in the current directory.
import xlwings as xw
import os

app = xw.apps.active
active_chart = app.api.ActiveChart

if active_chart is not None:
    export_path = os.path.join(os.getcwd(), 'active_chart.png')
    active_chart.Export(export_path)
    print(f"Chart exported to: {export_path}")