Archive

How To Create 3D Cone Column Chart Using xlwings?

Example

Code

import xlwings as xw
import os

def set_style(cht):
    cht.ChartArea.Format.Line.Visible=False
    cht.PlotArea.Format.Fill.Visible = False
    cht.PlotArea.Format.Line.Visible = False
    cht.PlotArea.Format.Line.ForeColor.RGB=xw.utils.rgb_to_int((200,200,200))
    #cht.PlotArea.Format.Line.ForeColor.ObjectThemeColor = msoThemeColorText1
    ax1 = cht.Axes(1)
    ax2 = cht.Axes(2)
    ax1.HasTitle = True
    ax1.AxisTitle.Text = 'Categories'
    ax1.AxisTitle.Font.Size = 10
    ax1.TickLabels.Font.Size = 8
    #ax1.TickLabels.NumberFormat = '0.00'
    ax1.HasMajorGridlines = True
    ax2.HasTitle = True
    ax2.AxisTitle.Text = 'Values'
    ax2.AxisTitle.Font.Size = 10
    ax2.TickLabels.Font.Size = 8
    ax2.HasMajorGridlines = True
    cht.HasTitle = True
    #cht.ChartTitle.Caption = 'Plot'
    #cht.ChartTitle.Font.Size = 12

root=os.getcwd()
app=xw.App(visible=True,add_book=False)
wb=app.books.open(root+r'/data.xlsx',read_only=False)
sht=wb.sheets('Sheet1')

sht.api.Range('A2:C8').Select()  #
shp=sht.api.Shapes.AddChart2(-1,xw.constants.ChartType.xlConeCol,20,20,350,280,True)
cht=shp.Chart  #

set_style(cht)

cht.Export(root+'/cht.jpg')
cht.Export(root+'/cht.svg')
cht.ExportAsFixedFormat(0,root+'/cht.pdf')

#wb.save()
#app.kill()

How to use Application.SharePointVersion in the xlwings API way

The SharePointVersion property of the Application object in Excel’s object model provides a read-only integer value that indicates the version of Microsoft SharePoint Foundation or Microsoft SharePoint Server that the current workbook is linked to, if it is stored on a SharePoint site. This property is particularly useful for developers who need to programmatically determine the SharePoint environment to implement version-specific features or compatibility checks when automating Excel through xlwings. In xlwings, this property is accessed via the api property, which exposes the underlying Excel object model.

Functionality:
The primary function is to identify the SharePoint version, enabling conditional logic in macros or scripts. For instance, certain features or methods may behave differently across SharePoint versions, and knowing the version allows for adaptive code. If the workbook is not stored on SharePoint, the property typically returns 0.

Syntax in xlwings:
The property is accessed through the Application object. In xlwings, after establishing a connection to Excel (usually via app = xw.App() or xw.Book), you can retrieve the value as follows:

import xlwings as xw

# Connect to the active Excel instance or create a new one
app = xw.apps.active # or xw.App() for a new instance
sharepoint_version = app.api.SharePointVersion
  • Parameters: The SharePointVersion property does not take any parameters.
  • Return Value: It returns an integer representing the SharePoint version. Common values include:
  • 0: The workbook is not stored on a SharePoint site, or SharePoint is not detected.
  • 14: Corresponds to SharePoint 2010.
  • 15: Corresponds to SharePoint 2013.
  • 16: Corresponds to SharePoint 2016 or SharePoint Online (Office 365).
  • Other integer values may represent different or future versions.

Example Usage:
Below is a practical xlwings code example that checks the SharePoint version and performs actions based on the result. This example assumes Excel is already running with a workbook open, possibly from a SharePoint location.

import xlwings as xw

def check_sharepoint_version():
# Get the active Excel application
app = xw.apps.active

# Retrieve the SharePoint version
version = app.api.SharePointVersion

# Display or use the version information
if version == 0:
    print("This workbook is not stored on SharePoint.")
elif version == 14:
    print("SharePoint 2010 detected. Implement compatibility for this version.")
# Add version-specific code here, e.g., adjust data connection settings
elif version == 15:
    print("SharePoint 2013 detected. Features for this version are available.")
elif version == 16:
    print("SharePoint 2016 or SharePoint Online detected. Use modern APIs.")
else:
    print(f"Unknown SharePoint version: {version}. Check for updates.")

# You can also use the value in conditional logic for further automation
if version >= 16:
# Example: Enable newer SharePoint integration features
    print("Proceeding with advanced SharePoint functionalities.")
    return version

# Run the function
if __name__ == "__main__":
    sharepoint_ver = check_sharepoint_version()
    print(f"SharePoint Version Code: {sharepoint_ver}")

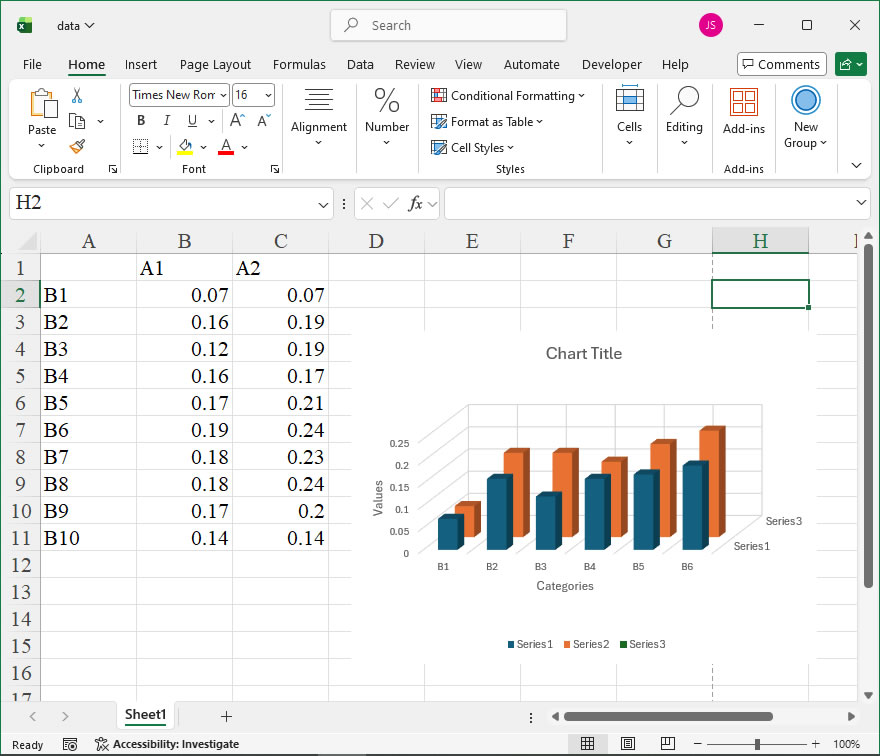
How To Create 3D Column Chart Using xlwings?

Example

Code

import xlwings as xw
import os

def set_style(cht):
    cht.ChartArea.Format.Line.Visible=False
    cht.PlotArea.Format.Fill.Visible = False
    cht.PlotArea.Format.Line.Visible = False
    cht.PlotArea.Format.Line.ForeColor.RGB=xw.utils.rgb_to_int((200,200,200))
    #cht.PlotArea.Format.Line.ForeColor.ObjectThemeColor = msoThemeColorText1
    ax1 = cht.Axes(1)
    ax2 = cht.Axes(2)
    ax1.HasTitle = True
    ax1.AxisTitle.Text = 'Categories'
    ax1.AxisTitle.Font.Size = 10
    ax1.TickLabels.Font.Size = 8
    #ax1.TickLabels.NumberFormat = '0.00'
    ax1.HasMajorGridlines = True
    ax2.HasTitle = True
    ax2.AxisTitle.Text = 'Values'
    ax2.AxisTitle.Font.Size = 10
    ax2.TickLabels.Font.Size = 8
    ax2.HasMajorGridlines = True
    cht.HasTitle = True
    #cht.ChartTitle.Caption = 'Plot'
    #cht.ChartTitle.Font.Size = 12

root=os.getcwd()
app=xw.App(visible=True,add_book=False)
wb=app.books.open(root+r'/data.xlsx',read_only=False)
sht=wb.sheets('Sheet1')

sht.api.Range('A2:D7').Select()  #
shp=sht.api.Shapes.AddChart2(-1,xw.constants.ChartType.xl3DColumn,20,20,350,250,True)
cht=shp.Chart  #
#cht.ChartGroups(1).GapWidth=50

set_style(cht)

cht.Export(root+'/cht.jpg')
cht.Export(root+'/cht.svg')
cht.ExportAsFixedFormat(0,root+'/cht.pdf')

#wb.save()
#app.kill()

How to use Application.SendKeys in the xlwings API way

The SendKeys member of the Application object in Excel is a powerful method for simulating keystrokes directly to the active application window, typically Excel itself. In xlwings, this functionality is exposed through the api property, allowing you to programmatically send key combinations that would normally be entered manually. This can be used to automate tasks like opening menus, triggering shortcuts, or interacting with dialog boxes, especially when other programmatic methods are limited. It’s particularly useful for legacy automation scenarios where UI interaction is required.

Syntax in xlwings:
The syntax follows the Excel Object Model via the xlwings api:

app.api.SendKeys(Keys, Wait)
  • Keys: A string expression specifying the keystrokes to send. Use codes like "{F5}" for function keys, "^c" for Ctrl+C, or "%f" for Alt+f. Special keys are enclosed in braces (e.g., "{ENTER}", "{TAB}"). To send literal characters, simply type them.
  • Wait: Optional Boolean. If True, Excel waits for the keys to be processed before continuing. If False or omitted, the macro continues immediately without waiting. Default is False.

Key Code Examples:

Key CombinationCode String
Enter"{ENTER}"
Ctrl+A"^a"
Alt+F4"%{F4}"
Shift+Tab"+{TAB}"
Page Down"{PGDN}"

Examples in xlwings:

  1. Activate the Find Dialog (Ctrl+F):
import xlwings as xw
app = xw.apps.active # Get the active Excel application
app.api.SendKeys("^f") # Send Ctrl+F to open Find
  1. Refresh All Data Connections (Alt+F5):
app.api.SendKeys("%{F5}", Wait=True) # Alt+F5 and wait for completion
  1. Navigate and Select a Cell Range:
app.api.SendKeys("{F5}") # Open Go To dialog
app.api.SendKeys("A1:D10{ENTER}") # Type range and press Enter
  1. Close the Active Workbook with Save Prompt (Alt+F, then C):
app.api.SendKeys("%fc") # Alt+F to open File menu, then C for Close
# Note: This may interact with save dialogs; handle with caution.

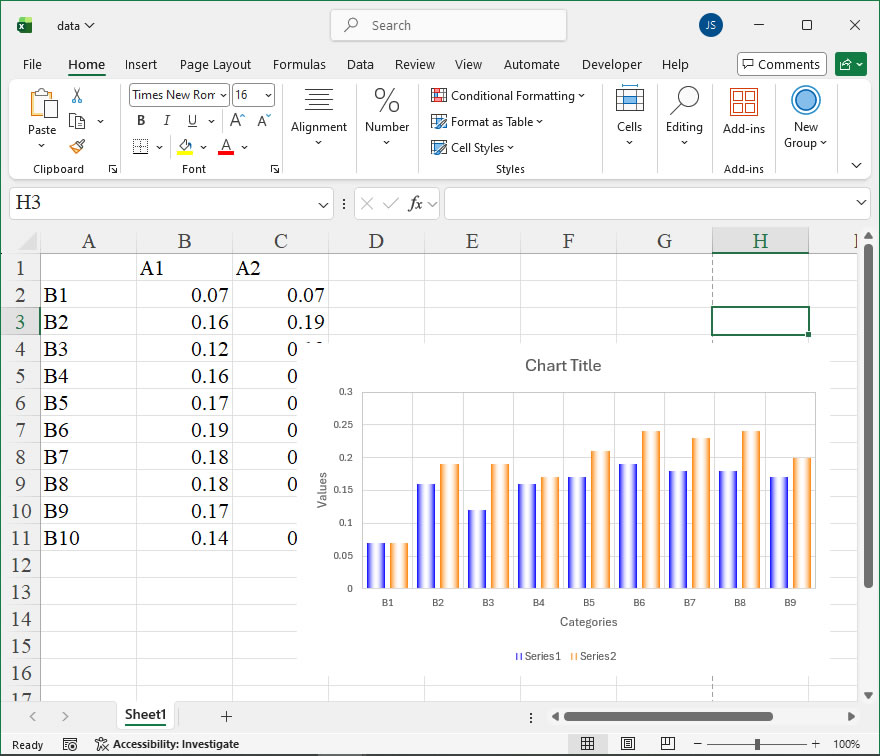
How To Create Horizontal Gradient Filled Clustered Column Chart Using xlwings?

Example

Code

import xlwings as xw
import os

def set_style(cht):
    cht.ChartArea.Format.Line.Visible=False
    cht.PlotArea.Format.Fill.Visible = False
    cht.PlotArea.Format.Line.Visible = True
    cht.PlotArea.Format.Line.ForeColor.RGB=xw.utils.rgb_to_int((200,200,200))
    #cht.PlotArea.Format.Line.ForeColor.ObjectThemeColor = msoThemeColorText1
    ax1 = cht.Axes(1)
    ax2 = cht.Axes(2)
    ax1.HasTitle = True
    ax1.AxisTitle.Text = 'Categories'
    ax1.AxisTitle.Font.Size = 10
    ax1.TickLabels.Font.Size = 8
    #ax1.TickLabels.NumberFormat = '0.00'
    ax1.HasMajorGridlines = True
    ax2.HasTitle = True
    ax2.AxisTitle.Text = 'Values'
    ax2.AxisTitle.Font.Size = 10
    ax2.TickLabels.Font.Size = 8
    ax2.HasMajorGridlines = True
    cht.HasTitle = True
    #cht.ChartTitle.Caption = 'Plot'
    #cht.ChartTitle.Font.Size = 12

root=os.getcwd()
app=xw.App(visible=True,add_book=False)
wb=app.books.open(root+r'/data.xlsx',read_only=False)
sht=wb.sheets('Sheet1')

sht.api.Range('A2:C10').Select()  #
shp=sht.api.Shapes.AddChart2(-1,xw.constants.ChartType.xlColumnClustered,20,20,400,250,True)
cht=shp.Chart  #
cht.ChartGroups(1).GapWidth=50
cht.SeriesCollection(1).Format.Fill.ForeColor.RGB=xw.utils.rgb_to_int((0,0,255))
cht.SeriesCollection(1).Format.Fill.OneColorGradient(2,1,1)    #msoGradientVertical
cht.SeriesCollection(1).Format.Fill.GradientStops.Insert(xw.utils.rgb_to_int((255,255,255)),0.5)
cht.SeriesCollection(1).Format.Fill.GradientStops.Delete(2)
cht.SeriesCollection(1).Format.Fill.GradientStops.Insert(xw.utils.rgb_to_int((0,0,255)),1)
  
cht.SeriesCollection(2).Format.Fill.ForeColor.RGB=xw.utils.rgb_to_int((255,128,0))
cht.SeriesCollection(2).Format.Fill.OneColorGradient(2,1,1)    #msoGradientVertical
cht.SeriesCollection(2).Format.Fill.GradientStops.Insert(xw.utils.rgb_to_int((255,255,255)),0.5)
cht.SeriesCollection(2).Format.Fill.GradientStops.Delete(2)
cht.SeriesCollection(2).Format.Fill.GradientStops.Insert(xw.utils.rgb_to_int((255,128,0)),1)
  
cht.HasLegend=True
set_style(cht)

cht.Export(root+'/cht.jpg')
cht.Export(root+'/cht.svg')
cht.ExportAsFixedFormat(0,root+'/cht.pdf')

#wb.save()
#app.kill()

How to use Application.Run in the xlwings API way

The Application.Run method in Excel’s object model is a powerful tool for executing procedures, such as macros or user-defined functions, that are stored in Excel workbooks. In xlwings, this functionality is exposed through the api property, which provides direct access to the underlying Excel object model. This allows Python scripts to interact with Excel in a manner similar to VBA, enabling the automation of complex tasks and the integration of custom VBA code with Python workflows.

Functionality:
The primary purpose of Application.Run is to run a specified macro or function. This can include macros defined in VBA modules, functions in add-ins, or procedures in other open workbooks. It is particularly useful for scenarios where you need to trigger existing VBA code from an external Python script, leveraging the strengths of both environments. For instance, you might use Python for data processing and analysis, then call a VBA macro to format the results or generate a specific report layout that is already built in Excel.

Syntax in xlwings:
In xlwings, you access this method via the Application object obtained from a workbook or app instance. The basic syntax is:

app.api.Run(Macro, Arg1, Arg2, ..., Arg30)

Where:

  • app: This is the xlwings App object (e.g., xw.App() or xw.apps.active).
  • Macro: A required string argument specifying the name of the macro or function to run. The name should be in the format "WorkbookName!MacroName" or "MacroName" if the macro is in the current workbook. For add-ins, you might use the add-in’s registered name.
  • Arg1, Arg2, ..., Arg30: Optional arguments that can be passed to the macro. You can provide up to 30 arguments, which correspond to the parameters expected by the VBA procedure. These arguments can be of various data types, such as strings, numbers, or arrays, and they are passed by value to the macro.

Example Usage:
Suppose you have an Excel workbook named Report.xlsm with a VBA macro named FormatData that takes two arguments: a range address as a string and a boolean for enabling headers. You can call this macro from Python using xlwings as follows:

import xlwings as xw

# Connect to the open instance of Excel or start a new one
app = xw.apps.active # Assumes Excel is already open with the workbook

# Specify the macro name with workbook reference
macro_name = "Report.xlsm!FormatData"

# Define arguments: range address and header flag
range_address = "A1:D100"
headers_enabled = True

# Run the macro with arguments
app.api.Run(macro_name, range_address, headers_enabled)

# Alternatively, if the macro is in the active workbook, you can use:
# app.api.Run("FormatData", range_address, headers_enabled)
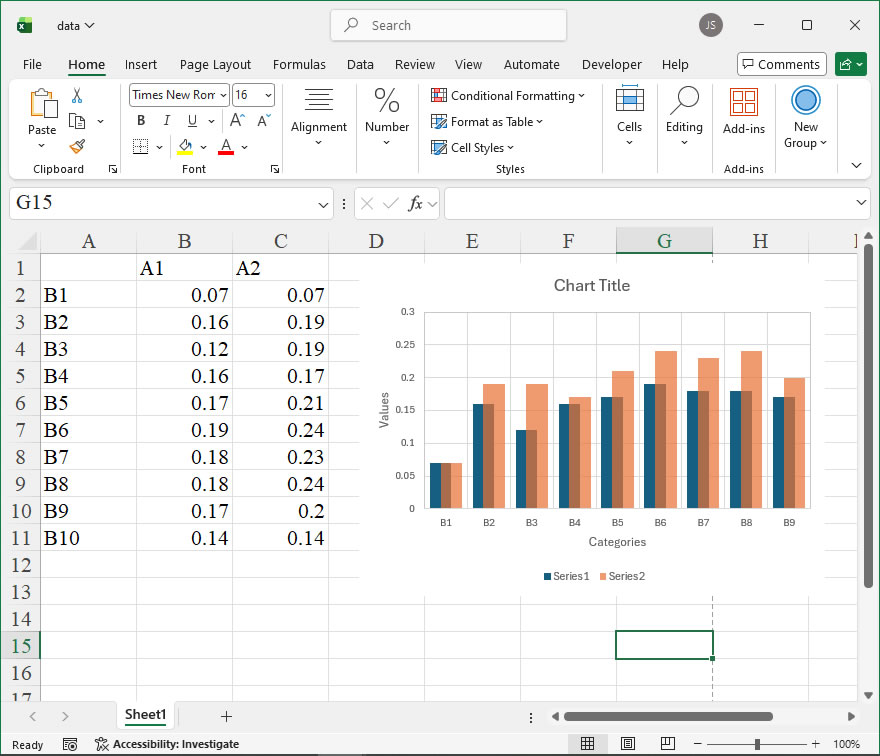
How To Create Overlayed Column Chart Using xlwings?

Example

Code

import xlwings as xw
import os

def set_style(cht):
    cht.ChartArea.Format.Line.Visible=False
    cht.PlotArea.Format.Fill.Visible = False
    cht.PlotArea.Format.Line.Visible = True
    cht.PlotArea.Format.Line.ForeColor.RGB=xw.utils.rgb_to_int((200,200,200))
    #cht.PlotArea.Format.Line.ForeColor.ObjectThemeColor = msoThemeColorText1
    ax1 = cht.Axes(1)
    ax2 = cht.Axes(2)
    ax1.HasTitle = True
    ax1.AxisTitle.Text = 'Categories'
    ax1.AxisTitle.Font.Size = 10
    ax1.TickLabels.Font.Size = 8
    #ax1.TickLabels.NumberFormat = '0.00'
    ax1.HasMajorGridlines = True
    ax2.HasTitle = True
    ax2.AxisTitle.Text = 'Values'
    ax2.AxisTitle.Font.Size = 10
    ax2.TickLabels.Font.Size = 8
    ax2.HasMajorGridlines = True
    cht.HasTitle = True
    #cht.ChartTitle.Caption = 'Plot'
    #cht.ChartTitle.Font.Size = 12

root=os.getcwd()
app=xw.App(visible=True,add_book=False)
wb=app.books.open(root+r'/data.xlsx',read_only=False)
sht=wb.sheets('Sheet1')

sht.api.Range('A2:C10').Select()  #
shp=sht.api.Shapes.AddChart2(-1,xw.constants.ChartType.xlColumnClustered,20,20,350,250,True)
cht=shp.Chart  #
cht.ChartGroups(1).GapWidth=50
cht.ChartGroups(1).Overlap=50
clr2=cht.SeriesCollection(2).Format.Fill.ForeColor
cht.SeriesCollection(2).Format.Fill.ForeColor=clr2
cht.SeriesCollection(2).Format.Fill.Transparency=0.3

set_style(cht)
cht.HasLegend=True

cht.Export(root+'/cht.jpg')
cht.Export(root+'/cht.svg')
cht.ExportAsFixedFormat(0,root+'/cht.pdf')

#wb.save()
#app.kill()

How to use Application.Repeat in the xlwings API way

The Application.Repeat property in Excel, when accessed via the xlwings API, is a read-only property that returns a Boolean value indicating whether the last user-interface action (such as a command or operation) can be repeated. This property is part of the Excel Application object model and is useful for building macros or applications that need to check the repeatability of an action before attempting to execute it again, often in conjunction with the Repeat method.

Functionality
The Application.Repeat property checks if the last action performed by the user in Excel can be repeated. This is typically used in custom VBA macros or add-ins to provide feedback or enable/disable repeat functionality in a user interface. In xlwings, it allows Python scripts to interact with Excel’s state, enabling automation that responds to user actions or workflow conditions. For instance, you might use it to verify that a formatting change or data entry can be repeated before proceeding with a batch operation.

Syntax
In xlwings, the Repeat property is accessed through the app object, which represents the Excel Application. The syntax is straightforward since it is a property with no parameters:

app.api.Repeat

Here, app is an instance of the xlwings App class (e.g., created with xw.App() or xw.apps). The .api attribute provides direct access to the underlying Excel object model, allowing you to call properties like Repeat. The property returns a Boolean:

  • True: The last action can be repeated.
  • False: The last action cannot be repeated, or no action is available to repeat.

Example
Below is a code example demonstrating how to use the Application.Repeat property in xlwings. This script checks if the last user action in Excel is repeatable and prints a message accordingly. It also shows a practical scenario where you might conditionally execute a repeat operation.

import xlwings as xw

# Connect to the active Excel instance or start a new one
app = xw.apps.active # Use the currently running Excel application

# Check if the last action can be repeated
repeat_status = app.api.Repeat

if repeat_status:
    print("The last action in Excel can be repeated.")
    # Optionally, you could use app.api.Repeat() to perform the repeat action
    # Note: app.api.Repeat() is a method that repeats the last action
    try:
        app.api.Repeat() # This repeats the last user-interface action
        print("Action repeated successfully.")
    except Exception as e:
        print(f"Error repeating action: {e}")
else:
    print("The last action in Excel cannot be repeated or no action is available.")

# Example with a specific action: Let's assume a user just formatted a cell
# We'll simulate checking after a potential action
# First, ensure we have a workbook and range
wb = app.books.active
sheet = wb.sheets.active
cell = sheet.range("A1")
cell.value = "Test"
cell.api.Font.Bold = True # Apply bold formatting as an action

# Now check the Repeat property after this formatting
repeat_status_after = app.api.Repeat
print(f"After formatting A1 as bold, Repeat status: {repeat_status_after}")

# In many cases, formatting actions are repeatable, so this might return True
# You can use this to automate repetitive tasks based on user actions

Notes

  • The Repeat property is often used in tandem with the Repeat method (app.api.Repeat()), which actually repeats the last action. However, the property only indicates feasibility without performing the action.
  • In xlwings, accessing app.api.Repeat directly mirrors the VBA Application.Repeat property, ensuring compatibility with Excel’s behavior.
  • The property may return False if no previous action exists or if the action is not repeatable (e.g., some dialog-based operations). Always handle potential errors when using the related method.
  • This property is primarily relevant for user-interface interactions; in automated scripts, its value depends on the last action performed, which could be from the script itself or manual user input.

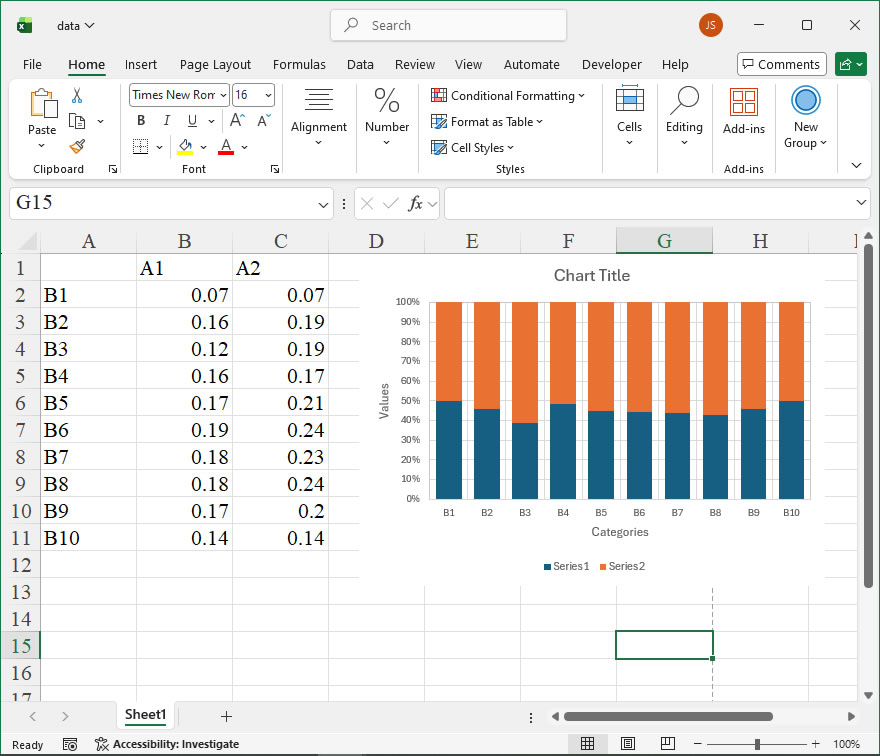
How To Create 100% Stacked Column Chart Using xlwings?

Example

Code

import xlwings as xw
import os

def set_style(cht):
    cht.ChartArea.Format.Line.Visible=False
    cht.PlotArea.Format.Fill.Visible = False
    cht.PlotArea.Format.Line.Visible = True
    cht.PlotArea.Format.Line.ForeColor.RGB=xw.utils.rgb_to_int((200,200,200))
    #cht.PlotArea.Format.Line.ForeColor.ObjectThemeColor = msoThemeColorText1
    ax1 = cht.Axes(1)
    ax2 = cht.Axes(2)
    ax1.HasTitle = True
    ax1.AxisTitle.Text = 'Categories'
    ax1.AxisTitle.Font.Size = 10
    ax1.TickLabels.Font.Size = 8
    #ax1.TickLabels.NumberFormat = '0.00'
    ax1.HasMajorGridlines = True
    ax2.HasTitle = True
    ax2.AxisTitle.Text = 'Values'
    ax2.AxisTitle.Font.Size = 10
    ax2.TickLabels.Font.Size = 8
    ax2.HasMajorGridlines = True
    cht.HasTitle = True
    #cht.ChartTitle.Caption = 'Plot'
    #cht.ChartTitle.Font.Size = 12

root=os.getcwd()
app=xw.App(visible=True,add_book=False)
wb=app.books.open(root+r'/data.xlsx',read_only=False)
sht=wb.sheets('Sheet1')

sht.api.Range('A2:C11').Select()  #
shp=sht.api.Shapes.AddChart2(-1,xw.constants.ChartType.xlColumnStacked100,20,20,350,250,True)
cht=shp.Chart  #
cht.ChartGroups(1).GapWidth=50

set_style(cht)

cht.Export(root+'/cht.jpg')
cht.Export(root+'/cht.svg')
cht.ExportAsFixedFormat(0,root+'/cht.pdf')

#wb.save()
#app.kill()

How to use Application.RegisterXLL in the xlwings API way

The RegisterXLL member of the Application object in Excel is a method that loads and registers an Excel add-in (XLL) file. XLLs are dynamic-link libraries (DLLs) specifically designed for Excel, providing custom functions, commands, or features that extend Excel’s native capabilities. In xlwings, this method allows you to programmatically register an XLL add-in from your Python code, enabling the use of its functions within Excel. This is particularly useful for automating workflows that depend on custom add-ins or for ensuring that required add-ins are loaded before executing certain tasks.

Syntax in xlwings:

app.api.RegisterXLL(Filename)

Here, app is an instance of the xlwings App class, representing the Excel application. The .api property provides access to the underlying Excel object model. The RegisterXLL method takes one parameter:

  • Filename (string, required): The full path and file name of the XLL add-in to be registered. For example, r"C:\AddIns\MyFunctions.xll".

If the registration is successful, the method returns True; if it fails (e.g., due to an invalid file path or compatibility issues), it returns False.

Example:
Suppose you have an XLL add-in named FinancialTools.xll located in a network drive. The following xlwings code registers this add-in in Excel and then uses a custom function from it to calculate a value. This example assumes Excel is already running or will be started by xlwings.

import xlwings as xw
import os

# Start or connect to Excel
app = xw.App(visible=True)

# Define the path to the XLL file
xll_path = r"\\server\share\AddIns\FinancialTools.xll"

# Check if the file exists before attempting to register
if os.path.exists(xll_path):
# Register the XLL add-in
    success = app.api.RegisterXLL(xll_path)
    if success:
        print("Add-in registered successfully.")

        # Open a workbook (or use the active one)
        wb = app.books.open(r"C:\Data\Report.xlsx")

        # Use a custom function from the add-in, e.g., a user-defined function (UDF)    named "CalculateNPV"
        # This writes the formula into cell A1 of the first sheet
        wb.sheets[0].range("A1").formula = "=CalculateNPV(B1:B10, 0.1)"

        # Calculate to ensure the formula is evaluated
        wb.api.Calculate()

        # Read the result
        result = wb.sheets[0].range("A1").value
        print(f"Calculated NPV: {result}")
    else:
        print("Failed to register the add-in.")
else:
    print("XLL file not found.")

# Close the workbook and quit Excel (optional)
wb.close()
app.quit()