Archive

How To Create Jittered Scatter Chart Using xlChart+ Add-in?

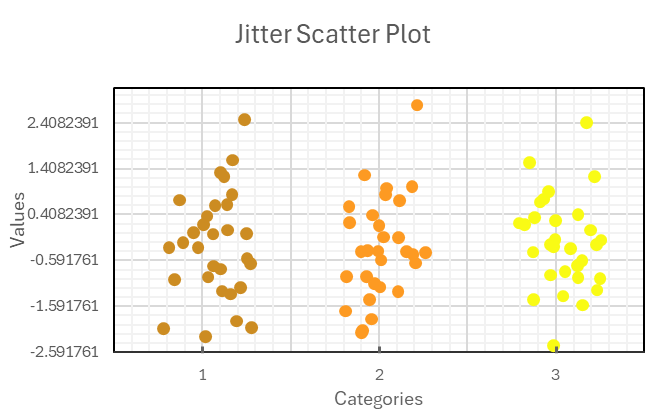
Flowing these steps to create jittered scatter chart:

First, select data in the worksheet.
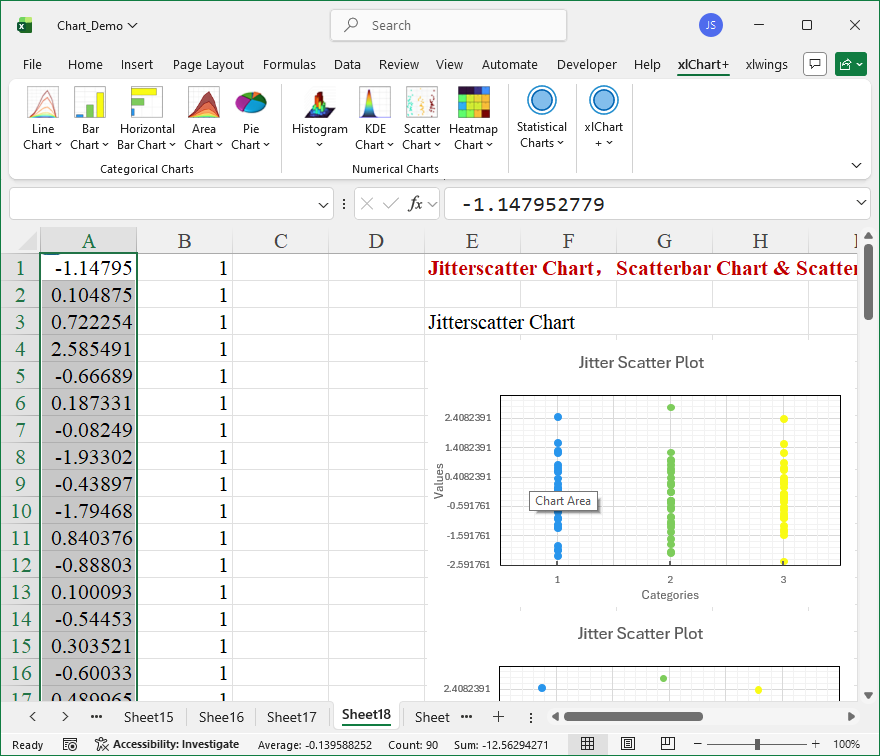
Click “Jitter Scatter” item in “Scatter Chart” menu in xlChart+ add-in, open “Create a Jittered Scatter Chart” dialog box.  Input “B1:B90” in “Grouped Range” textbox.

Click “OK” button.

You can change the colormap by selecting another item in “Select a colormap” dropbox in “Create a Scatter Chart” dialog box.
How To Create Scatter Chart Using xlChart+ Add-in?

Flowing these steps to create scatter chart:

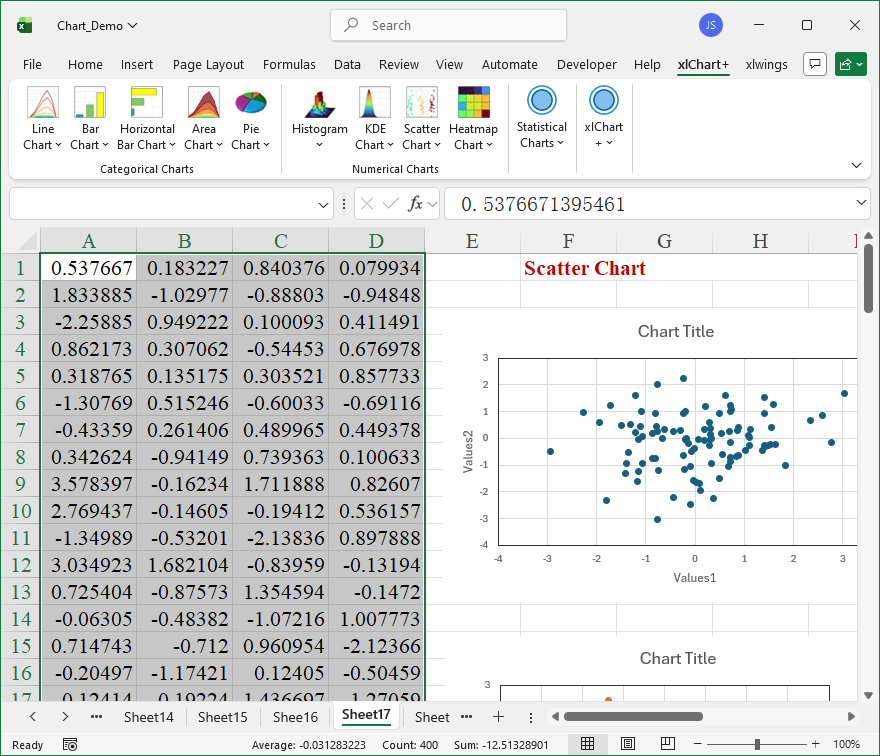
First, select data in the worksheet.

Click “Scatter Chart” item in “Scatter Chart” menu in xlChart+ add-in, open “Create a Scatter Chart” dialog box. 

Click “OK” button.

You can also create complex scatter chart following these steps:

Select data.

Click “Scatter Chart” item in “Scatter Chart” menu in xlChart+ add-in, open “Create a Scatter Chart” dialog box. 

Click “OK” button.

You can change the colormap by selecting another item in “Select a colormap” dropbox in “Create a Scatter Chart” dialog box.

How To Create Ridge Chart Using xlChart+ Add-in?

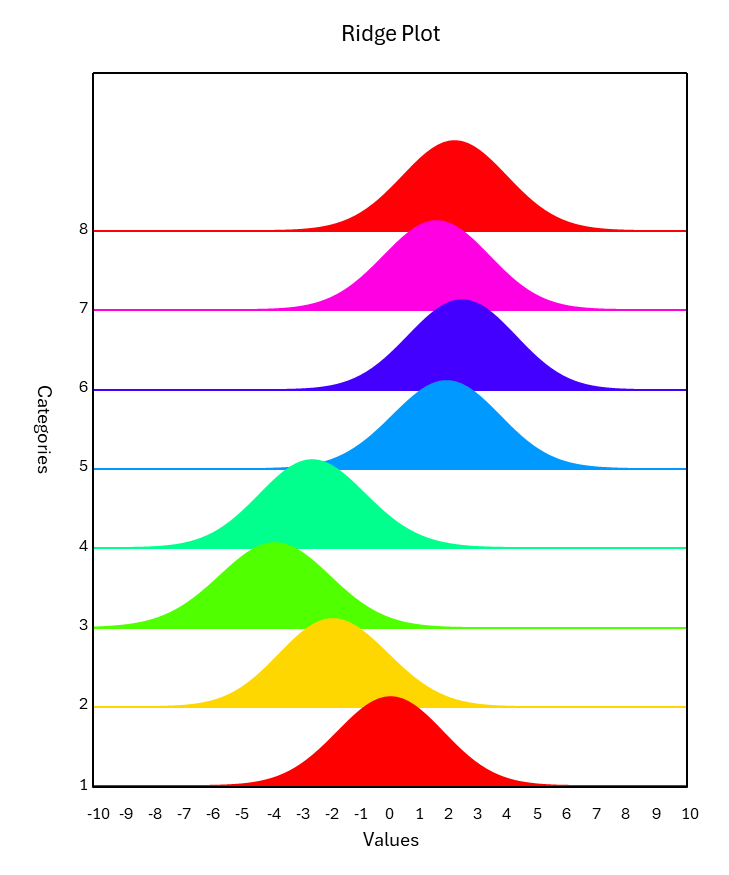
Flowing these steps to create ridge chart:

First, select data in the worksheet.

Click “Ridge” item in “KDE Chart” menu in xlChart+ add-in, open “Create a Ridge Chart” dialog box. Input “B1:B800” in “Grouped Range” textbox.

Click “OK” button.

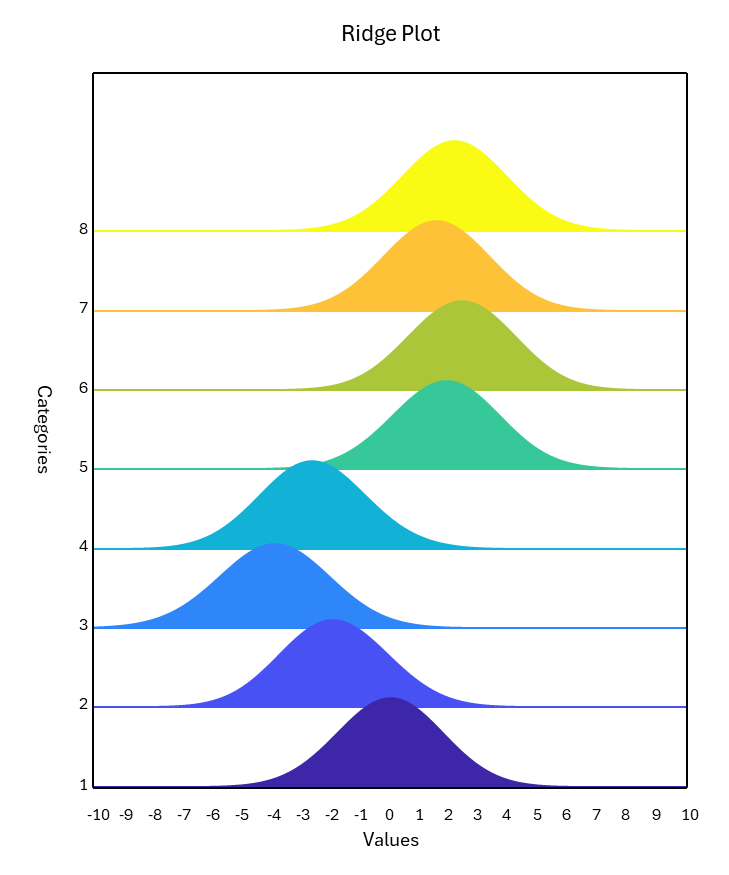
You can change the colormap by selecting another item in “Select a colormap” dropbox in “Create a Ridge Chart” dialog box.

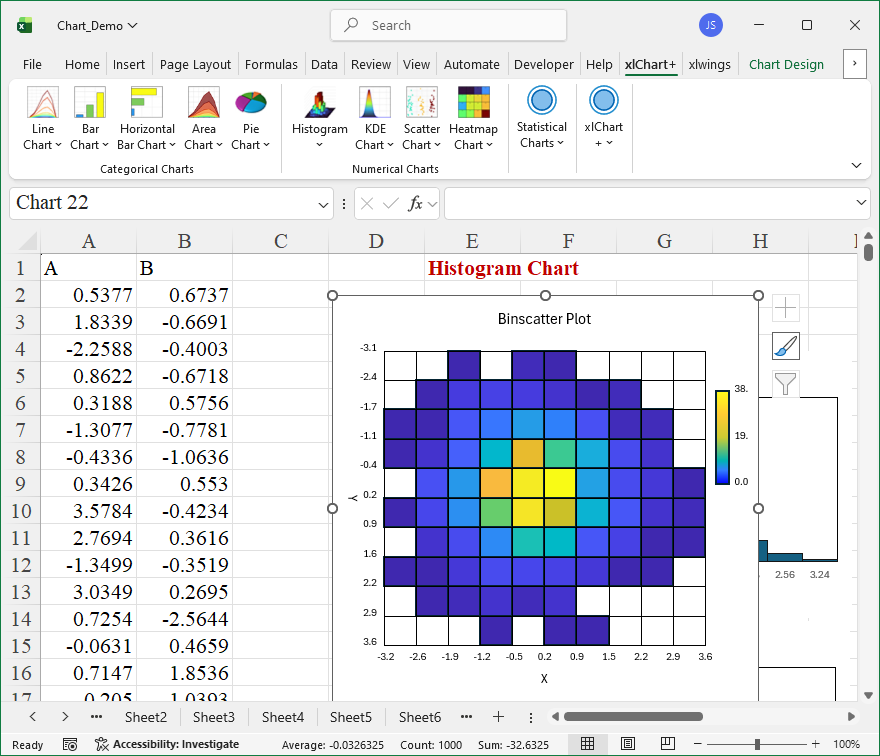
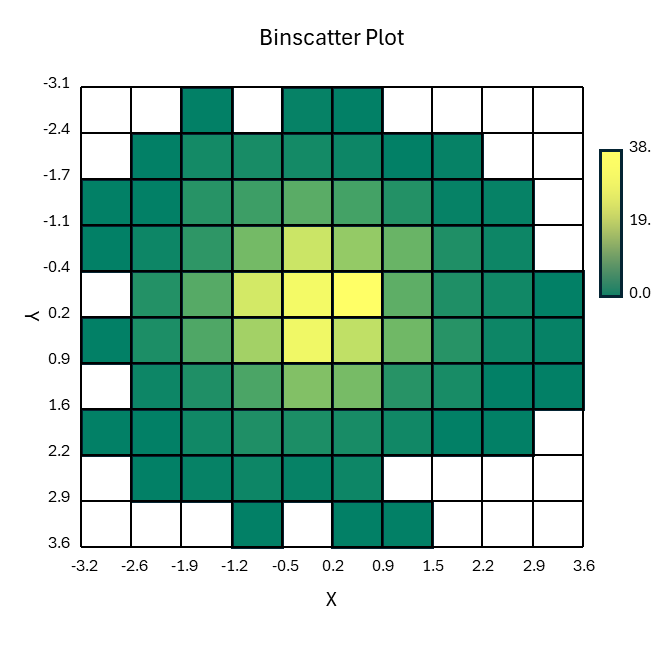
How To Create Binscatter Chart Using xlChart+ Add-in?

Flowing these steps to create binscatter chart:

First, select data in the worksheet.

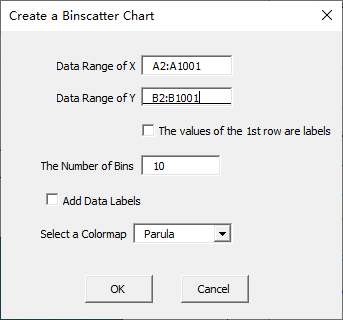
Click “Binscatter” item in “Histogram” menu in xlChart+ add-in, open “Create a Binscatter Chart” dialog box.

Click “OK” button.

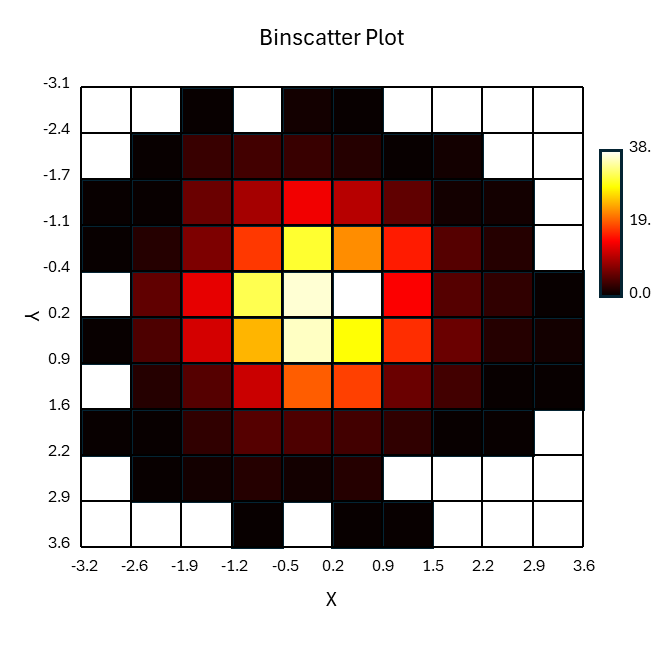
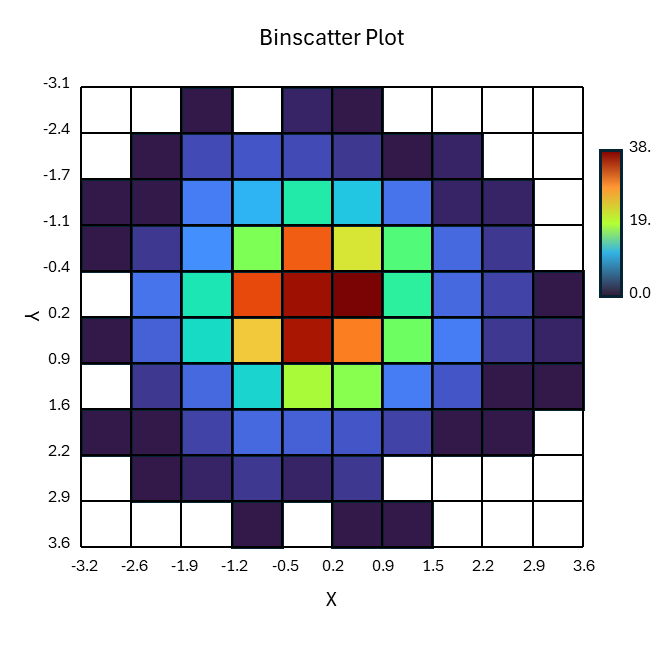
You can change the colormap by selecting another item in “Select a colormap” dropbox in “Create a Binscatter Chart” dialog box.

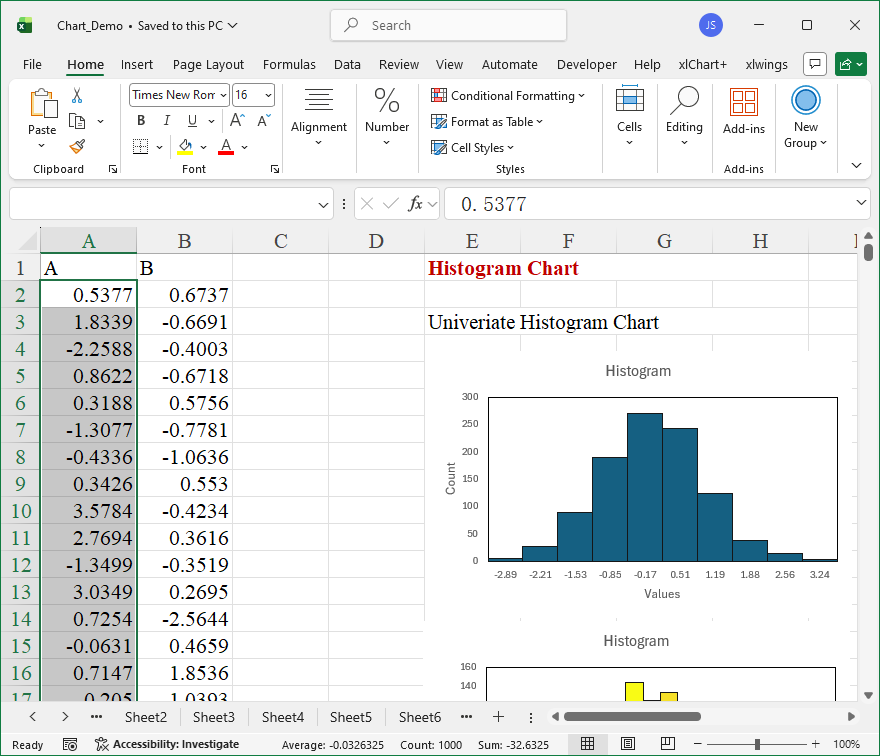
How To Create Bivariate Histogram Chart Using xlChart+ Add-in?

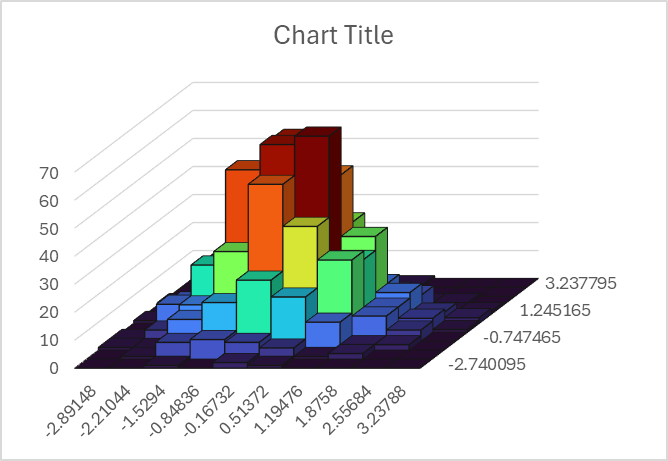
Flowing these steps to create bivariate histogram chart:

First, select data in the worksheet.

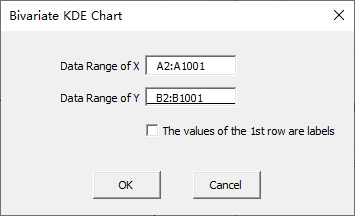
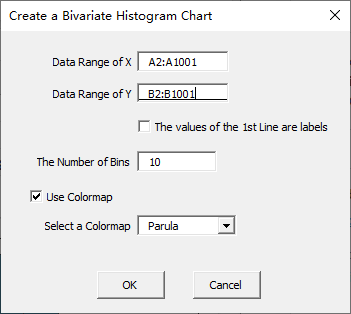
Click “Bivariate” item in “Histogram” menu in xlChart+ add-in, open “Create a Bivariate Histogram Chart” dialog box. Input B2:B1001 in “Data Range of Y” textbox.
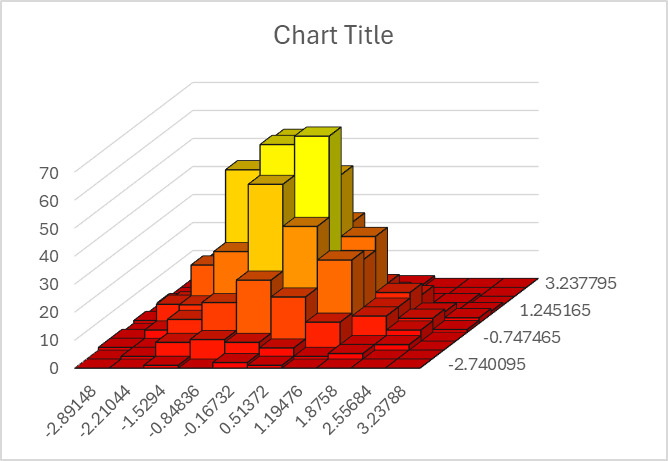
Click “OK” button.
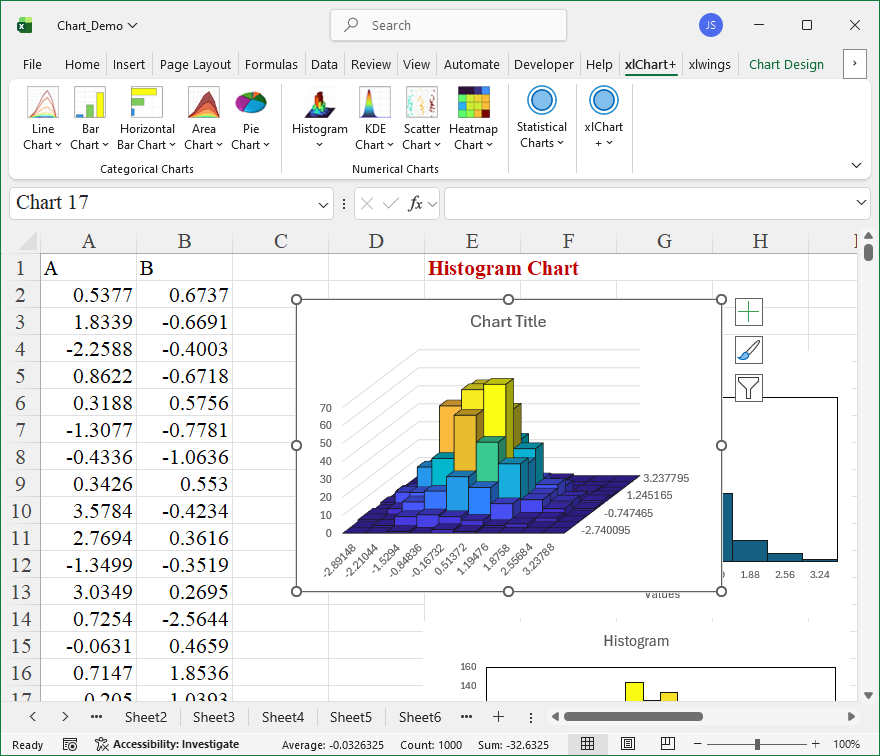
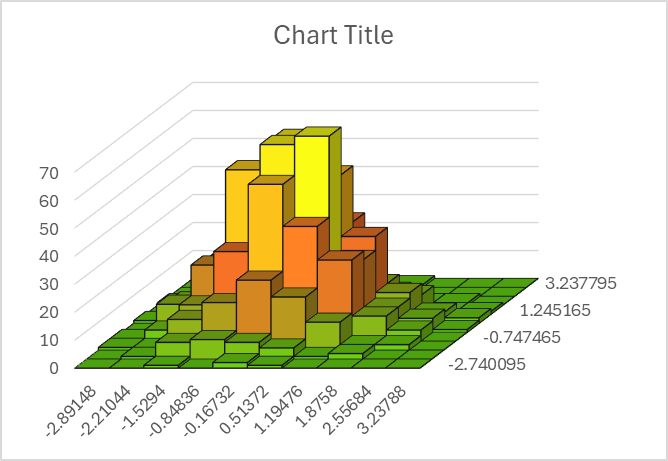
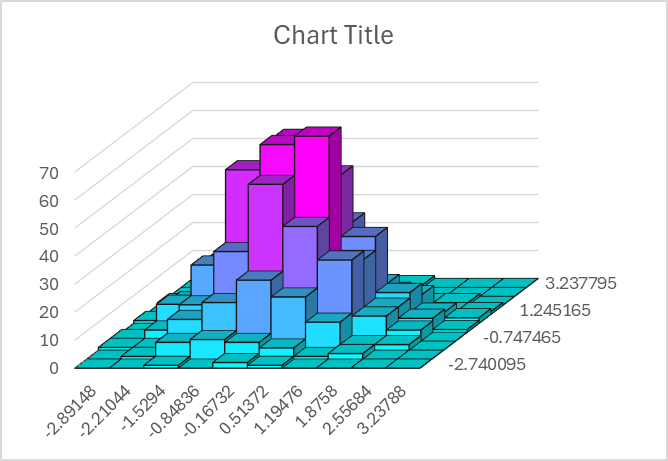
You can change the colormap by selecting another item in “Select a colormap” dropbox in “Create a Bivariate Doughnut Chart” dialog box.