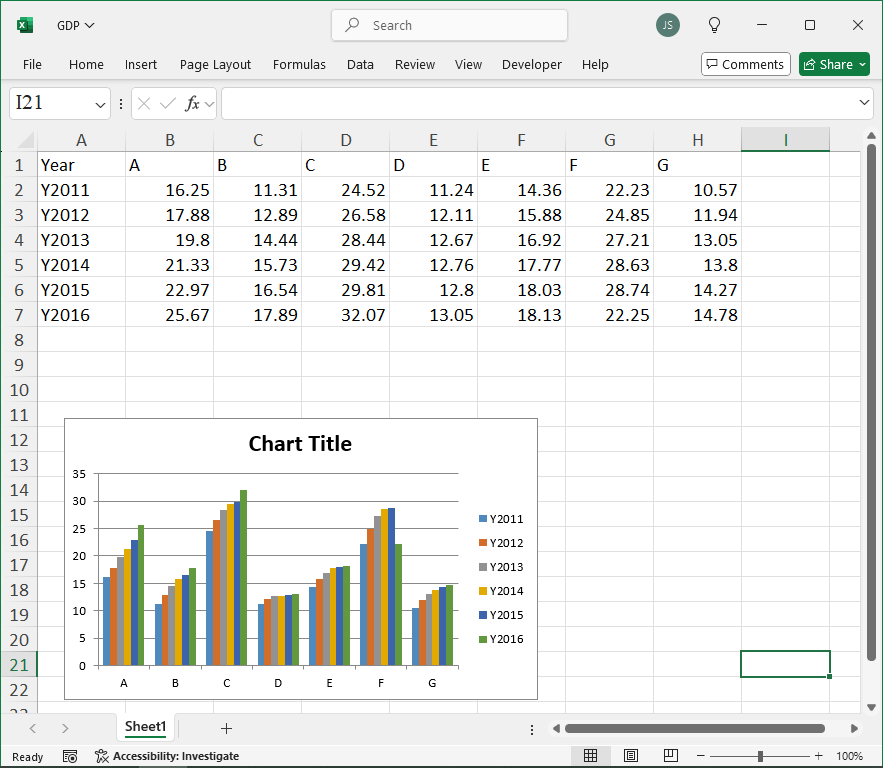
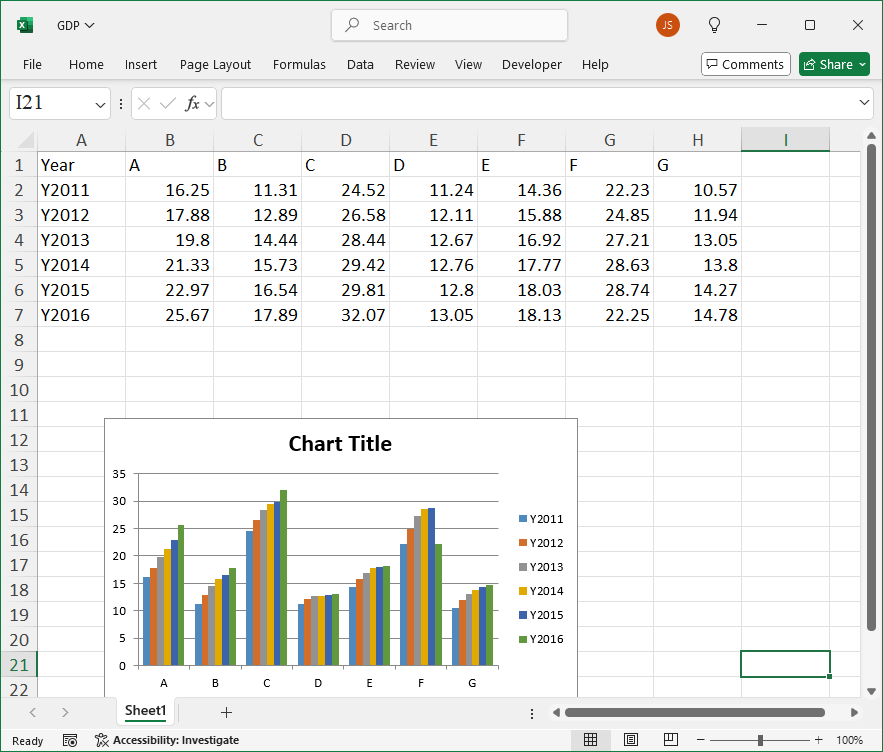
Here, `sht` represents the worksheet object, and there are four parameters:
– `left` – Specifies the position of the chart’s left side, in points. The default value is 0.
– `top` – Specifies the position of the chart’s top side, in points. The default value is 0.
– `width` – Specifies the width of the chart, in points. The default value is 355.
– `height` – Specifies the height of the chart, in points. The default value is 211.
This method returns a `chart` object.
cht=sht.charts.add(50, 200) #Add a chart
cht.set_source_data(sht.range(‘A1’).expand()) #Bind data to chart
cht.chart_type=’column_clustered’ #Chart type
cht.api[1].HasTitle=True #Chart has a title
Sample Code
#Create Chart - xlwings

import xlwings as xw
import os

root = os.getcwd()
app = xw.App(visible=True, add_book=False)
wb=app.books.open('GDP.xlsx',read_only=False)
sht=wb.sheets(1)

cht=sht.charts.add(50, 200)    #Add a chart
cht.set_source_data(sht.range('A1').expand())    #Bind data to chart
cht.chart_type='column_clustered'    #Chart type
cht.api[1].HasTitle=True    #Chart has a title

#wb.save()
#wb.close()
#app.kill()
Using the methods provided by the `Shape` object, you can perform translation, rotation, scaling, and reflection transformations on a given graphic. The implementation of these methods is exactly the same for images.
Use the `AddPicture` method of the `Shape` object to create an image from an existing file. This method returns a `Shape` object representing the new image. The syntax of this method is:
Here, `sht` represents the worksheet, and the parameters are as follows:
Name
Required/Optional
Data Type
Description
FileName
Required
String
The image file name
LinkToFile
Required
MsoTriState
Set to `False` to make the image an independent copy, not linked. Set to `True` to link the image to the file from which it was created
SaveWithDocument
Required
MsoTriState
Saves the image with the document. Use `False` to store only the link information, and `True` to save the linked image with the document. This parameter must be `True` if `LinkToFile` is `False`
Left
Required
Single
The position of the top-left corner of the image relative to the document’s top-left corner (in points)
Top
Required
Single
The position of the top-left corner of the image relative to the document’s top (in points)
Width
Required
Single
The width of the image in points (enter `-1` to retain the original width)
Height
Required
Single
The height of the image in points (enter `-1` to retain the original height)
Graphic flipping, also known as image reflection or symmetry transformation, is achieved using the `Flip` method of the `Shape` object. This method flips the graphic around either the horizontal or vertical axis. It has one parameter that specifies whether to flip horizontally or vertically. The corresponding values for horizontal and vertical flips are 0 and 1, respectively.
shp=sht.api.Shapes.AddShape(1, 100, 50, 200, 100) #Rectangular area
Graphic scaling, also known as affine transformation, is the process of enlarging or reducing a given graphic by a certain ratio. Use the `ScaleWidth` and `ScaleHeight` methods of the `Shape` object to specify the scaling ratios for the horizontal and vertical directions, respectively, to achieve the scaling operation.
Both `ScaleWidth` and `ScaleHeight` methods have three parameters, as shown in the table.
Name
Required/Optional
Data Type
Description
Factor
Required
Single
Specifies the ratio of the adjusted width to the current or original width
RelativeToOriginalSize
Required
MsoTriState
When `False`, scales relative to the current size. This parameter can only be set to `True` when the graphic is a picture or OLE object.
Scale
Optional
Variant
One of the constants from MsoScaleFrom type, specifying which part of the graphic remains at the original position when scaling.
The `Scale` parameter takes constants from the `MsoScaleFrom` enumeration, indicating which part of the graphic remains at the original position after scaling. The possible values are as follows:
Name
Value
Description
msoScaleFromBottomRight
2
The bottom-right corner of the graphic remains at the original position
msoScaleFromMiddle
1
The midpoint of the graphic remains at the original position
msoScaleFromTopLeft
0
The top-left corner of the graphic remains at the original position
shp=sht.api.Shapes.AddShape(9, 100, 50, 200, 100) #Elliptical area
ff=shp.Fill
ff.PresetTextured(12) #Preset texture: Granite
shp.ScaleWidth(0.75,False) #Width × 0.75
shp.ScaleHeight(1.75,False) #Height × 1.75
Sample Code
#Flip transformation

import xlwings as xw    #Import xlwings package

app=xw.App()
bk=app.books.active   #Get the active workbook
sht=bk.sheets.active    #Get the active worksheet

shp=sht.api.Shapes.AddShape(1, 100, 50, 200, 100)    #Rectangular area
shp.Fill.PresetTextured(22)    #Preset texture: Walnut wood
shp.Flip(0)    #Horizontal flip
shp.Flip(1)    #Vertical flip

#bk.save()
#bk.close()
#app.kill()