Method
The `charts.add` method provided by the `xlwings` package can be used to create a chart. The syntax is as follows:
sht.charts.add(left=0, top=0, width=355, height=211)
Here, `sht` represents the worksheet object, and there are four parameters:
– `left` – Specifies the position of the chart’s left side, in points. The default value is 0.
– `top` – Specifies the position of the chart’s top side, in points. The default value is 0.
– `width` – Specifies the width of the chart, in points. The default value is 355.
– `height` – Specifies the height of the chart, in points. The default value is 211.
This method returns a `chart` object.
cht=sht.charts.add(50, 200) #Add a chart
cht.set_source_data(sht.range(‘A1’).expand()) #Bind data to chart
cht.chart_type=’column_clustered’ #Chart type
cht.api[1].HasTitle=True #Chart has a title
Sample Code
#Create Chart - xlwings

import xlwings as xw
import os

root = os.getcwd()
app = xw.App(visible=True, add_book=False)
wb=app.books.open('GDP.xlsx',read_only=False)
sht=wb.sheets(1)

cht=sht.charts.add(50, 200)    #Add a chart
cht.set_source_data(sht.range('A1').expand())    #Bind data to chart
cht.chart_type='column_clustered'    #Chart type
cht.api[1].HasTitle=True    #Chart has a title

#wb.save()
#wb.close()
#app.kill()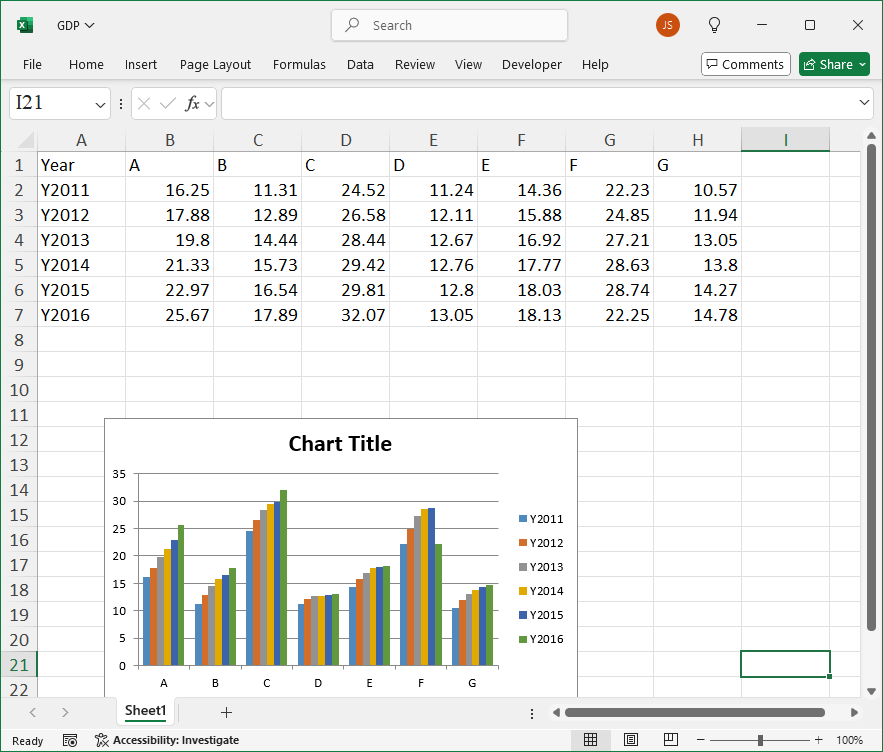
Leave a Reply