Blog
How to use Application.DDERequest in the xlwings API way
The DDERequest method of the Application object in Excel is a legacy function used to retrieve data from an external application via Dynamic Data Exchange (DDE). This method allows Excel to act as a DDE client, requesting specific information from a DDE server application. While DDE is an older technology largely superseded by more modern methods like COM or various APIs, understanding DDERequest can be crucial for maintaining or interfacing with legacy systems that still rely on DDE communication channels. In the context of xlwings, which provides a Pythonic way to automate Excel, you can access this method through the Application object.
Functionality
The primary function of DDERequest is to establish a DDE conversation with a server application and request a specific data item. It is used to fetch real-time or static data from programs that support DDE, such as some financial data feeds, scientific instruments, or older database systems. The method initiates a request for a particular item within an established DDE channel.
Syntax
In xlwings, the DDERequest method is accessed via the Application object. The general syntax is as follows:
app.application.DDERequest(Channel, Item)- Channel (Required): A Long integer that represents the channel number returned by a previous DDEInitiate call. This channel identifies an open DDE conversation with a server application.
- Item (Required): A String that specifies the data item being requested from the DDE server. The format and meaning of this string are defined by the server application. It often resembles a cell reference (e.g., “R1C1”) or a named range specific to the server.
Parameters and Usage
The method requires a pre-established DDE channel. Typically, you use the DDEInitiate method first to open a channel to a specific server and topic. The Item parameter is entirely dependent on the DDE server’s protocol. Common examples include requesting specific stock prices, instrument readings, or database fields. The method returns a Variant containing the requested data, which could be a number, string, or array.
Code Example
The following xlwings code example demonstrates how to use DDERequest to request data from a hypothetical DDE server. The example assumes a server application named “MyServer” with a topic “Prices”, and requests the item “StockXYZ”.
import xlwings as xw

# Connect to the active Excel instance or start a new one
app = xw.apps.active

# First, initiate a DDE channel (this is typically done via Excel's DDEInitiate method).
# Note: xlwings does not have a direct wrapper for DDEInitiate, so we use the underlying API.
# This requires the channel number from a successful DDEInitiate call.
# For demonstration, we assume channel number 5 is already open.
channel_number = 5 # This would come from a prior DDEInitiate call.

# Use DDERequest to get data for the item "StockXYZ"
try:
    requested_data = app.api.DDERequest(Channel=channel_number, Item="StockXYZ")
    print(f"Data received via DDE: {requested_data}")
except Exception as e:
    print(f"DDERequest failed: {e}")

# In a real-world scenario, you would also close the channel using DDETerminate.
# app.api.DDETerminate(Channel=channel_number)How To Set Multiple Axes Chart Using xlwings?
【Method】
– Bind a series to the primary or secondary axis
The **AxisGroup** property of the **Series** object is used to assign a series to either the primary axis (when the value is 1) or the secondary axis (when the value is 2).
– Set up the axes
You can access the **Axis** object through the **Chart** object with the following syntax:
axs=cht.Axes(Type,AxisGroup)
Where `cht` is the **Chart** object. The **Type** parameter indicates the type of axis. A value of 1 means a category axis, while 2 means a value axis. The **AxisGroup** parameter specifies whether the axis is primary (1) or secondary (2). By default, the primary axis is displayed on the left, and the secondary axis is displayed on the right. This allows the creation of a dual-axis chart, where two charts are overlaid using the same horizontal axis and different vertical axes.
sht.api.Range(‘A1:B7’).Select() #Data
cht=sht.api.Shapes.AddChart2(-1,xw.constants.ChartType.xlColumnClustered,\
20,20,350,200,True).Chart
cht.SeriesCollection(1).AxisGroup=1 #Y axis for series 1
cht.SeriesCollection(2).AxisGroup=2 #Y axis for series 2
cht.SeriesCollection(2).ChartType=xw.constants.ChartType.xlLine
cht.SeriesCollection(2).MarkerStyle=xw.constants.MarkerStyle.xlMarkerStyleTriangle
cht.SeriesCollection(2).MarkerForegroundColor=xw.utils.rgb_to_int((0,0,255))
cht.SeriesCollection(2).MarkerSize=8
cht.SeriesCollection(2).HasDataLabels=True
cht.SeriesCollection(1).HasDataLabels=True
axs1=cht.Axes(2,1)
axs1.MinimumScale=0
axs1.MaximumScale=60
axs1.HasTitle=True
axs1.AxisTitle.Text=’Y Axis 1′
axs2=cht.Axes(2,2)
axs2.MinimumScale=10
axs2.MaximumScale=160
axs2.HasTitle=True
axs2.AxisTitle.Text=’Y Axis 2′
【Example】

【Code】
#Coordinate system - Multi-axis chart

import xlwings as xw
import os

root=os.getcwd()
app=xw.App(visible=True,add_book=False)
wb=app.books.open('multiaxis.xlsx',read_only=False)
sht=wb.sheets('Sheet1')

sht.api.Range('A1:B7').Select()    #Data
cht=sht.api.Shapes.AddChart2(-1,xw.constants.ChartType.xlColumnClustered,\
                        20,20,350,200,True).Chart
cht.SeriesCollection(1).AxisGroup=1    #Y axis for series 1
cht.SeriesCollection(2).AxisGroup=2    #Y axis for series 2
cht.SeriesCollection(2).ChartType=xw.constants.ChartType.xlLine
cht.SeriesCollection(2).MarkerStyle=xw.constants.MarkerStyle.xlMarkerStyleTriangle
cht.SeriesCollection(2).MarkerForegroundColor=xw.utils.rgb_to_int((0,0,255))
cht.SeriesCollection(2).MarkerSize=8
cht.SeriesCollection(2).HasDataLabels=True
cht.SeriesCollection(1).HasDataLabels=True

axs1=cht.Axes(2,1)
axs1.MinimumScale=0
axs1.MaximumScale=60
axs1.HasTitle=True
axs1.AxisTitle.Text='Y Axis 1'

axs2=cht.Axes(2,2)
axs2.MinimumScale=10
axs2.MaximumScale=160
axs2.HasTitle=True
axs2.AxisTitle.Text='Y Axis 2'

cht.ChartTitle.Caption='Multi-axis Plot'

#wb.save()
#wb.close()
#app.kill()
How to use Application.DDEPoke in the xlwings API way
The DDEPoke method in Excel’s object model is a feature of the Application object that allows sending data from Excel to another application via Dynamic Data Exchange (DDE). This method is useful for automating communication with other programs that support DDE, enabling Excel to act as a client that pushes data into a server application. In xlwings, this functionality can be accessed through the api property, which provides direct access to the underlying Excel object model. While DDE is an older technology largely replaced by more modern methods like COM or APIs, understanding DDEPoke can be beneficial for maintaining legacy systems or interacting with specific software that still relies on DDE channels.
The syntax for calling DDEPoke via xlwings follows the Excel object model structure. In xlwings, you typically use the app object to represent the Excel application, and then access the DDEPoke method through its api property. The method signature in Excel VBA is Application.DDEPoke(Channel, Item, Data), where Channel is a Long integer representing the DDE channel number established with another application, Item is a String specifying the item in the DDE conversation (e.g., a cell reference or topic), and Data is the value to send. In xlwings, this translates to app.api.DDEPoke(Channel, Item, Data). The parameters must be provided in the correct order: first the channel, then the item, and finally the data to poke. It’s important to note that a DDE channel must already be opened using DDEInitiate before DDEPoke can be used, as the channel number is returned by that initiation call. The data parameter can be a string, number, or array, depending on what the receiving application expects.
Here is an example of using DDEPoke with xlwings to send data from Excel to another application. Suppose you have a DDE channel opened with a hypothetical program like a financial terminal, and you want to update a specific item with a value. First, ensure you have xlwings installed and import it. Then, you can write a script that starts Excel, initiates a DDE channel, and uses DDEPoke to send data. Below is a code instance:
import xlwings as xw

# Start or connect to an Excel application
app = xw.App(visible=True) # Set visible=False for background operation

# Assume a DDE channel has been established earlier, e.g., via DDEInitiate
# In practice, you would use app.api.DDEInitiate(app_name, topic) to get a channel
# For this example, let's pretend channel number 1 is already open
channel = 1 # This should be the actual channel number from DDEInitiate
item = "R1C1" # Item to poke, e.g., a cell reference in the DDE conversation
data = "Hello from Excel via DDE" # Data to send

# Use DDEPoke to send the data
try:
    app.api.DDEPoke(channel, item, data)
    print("Data poked successfully.")
except Exception as e:
    print(f"Error in DDEPoke: {e}")

# Close the Excel application if needed
app.quit()
In this example, replace channel with the actual channel number obtained from DDEInitiate. The item parameter might vary based on the DDE server’s requirements—it could be a range like “R1C1” for a cell or a specific command string. The data is sent as a string, but it could be numeric if the application expects it. Always handle errors with try-except blocks, as DDE operations can fail if the channel is closed or the server is unresponsive. This method is particularly useful in scenarios where you need to automate data feeds to legacy systems without modern API support, but for new projects, consider using more robust integration methods like REST APIs or direct database connections.
How To Set Gridlines Using xlwings?
【Method】
Gridlines are represented by the **Gridlines** object. You can use its **Border** or **Format** properties to set the gridline color, line style, width, and other attributes. The **MajorGridlines** and **MinorGridlines** properties of the **Axis** object return **Gridlines** objects for the major and minor gridlines, respectively. Before setting these properties, the **HasMajorGridlines** and/or **HasMinorGridlines** properties of the **Axis** object must be set to `True`.
sht.api.Range(‘A1:B7’).Select() #Data
cht=sht.api.Shapes.AddChart().Chart #Add chart
axs=cht.Axes(1) #Horizontal axis
axs2=cht.Axes(2) #Vertical axis
axs.HasMajorGridlines=True #Show major gridlines for horizontal axis
axs.MajorGridlines.Border.ColorIndex =3 #Red
axs.MajorGridlines.Border.LineStyle = xw.constants.LineStyle.xlDash #Line style
axs2.HasMajorGridlines=True #Show major gridlines for vertical axis
axs2.MajorGridlines.Border.ColorIndex = 3 #Red
axs2.MajorGridlines.Border.LineStyle = xw.constants.LineStyle.xlDash #Line style
#Can also use the following code for setting
#axs.MajorGridlines.Format.Line.ForeColor.RGB=xw.utils.rgb_to_int((255,0,0))
#axs.MajorGridlines.Format.Line.DashStyle=4
#axs2.MajorGridlines.Format.Line.ForeColor.RGB=xw.utils.rgb_to_int((255,0,0))
#axs2.MajorGridlines.Format.Line.DashStyle=4
【Example】

【Code】
#Coordinate system - Gridlines

import xlwings as xw
import os

root = os.getcwd()
app = xw.App(visible=True, add_book=False)
wb=app.books.open(root+r"/P1P2.xlsx",read_only=False)
sht=wb.sheets(1)

sht.api.Range('A1:B7').Select()    #Data
cht=sht.api.Shapes.AddChart().Chart    #Add chart
axs=cht.Axes(1)    #Horizontal axis
axs2=cht.Axes(2)    #Vertical axis
axs.HasMajorGridlines=True    #Show major gridlines for horizontal axis
axs.MajorGridlines.Border.ColorIndex =3    #Red
axs.MajorGridlines.Border.LineStyle = xw.constants.LineStyle.xlDash    #Line style
axs2.HasMajorGridlines=True    #Show major gridlines for vertical axis
axs2.MajorGridlines.Border.ColorIndex = 3    #Red
axs2.MajorGridlines.Border.LineStyle = xw.constants.LineStyle.xlDash    #Line style
#Can also use the following code for setting
#axs.MajorGridlines.Format.Line.ForeColor.RGB=xw.utils.rgb_to_int((255,0,0))
#axs.MajorGridlines.Format.Line.DashStyle=4
#axs2.MajorGridlines.Format.Line.ForeColor.RGB=xw.utils.rgb_to_int((255,0,0))
#axs2.MajorGridlines.Format.Line.DashStyle=4

#wb.save()
#wb.close()
#app.kill()

How to use Application.DDEInitiate in the xlwings API way
The DDEInitiate method of the Application object in Excel is a legacy function used to initiate a Dynamic Data Exchange (DDE) conversation with another application. DDE is an older interprocess communication protocol that allows Windows applications to exchange data in real-time. While largely superseded by more modern technologies like COM or .NET, understanding DDEInitiate can be crucial for maintaining legacy automation systems or interacting with applications that still primarily support DDE.
In the context of xlwings, which provides a Pythonic wrapper around the Excel Object Model via COM, you can access this method through the app object, which represents the Excel Application. The xlwings API call mirrors the VBA syntax closely.
Functionality:
The primary function is to open a DDE channel to another application. Once established, this channel can be used to send commands or request data using other DDE methods like DDEExecute or DDERequest. It returns a channel number, which is an integer identifier for the opened conversation. This number must be used in subsequent DDE operations and eventually closed with DDETerminate.
Syntax in xlwings:
channel_number = app.api.DDEInitiate(App, Topic)- Parameters:
App(Required, String): The name of the application to communicate with. This is typically the executable name without the.exeextension (e.g., “WinWord” for Microsoft Word).Topic(Required, String): The topic of the conversation. This often refers to a document name or a system topic. For many applications, a common system topic is “System”.
Code Example:
The following xlwings script demonstrates initiating a DDE conversation with a hypothetical server application named “DataServer” on the “System” topic, performing a simple operation, and then properly terminating the channel.
import xlwings as xw

# Start Excel application (or connect to a running instance)
app = xw.App(visible=True) # Set visible=False for background operation

try:
    # Initiate a DDE conversation
    channel = app.api.DDEInitiate(App="DataServer", Topic="System")
    print(f"DDE Channel opened: {channel}")

    # Example: Execute a command on the server (e.g., request an update)
    # app.api.DDEExecute(channel, "[UpdateAll]")

    # Example: Request data from the server
    # data = app.api.DDERequest(channel, "CurrentData")

    # Always terminate the channel when done
    app.api.DDETerminate(channel)
    print("DDE Channel terminated.")

except Exception as e:
    print(f"An error occurred: {e}")
    # Ensure channel is terminated even on error (if it was opened)
    # In a robust script, you would check if 'channel' exists before calling DDETerminate.

# Close Excel
app.quit()
Important Notes:
- DDE is a legacy, less secure protocol. Its availability and behavior depend heavily on the operating system and application settings. Modern versions of Windows may restrict DDE operations by default for security reasons.
- The success of
DDEInitiatedepends entirely on the target application being running and configured to accept DDE conversations on the specified topic. - The xlwings
.apiproperty grants direct access to the underlying pywin32 COM object, allowing you to call methods likeDDEInitiatethat are not wrapped by a dedicated xlwings function. This is the standard approach for utilizing less common Excel Object Model members. - Always pair
DDEInitiatewithDDETerminateto properly close the channel and free system resources. Failing to do so can lead to memory leaks or unstable application states. - For most new development, exploring alternatives like a dedicated API, COM automation, or file-based exchange is strongly recommended over DDE.
How To Set Tick Labels Using xlwings?
【Method】
The text labels corresponding to the positions of the major tick marks on the axis are called **tick labels**. These labels annotate the values or categories corresponding to the major tick marks.
For a category axis, the text of the tick labels represents the names of the associated categories in the chart. By default, the tick labels for a category axis are numbers, which start from 1 and increase in order from left to right. The **TickLabelSpacing** property can be used to set how many categories are displayed before a tick label is shown.
For a value axis, the text labels correspond to the major unit, minimum scale, and maximum scale properties of the axis. To change the tick label text for a value axis, you need to modify the values of these properties.
The **TickLabels** property of the **Axis** object returns a **TickLabels** object that represents the tick labels on the axis. By using the properties and methods of the **TickLabels** object, you can set various properties of the tick labels, such as font, number format, display direction, offset, and alignment.
Use the **TickLabelPosition** property to specify the position of the tick labels on the axis. The values for this property are constants or values as listed in the table below:
|
Name |
Value |
Description |
|
xlTickLabelPositionHigh |
-4127 |
Top or right side of the chart |
|
xlTickLabelPositionLow |
-4134 |
Bottom or left side of the chart |
|
xlTickLabelPositionNextToAxis |
4 |
Next to the axis (where the axis is not at any side of the chart) |
|
xlTickLabelPositionNone |
-4142 |
No tick labels |
The **TickLabelSpacing** property allows you to return or set the number of categories or data series between each tick label. This property is only applicable for category axes and series axes and can be set to a value between 1 and 31999.
When the **TickLabelSpacingIsAuto** property is set to `True`, Excel will automatically adjust the spacing of the tick labels.
sht.api.Range(‘A1:B7’).Select() #Data
cht=sht.api.Shapes.AddChart().Chart #Add chart
axs=cht.Axes(1) #Horizontal axis
axs2=cht.Axes(2) #Vertical axis
tl=axs2.TickLabels #Vertical axis tick labels
tl.NumberFormat = ‘0.00’ #Number format
axs2.TickLabelPosition=xw.constants.Constants.xlHigh
【Example】
【Code】
#Axis - Tick labels

import xlwings as xw
import os

root = os.getcwd()
app = xw.App(visible=True, add_book=False)
wb=app.books.open(root+r'/P1P2.xlsx',read_only=False)
sht=wb.sheets(1)

sht.api.Range('A1:B7').Select()    #Data
cht=sht.api.Shapes.AddChart().Chart    #Add chart
axs=cht.Axes(1)    #Horizontal axis
axs2=cht.Axes(2)    #Vertical axis
tl=axs2.TickLabels    #Vertical axis tick labels
tl.NumberFormat = '0.00'    #Number format

axs2.TickLabelPosition=xw.constants.Constants.xlHigh

#wb.save()
#wb.close()
#app.kill()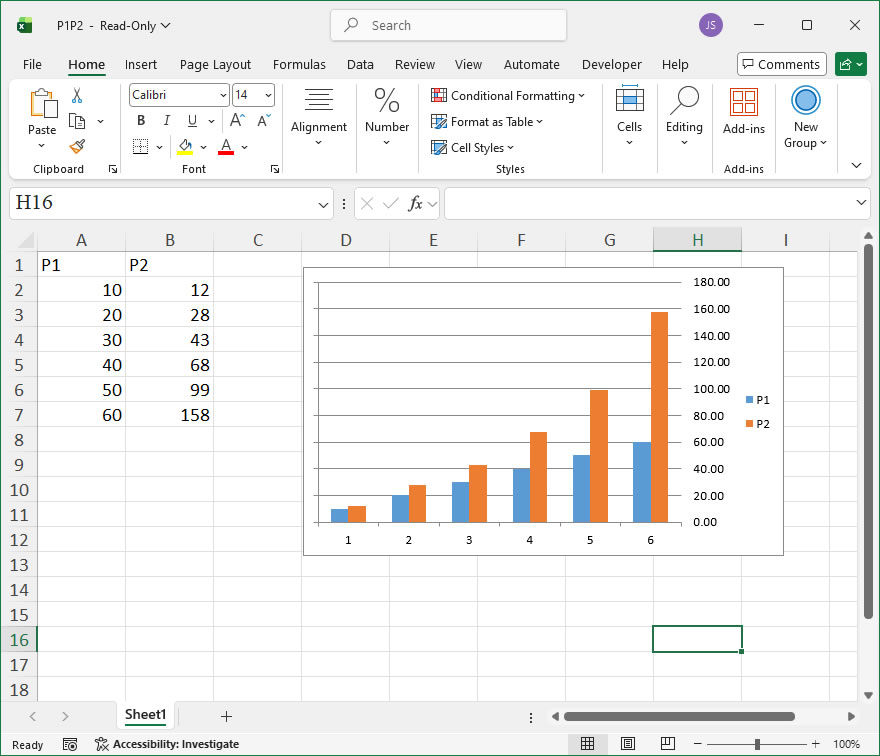
How to use Application.DDEExecute in the xlwings API way
The DDEExecute member of the Application object in Excel enables dynamic data exchange (DDE) commands to be sent from Excel to another application that supports DDE. This is a legacy method primarily used for inter-process communication in older Windows systems, where Excel can instruct another program (like a data source or another Office application) to perform specific actions via established DDE channels. While modern automation often uses COM or other APIs, DDEExecute remains available for compatibility with legacy systems. In xlwings, this functionality is accessed through the api property, which exposes the underlying Excel object model.
Syntax in xlwings:app.api.DDEExecute(Channel, Command)
- Channel: Required. A Long integer representing the DDE channel number previously opened using the
DDEInitiatemethod. This channel establishes the connection to the external application. - Command: Required. A String specifying the command to be sent to the external application. The format of this command depends entirely on the receiving application’s DDE interface (e.g., it might be a macro name or data instruction).
Example with xlwings:
Below is a step-by-step example demonstrating how to use DDEExecute via xlwings to send a command to another application (e.g., a hypothetical data server). First, ensure xlwings is installed (pip install xlwings). The code initiates a DDE channel with an external application and then executes a command.
import xlwings as xw

# Start Excel application
app = xw.apps.active # Use active instance or xw.App() for new

# Initiate a DDE channel to an external application (e.g., a server named "MyServer")
# Note: DDEInitiate requires the application and topic; adjust based on target app.
channel = app.api.DDEInitiate("MyServer", "System")

# Send a command via DDEExecute to request data or trigger an action
# For instance, a command to refresh data in the external app
command = "[RefreshAll]" # Example command; refer to target app's DDE documentation
app.api.DDEExecute(channel, command)

# Close the DDE channel after use
app.api.DDETerminate(channel)

print("DDE command executed successfully.")
Notes:
- The
Channelmust be valid and active; otherwise, an error occurs. - The
Commandstring should match the syntax expected by the external application—consult its DDE documentation for specifics. - DDE is outdated and may not be supported in all environments; consider alternatives like COM or APIs for new projects.
- Error handling (e.g., try-except blocks) is recommended to manage potential failures in channel initiation or command execution.
How To Set Tick Marks Using xlwings?
【Method】
Tick marks are short lines on the axis used to help determine the position of data points on the chart. There are major and minor tick marks. Use the **MajorTickMark** and **MinorTickMark** properties of the **Axis** object to set the major and minor tick marks.
The possible values for **MajorTickMark** and **MinorTickMark** are as follows:
|
Name |
Value |
Description |
|
xlTickMarkCross |
4 |
Across the axis |
|
xlTickMarkInside |
2 |
Inside the axis |
|
xlTickMarkNone |
-4142 |
No marker |
|
xlTickMarkOutside |
3 |
Outside the axis |
Use the **TickMarkSpacing** property to return or set the spacing of major tick marks, indicating how often a major tick mark is displayed for every set of data points. This is only applicable for category axes and series axes and can be a value between 1 and 31999.
Use the **MajorUnit** and **MinorUnit** properties to set the units for the major and minor tick marks on the value axis.
Set **MajorUnitIsAuto** and **MinorUnitIsAuto** properties to `True` to have Excel automatically calculate the major and minor tick units for the value axis.
sht.api.Range(‘A1:B7’).Select() #Data
cht=sht.api.Shapes.AddChart().Chart #Add chart
axs=cht.Axes(1) #Horizontal axis
axs2=cht.Axes(2) #Vertical axis
axs.MajorTickMark = 4
axs.MinorTickMark = 2
axs.TickMarkSpacing = 1
axs2.MajorUnit = 40
axs2.MinorUnit = 10
axs2.MajorUnitIsAuto=True
axs2.MinorUnitIsAuto=True
【Example】
【Code】
#Axis - Major tick marks

import xlwings as xw
import os

root = os.getcwd()
app = xw.App(visible=True, add_book=False)
wb=app.books.open(root+r"/P1P2.xlsx",read_only=False)
sht=wb.sheets(1)

sht.api.Range('A1:B7').Select()    #Data
cht=sht.api.Shapes.AddChart().Chart    #Add chart
axs=cht.Axes(1)    #Horizontal axis
axs2=cht.Axes(2)    #Vertical axis
axs.MajorTickMark = 4
axs.MinorTickMark = 2
axs.TickMarkSpacing = 1
axs2.MinorTickMark = 2
axs2.MajorUnit = 40
axs2.MinorUnit = 10
#axs2.MajorUnitIsAuto=True
#axs2.MinorUnitIsAuto=True

#wb.save()
#wb.close()
#app.kill()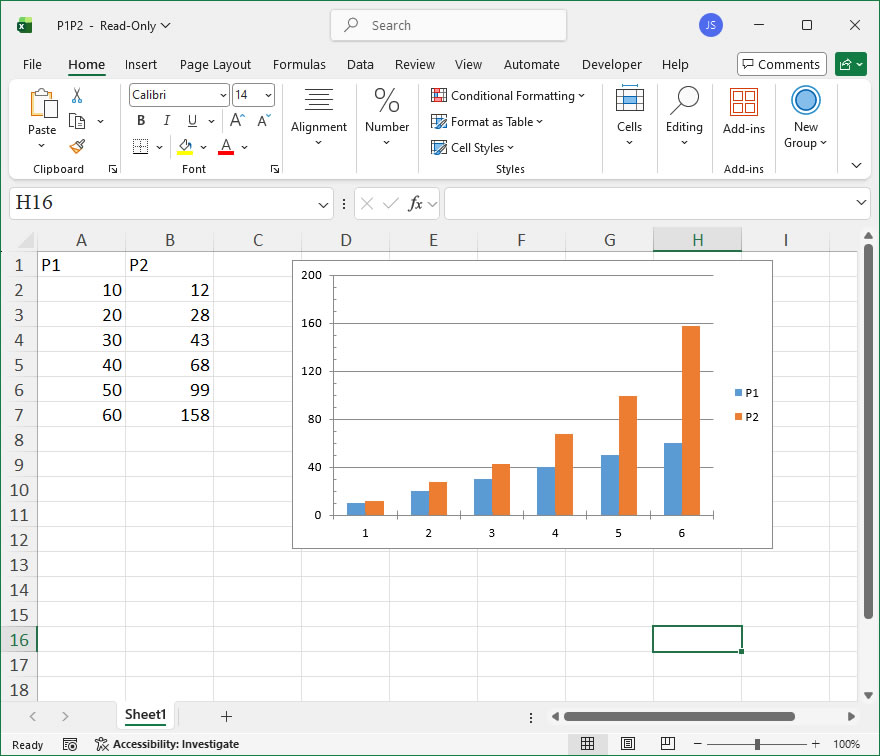
How to use Application.ConvertFormula in the xlwings API way
The Application.ConvertFormula method in Excel is a powerful tool for transforming formula references between different reference styles, such as converting between A1 and R1C1 notation, or between relative, absolute, and mixed references. In xlwings, this functionality is exposed through the api property, allowing Python scripts to leverage Excel’s native conversion capabilities programmatically. This is particularly useful when generating or modifying formulas dynamically, ensuring compatibility across different workbook settings or user preferences.
Functionality
The primary purpose of ConvertFormula is to change the reference style of a formula. It can convert a formula string from the A1 reference style to R1C1, or vice versa. Additionally, it can modify the reference type—converting relative references (like A1) to absolute ($A$1), mixed (A$1 or $A1), or back. This is essential for tasks like template generation, where formulas need to be adjusted based on cell positions, or for macros that interact with formulas in a style-agnostic manner.
Syntax in xlwings
In xlwings, you access this method via the api property of the App or Book objects. The full syntax is:
app.api.ConvertFormula(Formula, FromReferenceStyle, ToReferenceStyle, ToAbsolute, RelativeTo)The parameters are as follows:
- Formula (string): The formula string to be converted. This should be provided as text, without a leading equals sign.
- FromReferenceStyle (int): The reference style of the input formula. Use
xlA1(or1) for A1 style, andxlR1C1(or-4150) for R1C1 style. - ToReferenceStyle (int): The desired reference style for the output. Same options as
FromReferenceStyle. - ToAbsolute (int): Specifies the type of absolute reference conversion. This parameter is optional and defaults to
xlAbsolute(or1). The common values are: xlAbsolute(1): Converts to absolute references.xlRelRowAbsColumn(2): Converts to mixed references with relative row and absolute column (e.g.,A$1becomesA1in relative terms).xlAbsRowRelColumn(3): Converts to mixed references with absolute row and relative column (e.g.,$A1becomesA1in relative terms).xlRelative(4): Converts to relative references.- RelativeTo (object): A Range object that specifies the starting cell for relative references. This is required if
ToAbsoluteis set toxlRelRowAbsColumn,xlAbsRowRelColumn, orxlRelative. It defines the context for relative conversions.
Code Examples
- Converting from A1 to R1C1 style:
import xlwings as xw
app = xw.App(visible=False)
# Convert the formula "SUM(A1:B2)" from A1 to R1C1 style
result = app.api.ConvertFormula("SUM(A1:B2)", 1, -4150)
print(result) # Output: SUM(R1C1:R2C2)
app.quit()- Changing relative references to absolute:
import xlwings as xw
app = xw.App(visible=False)
# Convert "A1+B2" to absolute references in A1 style
result = app.api.ConvertFormula("A1+B2", 1, 1, 1)
print(result) # Output: $A$1+$B$2
app.quit()- Using relative conversion with a specific cell context:
import xlwings as xw
app = xw.App(visible=False)
book = app.books.add()
sheet = book.sheets[0]
# Define the relative starting cell as C3
relative_cell = sheet.range("C3").api
# Convert "A1" to a relative reference based on C3
result = app.api.ConvertFormula("A1", 1, 1, 4, relative_cell)
print(result) # Output: This will be a relative formula like "RC[-2]" in R1C1, but in A1 style, it adjusts accordingly.
book.close()
app.quit()How To Set Value Range of Value Axis Using xlwings?
【Method】
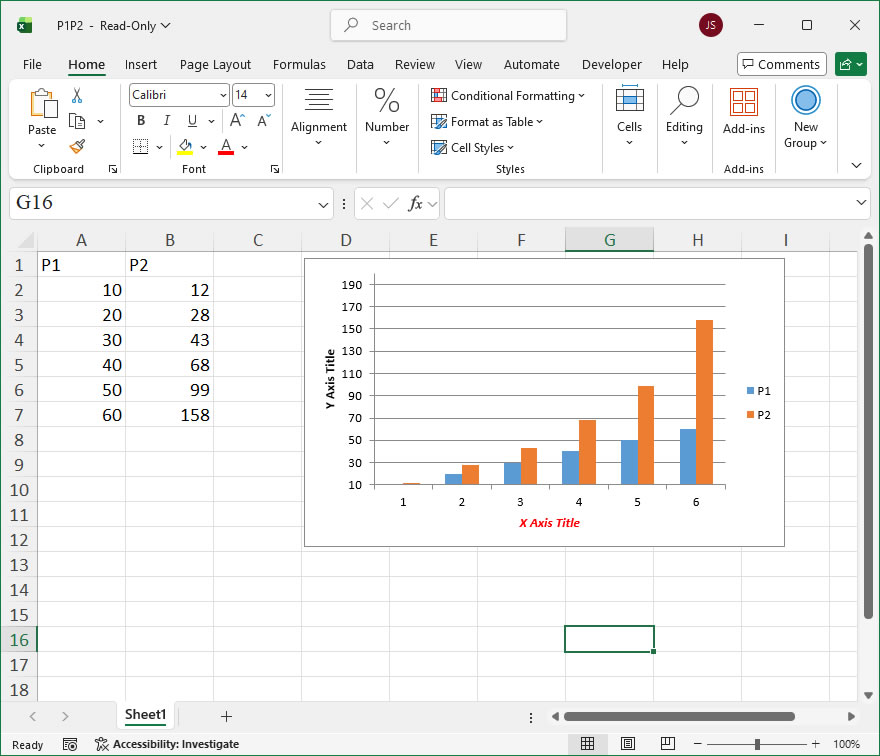
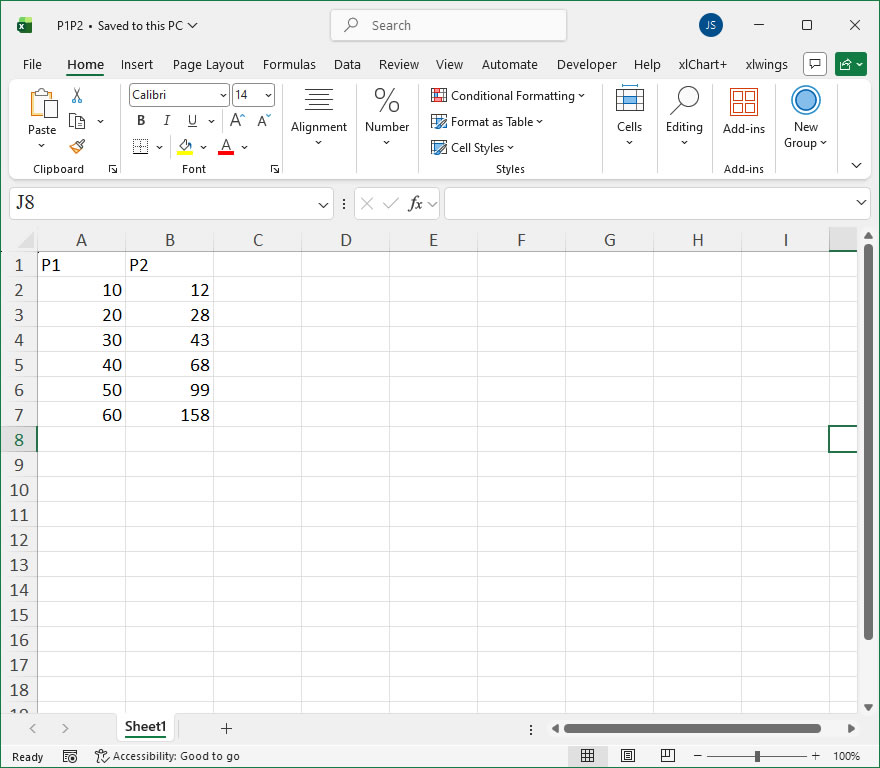
For the vertical axis (which is a value axis), use the **MinimumScale** and **MaximumScale** properties of the vertical axis object to set the minimum and maximum values for the value axis.
sht.api.Range(‘A1:B7’).Select() #Data
cht=sht.api.Shapes.AddChart().Chart #Add chart
axs=cht.Axes(1) #Horizontal axis
axs2=cht.Axes(2) #Vertical axis
axs.HasTitle=True #Horizontal axis has title
axs.AxisTitle.Caption=’X Axis Title’ #Title text
axs.AxisTitle.Font.Italic=True #Italic font
axs.AxisTitle.Font.Color=xw.utils.rgb_to_int((255,0,0)) #Red
axs2.HasTitle=True #Vertical axis has title
axs2.AxisTitle.Caption=’Y Axis Title’ #Title text
axs2.AxisTitle.Font.Bold=True #Bold font
axs2.MinimumScale=10
axs2.MaximumScale=200
【Example】
【Code】
#Axis - Value Axis Range

import xlwings as xw
import os

root = os.getcwd()
app = xw.App(visible=True, add_book=False)
wb=app.books.open(root+r'/P1P2.xlsx',read_only=False)
sht=wb.sheets(1)

sht.api.Range('A1:B7').Select()    #Data
cht=sht.api.Shapes.AddChart().Chart    #Add chart
axs=cht.Axes(1)    #Horizontal axis
axs2=cht.Axes(2)    #Vertical axis
axs.HasTitle=True    #Horizontal axis has title
axs.AxisTitle.Caption='X Axis Title'    #Title text
axs.AxisTitle.Font.Italic=True    #Italic font
axs.AxisTitle.Font.Color=xw.utils.rgb_to_int((255,0,0))    #Red
axs2.HasTitle=True    #Vertical axis has title
axs2.AxisTitle.Caption='Y Axis Title'    #Title text
axs2.AxisTitle.Font.Bold=True    #Bold font
axs2.MinimumScale=10
axs2.MaximumScale=200

#wb.save()
#wb.close()
#app.kill()