Blog
How To Set Axis Title Using xlwings?
【Method】
Use the **HasTitle** property of the **Axis** object to set whether the axis title is displayed, and the **AxisTitle** property to set the text content of the axis title. Note that the **HasTitle** property must be set to `True` before the **AxisTitle** property can be set. The **AxisTitle** property returns an **AxisTitle** object, which you can use to set the title text and font for the axis.
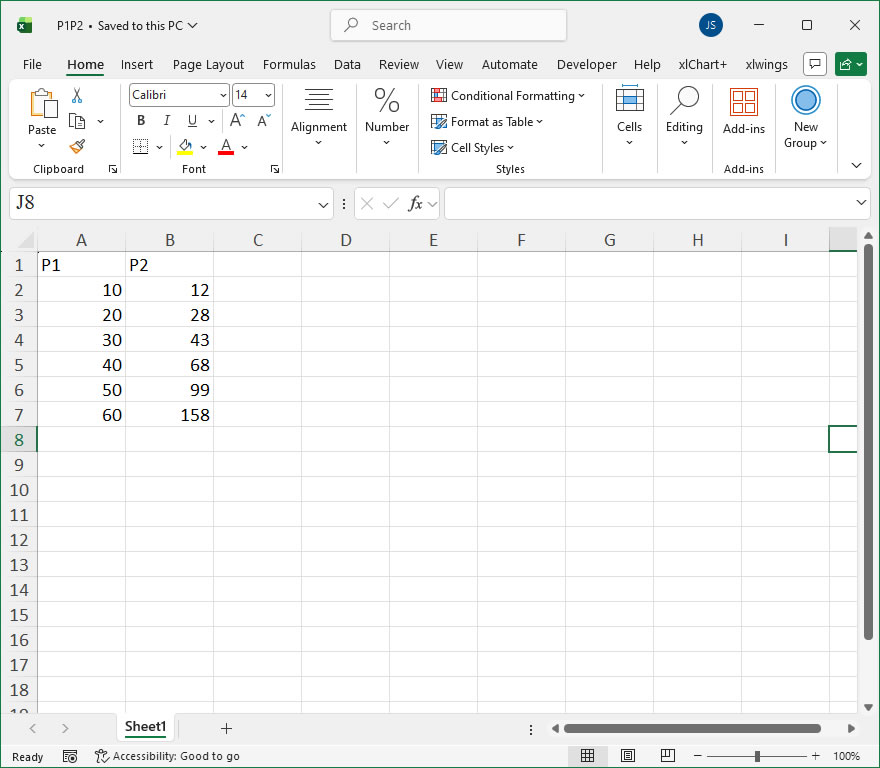
sht.api.Range(‘A1:B7’).Select() #Data
cht=sht.api.Shapes.AddChart().Chart #Add chart
axs=cht.Axes(1) #Horizontal axis
axs2=cht.Axes(2) #Vertical axis
axs.HasTitle=True #Horizontal axis has title
axs.AxisTitle.Caption=’X Axis Title’ #Title text
axs.AxisTitle.Font.Italic=True #Italic font
axs.AxisTitle.Font.Color=xw.utils.rgb_to_int((255,0,0)) #Red
axs2.HasTitle=True #Vertical axis has title
axs2.AxisTitle.Caption=’Y Axis Title’ #Title text
axs2.AxisTitle.Font.Bold=True #Bold font
【Example】
【Code】
#Axis Titles

import xlwings as xw
import os

root = os.getcwd()
app = xw.App(visible=True, add_book=False)
wb=app.books.open(root+r'/P1P2.xlsx',read_only=False)
sht=wb.sheets(1)

sht.api.Range('A1:B7').Select()    #Data
cht=sht.api.Shapes.AddChart().Chart    #Add chart
axs=cht.Axes(1)    #Horizontal axis
axs2=cht.Axes(2)    #Vertical axis
axs.HasTitle=True    #Horizontal axis has title
axs.AxisTitle.Caption='X Axis Title'    #Title text
axs.AxisTitle.Font.Italic=True    #Italic font
axs.AxisTitle.Font.Color=xw.utils.rgb_to_int((255,0,0))    #Red
axs2.HasTitle=True    #Vertical axis has title
axs2.AxisTitle.Caption='Y Axis Title'    #Title text
axs2.AxisTitle.Font.Bold=True    #Bold font

#wb.save()
#wb.close()
#app.kill()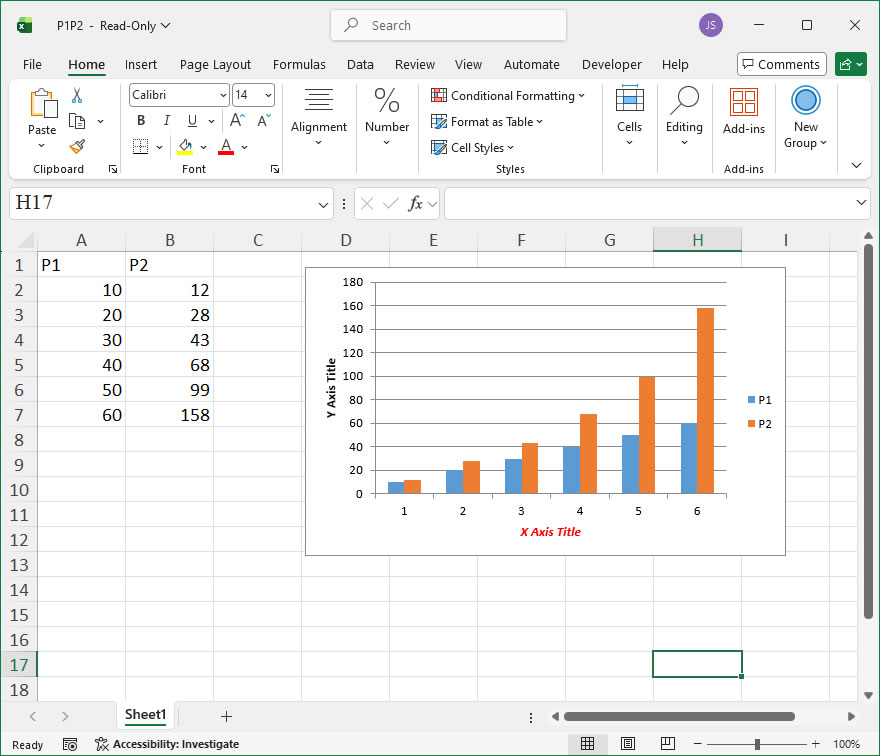
How to use Application.CheckAbort in the xlwings API way
The Application.CheckAbort member in Excel’s object model is a property that allows developers to check whether a user has requested to abort a running macro or operation, typically by pressing the Esc key or Ctrl+Break. In xlwings, this functionality is accessed through the Application object, enabling you to programmatically determine if an abort has been initiated, which is useful for implementing graceful termination in long-running scripts. This property is read-only and returns a Boolean value, indicating the state of the abort request.
In xlwings, the Application.CheckAbort property is accessed via the api property of the App or Book objects, which provides direct access to the underlying Excel object model. The syntax for using it in xlwings is as follows:
app = xw.apps.active # Get the active Excel application
check_abort = app.api.CheckAbort
Here, app is an instance of the xlwings App object, and app.api exposes the native Excel Application object. The CheckAbort property does not take any parameters. It returns True if an abort has been requested by the user, and False otherwise. This property is typically used within loops or iterative processes to check for user interruptions, allowing the code to exit cleanly without causing errors or crashes.
For example, consider a scenario where you are processing a large dataset in Excel using xlwings, and you want to allow the user to cancel the operation. You can periodically check the Application.CheckAbort property within a loop. Below is a code instance demonstrating its usage:
import xlwings as xw
import time

# Connect to the active Excel application
app = xw.apps.active

# Simulate a long-running process, such as iterating through rows
for i in range(1, 10001):
    # Check if the user has requested an abort
    if app.api.CheckAbort:
        print("Abort requested by user. Exiting loop.")
        break

    # Perform some operation, e.g., updating a cell value
    sheet = app.books.active.sheets[0]
    sheet.range(f'A{i}').value = f'Processed row {i}'

    # Simulate a delay to mimic processing time
    time.sleep(0.01)

# Optional: Update status every 1000 iterations
if i % 1000 == 0:
    print(f"Processed {i} rows...")

print("Process completed or aborted.")
In this example, the loop iterates through 10,000 rows, updating cells in column A. Before each iteration, it checks app.api.CheckAbort. If the user presses Esc or Ctrl+Break during execution, the property becomes True, triggering the break statement to exit the loop early. This ensures that the macro stops gracefully, and a message is printed to indicate the abort. Without this check, the user might have to force-close Excel or encounter unresponsive behavior.
How To Set Axis Using xlwings?
【Method】
The Border property returns the axis’s border properties.
– ColorIndex property
– Weight property
– DashStyle property
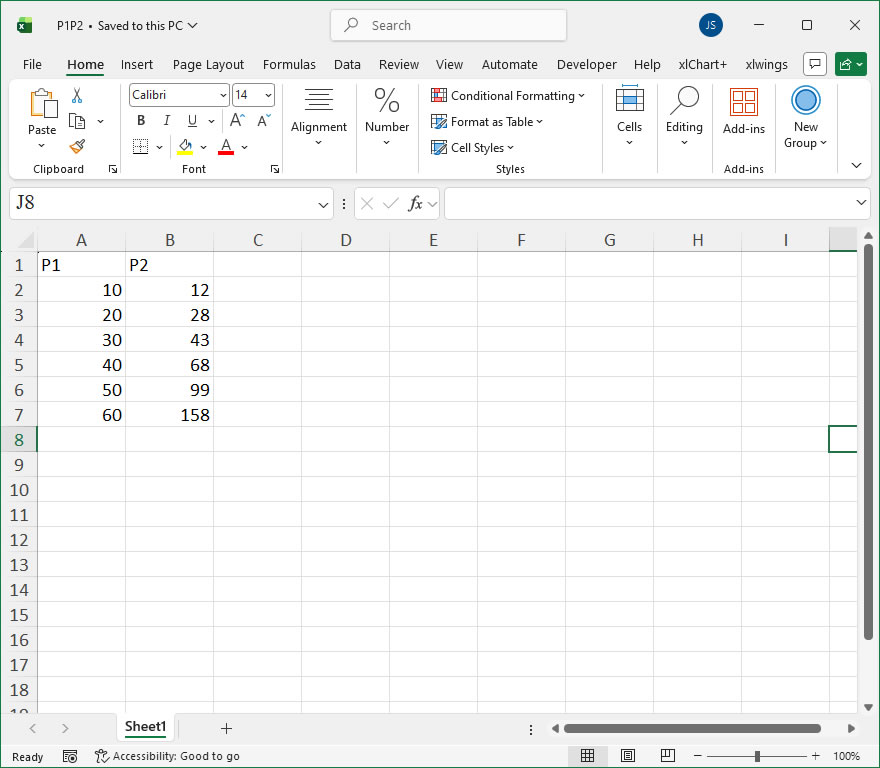
sht.api.Range(“A1:B7”).Select() #Data
cht=sht.api.Shapes.AddChart().Chart #Add chart
axs=cht.Axes(1) #Horizontal axis
axs.Border.ColorIndex=3 #Red
axs.Border.Weight=3 #Line width
axs.HasMinorGridlines=True #Show minor gridlines
axs2=cht.Axes(2) #Vertical axis
axs2.Border.Color=xw.utils.rgb_to_int((0,0,255)) #Blue
axs2.Border.Weight=3 #Line width
axs2.HasMinorGridlines=True #Show minor gridlines
【Example】
【Code】
#Axis Settings

import xlwings as xw
import os

root = os.getcwd()
app = xw.App(visible=True, add_book=False)
wb=app.books.open(root+r"/P1P2.xlsx",read_only=False)
sht=wb.sheets(1)

sht.api.Range("A1:B7").Select()    #Data
cht=sht.api.Shapes.AddChart().Chart    #Add chart
axs=cht.Axes(1)    #Horizontal axis
axs.Border.ColorIndex=3    #Red
axs.Border.Weight=3    #Line width
axs.HasMinorGridlines=True    #Show minor gridlines
axs2=cht.Axes(2)    #Vertical axis
axs2.Border.Color=xw.utils.rgb_to_int((0,0,255))    #Blue
axs2.Border.Weight=3    #Line width
axs2.HasMinorGridlines=True    #Show minor gridlines

#wb.save()
#wb.close()
#app.kill()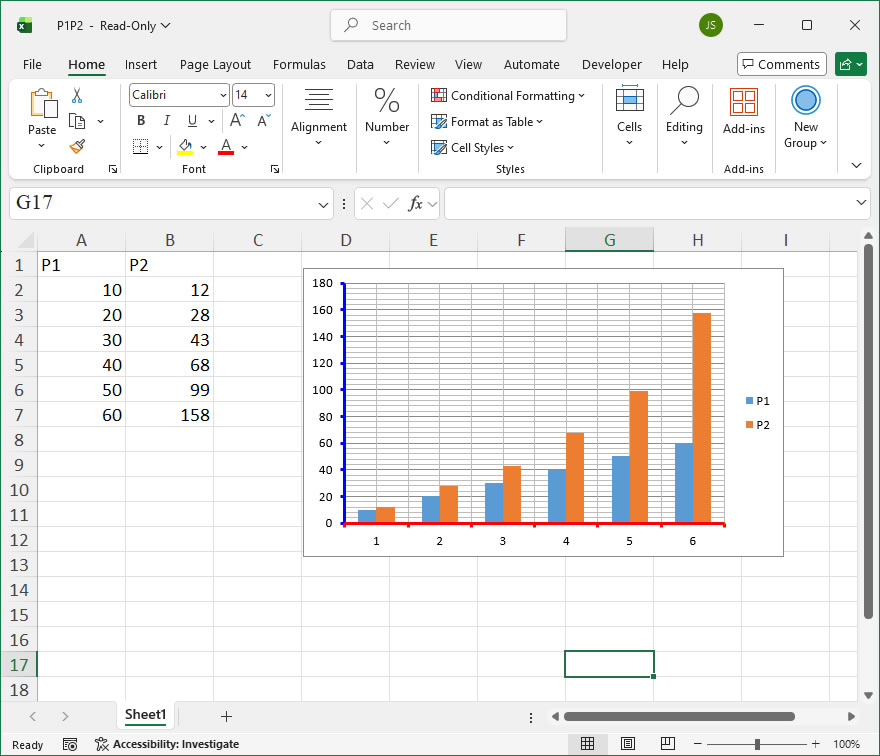
How to use Application.CentimetersToPoints in the xlwings API way
The Application.CentimetersToPoints method in Excel’s object model is a utility function that converts a measurement from centimeters to points. In the context of xlwings, which provides a Pythonic interface to automate Excel, this method is accessible through the Application object. It is particularly useful when you need to set dimensions, such as row heights, column widths, or shape sizes, in points—Excel’s native unit for such measurements—while working with centimeter-based data. This conversion ensures precision and consistency in layout and formatting tasks, especially in international settings where centimeters are a common metric unit.
Syntax in xlwings:
In xlwings, you call this method via the app object, which represents the Excel application. The syntax is:app.api.CentimetersToPoints(Centimeters)
Centimeters: Required. A numeric value or expression representing the length in centimeters that you want to convert to points. This parameter can be a single number, a variable, or a calculated result.
The method returns aSingle(floating-point) value representing the equivalent measurement in points. Note that 1 centimeter is approximately equal to 28.3465 points in Excel, as points are defined as 1/72 of an inch, and 1 inch equals 2.54 centimeters.
Example Usage with xlwings:
Below are practical examples demonstrating how to use CentimetersToPoints in xlwings for various Excel automation tasks. These examples assume you have an Excel application instance running via xlwings.
- Converting a Single Measurement:
This example converts 5 centimeters to points and prints the result. It is useful for quick calculations or debugging.
import xlwings as xw
app = xw.App(visible=False) # Start Excel in the background
points_value = app.api.CentimetersToPoints(5)
print(f"5 cm is equal to {points_value} points.") # Output: ~141.7325 points
app.quit()- Setting Column Width Based on Centimeters:
Here, we set the width of column A in the active workbook to a specific centimeter value by converting it to points. Excel’s column width is measured in points (or character units, but points are used for precise control via API).
import xlwings as xw
app = xw.App(visible=True)
wb = app.books.active
ws = wb.sheets[0]
# Convert 3.5 cm to points and set as column width for column A
width_in_points = app.api.CentimetersToPoints(3.5)
ws.api.Columns("A").ColumnWidth = width_in_points
wb.save()
app.quit()- Adjusting Row Height Dynamically:
This example uses a loop to set row heights for multiple rows based on a list of centimeter values. It showcases how to integrate the conversion into batch operations.
import xlwings as xw
app = xw.App(visible=False)
wb = app.books.add()
ws = wb.sheets[0]
cm_heights = [2.0, 2.5, 3.0] # Heights in centimeters for rows 1 to 3
for i, cm in enumerate(cm_heights, start=1):
points_height = app.api.CentimetersToPoints(cm)
ws.api.Rows(i).RowHeight = points_height
wb.save("adjusted_heights.xlsx")
app.quit()- Calculating Shape Dimensions:
When adding or resizing shapes, you might need to specify sizes in points. This example creates a rectangle with width and height derived from centimeter measurements.
import xlwings as xw
app = xw.App(visible=True)
wb = app.books.active
ws = wb.sheets[0]
# Define dimensions in centimeters
width_cm, height_cm = 4.0, 2.0
width_pts = app.api.CentimetersToPoints(width_cm)
height_pts = app.api.CentimetersToPoints(height_cm)
# Add a rectangle shape at position (100, 100) with converted dimensions
shape = ws.shapes.add_shape(
1, # Type: rectangle
100, 100, # Left and top positions in points
width_pts, height_pts
)
shape.name = "MetricRectangle"
wb.save()
app.quit()How To Set Axes Object and Axis Object Using xlwings?
【Method】
In Excel, the **Axis** object represents a single axis, and its plural form, the **Axes** object, represents multiple axes and the coordinate system they form. For a 2D coordinate system, there are horizontal and vertical axes; for a 3D coordinate system, there are axes in three directions.
To access the **Axis** object using the API, the syntax is as follows:
axs=cht.Axes(Type,AxisGroup)
Where `cht` is the **Chart** object, and the two parameters are:
– **Type** – A required parameter, with values 1, 2, or 3. When `Type = 1`, the axis displays categories (usually for the horizontal axis in a chart); when `Type = 2`, the axis displays values (usually for the vertical axis); when `Type = 3`, the axis displays data series (only used for 3D charts).
– **AxisGroup** – An optional parameter that specifies whether the axis is primary or secondary. If set to 2, it means the axis is a secondary axis. If set to 1, it means the axis is a primary axis.
You can use the **Chart** object’s **Axes** property to get the horizontal and vertical axes and set their properties. The **Border** property can be used to modify the axis’s color, line style, width, etc.
sht.api.Range(‘A1:B7’).Select() #Data
cht=sht.api.Shapes.AddChart2(-1,xw.constants.ChartType.xlColumnClustered,\
200,20,300,200,True).Chart #Add chart
【Example】

【Code】
#Coordinate system - Create chart

import xlwings as xw
import os

root = os.getcwd()
app = xw.App(visible=True, add_book=False)
wb=app.books.open(root+r'/P1P2.xlsx',read_only=False)
sht=wb.sheets(1)

sht.api.Range('A1:B7').Select()      #Data
cht=sht.api.Shapes.AddChart2(-1,xw.constants.ChartType.xlColumnClustered,\
                 200,20,300,200,True).Chart      #Add chart

#wb.save()
#wb.close()
#app.kill()
How to use Application.CalculateUntilAsyncQueriesDone in the xlwings API way
The Application.CalculateUntilAsyncQueriesDone property is a member of the Excel object model that provides control over the calculation process when asynchronous queries, such as those from Power Query (Get & Transform Data), are involved. In scenarios where a workbook contains data connections that refresh asynchronously, Excel’s standard calculation might proceed before these queries have fully completed. This can lead to formulas returning results based on outdated or incomplete data. The CalculateUntilAsyncQueriesDone property addresses this by forcing Excel to pause further calculation until all pending asynchronous queries have finished refreshing. This ensures subsequent calculations operate on the complete, current dataset.
In xlwings, you access this property through the Application object. The property is a read/write Boolean.
xlwings API Syntax and Parameters
The property is accessed directly on the app object (an instance of xw.App). There are no method parameters as it is a property, not a method.
- Get the current value:
current_state = app.api.CalculateUntilAsyncQueriesDone - Set the value:
app.api.CalculateUntilAsyncQueriesDone = Trueorapp.api.CalculateUntilAsyncQueriesDone = False
Property Value:
The property accepts and returns a Boolean value.
| Value | Meaning |
|---|---|
True | Excel will wait for all asynchronous queries to complete before continuing with any pending calculations. |
False | (Default) Excel will not wait for asynchronous queries to finish; calculations may proceed with potentially stale query data. |
Usage Example with xlwings
A typical use case is to set this property to True before triggering a full workbook calculation or before running a macro that depends on the latest query data. It is good practice to restore the original setting afterward.
import xlwings as xw

# Connect to the active Excel instance or create a new one
app = xw.apps.active

# Store the original setting
original_setting = app.api.CalculateUntilAsyncQueriesDone
print(f"Original CalculateUntilAsyncQueriesDone setting: {original_setting}")

try:
    # Ensure Excel waits for async queries
    app.api.CalculateUntilAsyncQueriesDone = True

    # Refresh all data connections (queries)
    app.api.ActiveWorkbook.RefreshAll()

    # Now perform a full calculation. Excel will wait for RefreshAll to finish.
    app.api.Calculate()

    # Your code to work with the calculated data...
    ws = app.api.ActiveSheet
    print(f"Value in A1 after refresh and calculation: {ws.Range('A1').Value}")

finally:
    # Restore the original setting
    app.api.CalculateUntilAsyncQueriesDone = original_setting
print(f"CalculateUntilAsyncQueriesDone restored to: {app.api.CalculateUntilAsyncQueriesDone}")How to use Application.CalculateFullRebuild in the xlwings API way
The Application.CalculateFullRebuild member in Excel performs a complete recalculation of all formulas in all open workbooks, including those that may depend on external data sources or custom functions. It ensures that every calculation is refreshed, which is particularly useful after making significant changes to data or formulas that might not update automatically through standard calculation methods. In xlwings, this functionality can be accessed via the api property, allowing Python scripts to trigger a full rebuild of calculations in Excel, similar to pressing Ctrl+Alt+Shift+F9 in the Excel interface. This is beneficial in scenarios where partial recalculations might leave stale values, such as when working with complex financial models, data analysis pipelines, or macros that modify large datasets.
Syntax in xlwings:
To use CalculateFullRebuild in xlwings, you need to reference the Excel Application object through the xlwings App or via an existing workbook. The member is a method with no parameters. The basic syntax is:
app.api.CalculateFullRebuild()Here, app represents an xlwings App instance connected to Excel. The api property provides direct access to the underlying Excel object model, enabling you to call the CalculateFullRebuild method. There are no arguments to pass, as the method simply triggers a full recalculation across all open workbooks in that Excel instance.
Example Usage:
Below is a practical example demonstrating how to use CalculateFullRebuild in a Python script with xlwings. This example assumes you have Excel open with workbooks containing formulas that need a complete refresh.
import xlwings as xw

# Connect to the active Excel instance or start a new one
app = xw.apps.active # Use the currently running Excel application
# Alternatively, start a new instance: app = xw.App()

# Trigger a full recalculation of all formulas in all open workbooks
app.api.CalculateFullRebuild()

print("Full recalculation completed for all open workbooks.")

# You can also specify a particular workbook if needed, but note that CalculateFullRebuild applies globally
wb = app.books['MyWorkbook.xlsx'] # Reference a specific workbook
# Even when referencing a workbook, CalculateFullRebuild still affects all open workbooks in the app
app.api.CalculateFullRebuild()

# To ensure changes are saved, you might add:
wb.save()
app.quit() # Close the Excel application if doneHow To Set Custom Styles Using xlwings?
【Example】

【Code】
import xlwings as xw
import os

def set_style(cht):
    cht.ChartArea.Format.Line.Visible=False
    cht.PlotArea.Format.Fill.Visible=False
    cht.PlotArea.Format.Line.Visible=True
    cht.PlotArea.Format.Line.ForeColor.RGB=xw.utils.rgb_to_int((200,200,200))
    #cht.PlotArea.Format.Line.ForeColor.ObjectThemeColor = msoThemeColorText1
    ax1=cht.Axes(1)
    ax2=cht.Axes(2)
    ax1.HasTitle=True
    ax1.AxisTitle.Text='Categories'
    ax1.AxisTitle.Font.Size=10
    ax1.TickLabels.Font.Size=8
    #ax1.TickLabels.NumberFormat='0.00'
    ax1.HasMajorGridlines=True
    ax2.HasTitle=True
    ax2.AxisTitle.Text='Values'
    ax2.AxisTitle.Font.Size=10
    ax2.TickLabels.Font.Size=8
    ax2.HasMajorGridlines=True
    cht.HasTitle=True
    #cht.ChartTitle.Caption='Plot'
    #cht.ChartTitle.Font.Size=12

root=os.getcwd()
app=xw.App(visible=True,add_book=False)
wb=app.books.open(root+r'/data.xlsx',read_only=False)
sht=wb.sheets('Sheet1')

sht.api.Range('A2:C8').Select()  #数据
shp=sht.api.Shapes.AddChart2(-1,xw.constants.ChartType.xlColumnClustered,20,20,350,250,True)
cht=shp.Chart  #添加图表
cht.SeriesCollection(1).ChartType=xw.constants.ChartType.xlLine

set_style(cht)

cht.Export(root+'/cht.jpg')
cht.Export(root+'/cht.svg')
cht.ExportAsFixedFormat(0,root+'/cht.pdf')

#wb.save()
#app.kill()
How to use Application.CalculateFull in the xlwings API way
The CalculateFull method of the Application object in Excel is a powerful feature for ensuring complete and accurate recalculation of all formulas in all open workbooks. This method forces a full calculation, meaning it recalculates every formula, regardless of whether Excel’s calculation engine considers them dirty or not. This is particularly useful in scenarios where you have complex, interdependent formulas, or when you have programmatically changed a large number of cells and want to guarantee that all subsequent formulas reflect these changes before proceeding. Unlike the standard Calculate method, which might only recalculate formulas marked as needing an update, CalculateFull provides a thorough and definitive recalculation cycle.
In the xlwings API, you access this method through the app object, which represents the Excel application. The syntax is straightforward, as the method does not take any parameters.
Syntax:
app.api.CalculateFull()app: This is your xlwingsAppinstance..api: This property provides direct access to the underlying Excel object model (the COM/API layer)..CalculateFull(): This is the method call. It requires no arguments.
Key Points:
- It affects all open workbooks in the Excel application instance.
- It is a synchronous operation; your xlwings code will wait until the full calculation is complete before executing the next line.
- This method is equivalent to pressing
Ctrl+Alt+Shift+F9in the Excel desktop application.
Code Examples:
- Basic Full Calculation:
This example ensures that after writing new data to a sheet, every formula in the application is recalculated.
import xlwings as xw

# Connect to the active Excel instance or start a new one
app = xw.apps.active

# Write some values that are inputs to formulas
app.books['MyWorkbook.xlsx'].sheets['Sheet1'].range('A1').value = 100
app.books['MyWorkbook.xlsx'].sheets['Sheet1'].range('A2').value = 200

# Force a full recalculation of all formulas in all open workbooks
app.api.CalculateFull()

# Now read a result from a formula cell, confident it's up-to-date
result = app.books['MyWorkbook.xlsx'].sheets['Sheet1'].range('C1').value
print(f"The calculated result is: {result}")- Using with Manual Calculation Mode:
This is a common use case. When calculation mode is set to manual, formulas are not updated automatically.CalculateFullgives you precise control over when the heavy computation occurs.
import xlwings as xw

app = xlwings.App(visible=True) # Start a new Excel app
wb = app.books.add()

# Set calculation mode to manual for performance
app.api.Calculation = -4135 # xlCalculationManual

# Perform extensive data manipulation
sheet = wb.sheets[0]
for i in range(1, 1001):
sheet.range(f'A{i}').value = i
# Formulas in column B reference column A
sheet.range(f'B{i}').formula = f'=A{i}*2'

# After all data is written, trigger one comprehensive calculation
print("Starting full calculation...")
app.api.CalculateFull() # This will recalculate all 1000 formulas
print("Calculation complete.")

# Sample the result
print(sheet.range('B500').value) # Will correctly output 1000.0
app.quit()How To Set Built-in Styles for Excel Charts Using xlwings?
【Example】

【Code】
import xlwings as xw
import os

root=os.getcwd()
app=xw.App(visible=True,add_book=False)
wb=app.books.open(root+r'/data.xlsx',read_only=False)
sht=wb.sheets('Sheet1')

sht.api.Range('A2:C11').Select()  #数据
cht1=sht.api.Shapes.AddChart2(228,xw.constants.ChartType.xlLine,10,20,350,250,True).Chart
cht2=sht.api.Shapes.AddChart2(230,xw.constants.ChartType.xlLine,20,20,350,250,True).Chart
cht3=sht.api.Shapes.AddChart2(232,xw.constants.ChartType.xlLine,30,20,350,250,True).Chart
cht4=sht.api.Shapes.AddChart2(233,xw.constants.ChartType.xlLine,40,20,350,250,True).Chart

cht1.Export(root+'/cht1.jpg')
cht1.Export(root+'/cht1.svg')
cht1.ExportAsFixedFormat(0,root+'/cht1.pdf')

cht2.Export(root+'/cht2.jpg')
cht2.Export(root+'/cht2.svg')
cht2.ExportAsFixedFormat(0,root+'/cht2.pdf')

cht3.Export(root+'/cht3.jpg')
cht3.Export(root+'/cht3.svg')
cht3.ExportAsFixedFormat(0,root+'/cht3.pdf')

cht4.Export(root+'/cht4.jpg')
cht4.Export(root+'/cht4.svg')
cht4.ExportAsFixedFormat(0,root+'/cht4.pdf')

#wb.save()
#app.kill()