Blog
How To Create Jittered Scatter Plot Using xlwings? 2
【Example】

【Code】
import xlwings as xw
import numpy as np
import os

def set_style(cht):
    cht.ChartArea.Format.Line.Visible=False
    cht.PlotArea.Format.Fill.Visible = False
    cht.PlotArea.Format.Line.Visible = True
    cht.PlotArea.Format.Line.ForeColor.RGB=xw.utils.rgb_to_int((200,200,200))
    #cht.PlotArea.Format.Line.ForeColor.ObjectThemeColor = msoThemeColorText1
    ax1 = cht.Axes(1)
    ax2 = cht.Axes(2)
    ax1.HasTitle = True
    ax1.AxisTitle.Text = 'Categories'
    ax1.AxisTitle.Font.Size = 10
    ax1.TickLabels.Font.Size = 8
    #ax1.TickLabels.NumberFormat = '0.00'
    ax1.HasMajorGridlines = True
    ax2.HasTitle = True
    ax2.AxisTitle.Text = 'Values'
    ax2.AxisTitle.Font.Size = 10
    ax2.TickLabels.Font.Size = 8
    ax2.HasMajorGridlines = True
    cht.HasTitle = True
    #cht.ChartTitle.Caption = 'Plot'
    #cht.ChartTitle.Font.Size = 12
    cht.HasLegend=False

root=os.getcwd()
app=xw.App(visible=True,add_book=False)
wb=app.books.open(root+r'/data.xlsx',read_only=False)
sht=wb.sheets('Sheet1')

#sht.api.Range('A1:B7').Select()  #数据
shp=sht.api.Shapes.AddChart2()
shp.Left=20
cht=shp.Chart  #添加图表
cht.ChartType=xw.constants.ChartType.xlXYScatter
ax1=cht.Axes(1)
ax2=cht.Axes(2)
ax1.MinimumScale=0.5
ax1.MaximumScale=4.5
ax2.MinimumScale=0
ax2.MaximumScale=0.35

set_style(cht)

data=sht.range('B2:E21').value
rd=[0 for _ in range(20)]
y=[0 for _ in range(20)]
for i in range(4):
    cht.SeriesCollection().NewSeries()
    for j in range(20):
        rd[j]=i+0.75+0.5*np.random.rand(1)[0]
        y[j]=data[j][i]
    cht.SeriesCollection(i+1).XValues=rd
    cht.SeriesCollection(i+1).Values=y

cht.Export(root+'/cht.jpg')
cht.Export(root+'/cht.svg')
cht.ExportAsFixedFormat(0,root+'/cht.pdf')

#wb.save()
#app.kill()
How to use Application.DisplayInsertOptions in the xlwings API way
The DisplayInsertOptions property of the Application object in Excel is a boolean setting that controls whether Excel displays the “Insert Options” button. This button appears when you insert cells, rows, or columns into a worksheet, offering a small drop-down menu with formatting choices (like “Format Same As Left” or “Clear Formatting”) to quickly adjust the formatting of the newly inserted cells. By default, this feature is enabled in Excel. Using the xlwings API, you can programmatically check the current state of this setting or turn it on or off, which can be useful for creating a cleaner user interface during automated processes or for ensuring consistent behavior in your macros.
Syntax in xlwings:
The property is accessed through the app object, which represents the Excel application.
app.display_insert_optionsThis property is both readable and writable. It expects a boolean value (True or False).
- Getting the current value:
current_state = app.display_insert_options - Setting the value:
app.display_insert_options = False
Parameters:
The property itself does not take parameters. When setting it, you assign a boolean value directly.
Code Examples:
- Checking the Current Setting:
This code checks if the Insert Options button is currently enabled and prints its status.
import xlwings as xw

# Connect to the active Excel instance
app = xw.apps.active

# Get the current state of DisplayInsertOptions
is_enabled = app.display_insert_options
print(f"The 'Insert Options' button is currently enabled: {is_enabled}")

# Optional: Close the connection
app.quit()- Disabling the Insert Options Button:
This script turns off the display of the Insert Options button. This is often done at the start of an automation script to prevent the button from appearing and potentially interfering with the visual flow of the macro.
import xlwings as xw

app = xw.apps.active

# Disable the Insert Options button
app.display_insert_options = False
print("Insert Options button has been disabled.")

# ... Perform other tasks like inserting rows/cells ...
# Example: Insert a row at the top of the active sheet
app.books.active.sheets.active.range('1:1').insert()

# Remember to re-enable it if desired for the user later
# app.display_insert_options = True- Toggling the Setting Based on a Condition:
This example shows a more practical use case where you might store the original setting, change it for your operations, and then restore it afterwards, ensuring the user’s preference is maintained.
import xlwings as xw

def run_clean_insertion():
app = xw.apps.active
original_setting = app.display_insert_options # Store original state

try:
    app.display_insert_options = False # Turn off for our operations

    # Perform a series of insertions without the button appearing
    sheet = app.books.active.sheets.active
    sheet.range('A5').insert('down') # Insert a cell, shifting down
    sheet.range('C:C').insert() # Insert a column

finally:
    app.display_insert_options = original_setting # Restore original state
    print(f"Insert Options setting restored to: {original_setting}")

if __name__ == '__main__':
run_clean_insertion()How To Create Jittered Scatter Plot Using xlwings?
【Example】
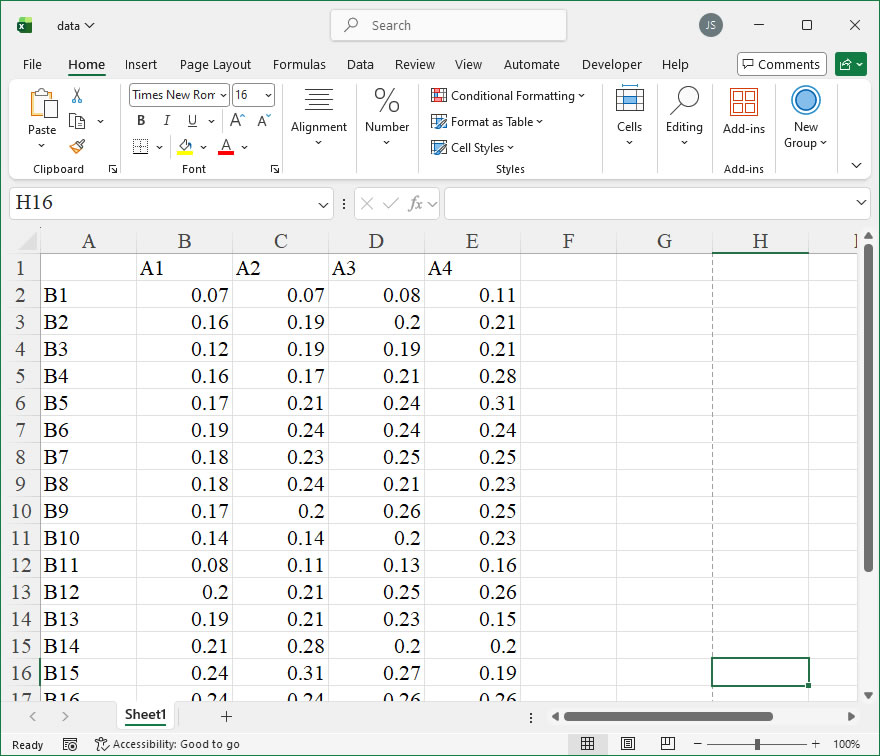
【Code】
import xlwings as xw
import os

def set_style(cht):
    cht.ChartArea.Format.Line.Visible=False
    cht.PlotArea.Format.Fill.Visible = False
    cht.PlotArea.Format.Line.Visible = True
    cht.PlotArea.Format.Line.ForeColor.RGB=xw.utils.rgb_to_int((200,200,200))
    #cht.PlotArea.Format.Line.ForeColor.ObjectThemeColor = msoThemeColorText1
    ax1 = cht.Axes(1)
    ax2 = cht.Axes(2)
    ax1.HasTitle = True
    ax1.AxisTitle.Text = 'Categories'
    ax1.AxisTitle.Font.Size = 10
    ax1.TickLabels.Font.Size = 8
    #ax1.TickLabels.NumberFormat = '0.00'
    ax1.HasMajorGridlines = True
    ax2.HasTitle = True
    ax2.AxisTitle.Text = 'Values'
    ax2.AxisTitle.Font.Size = 10
    ax2.TickLabels.Font.Size = 8
    ax2.HasMajorGridlines = True
    cht.HasTitle = True
    #cht.ChartTitle.Caption = 'Plot'
    #cht.ChartTitle.Font.Size = 12
    cht.HasLegend=False


root=os.getcwd()
app=xw.App(visible=True,add_book=False)
wb=app.books.open(root+r'/data.xlsx',read_only=False)
sht=wb.sheets('Sheet1')

#sht.api.Range('A1:B7').Select()  #数据
shp=sht.api.Shapes.AddChart2()
shp.Left=20
cht=shp.Chart  #添加图表
cht.ChartType=xw.constants.ChartType.xlXYScatter
ax1=cht.Axes(1)
ax2=cht.Axes(2)
ax1.MinimumScale=0.5
ax1.MaximumScale=4.5
ax2.MinimumScale=0
ax2.MaximumScale=0.35

set_style(cht)

data=sht.range('B2:E21').value
rd=[0 for _ in range(20)]
y=[0 for _ in range(20)]
for i in range(4):
    cht.SeriesCollection().NewSeries()
    for j in range(20):
        rd[j]=i+1
        y[j]=data[j][i]
    cht.SeriesCollection(i+1).XValues=rd
    cht.SeriesCollection(i+1).Values=y

cht.Export(root+'/cht.jpg')
cht.Export(root+'/cht.svg')
cht.ExportAsFixedFormat(0,root+'/cht.pdf')

#wb.save()
#app.kill()
How to use Application.DisplayFunctionToolTips in the xlwings API way
Functionality
The DisplayFunctionToolTips property of the Excel Application object controls whether function tooltips are displayed. A function tooltip is the small, yellow pop-up box that appears as you begin typing a function into a formula bar or a cell. It provides a brief syntax guide and description for the function’s arguments. When DisplayFunctionToolTips is set to True, these helpful prompts are shown; when set to False, they are suppressed. This property is part of the user interface customization options and can be useful for streamlining the Excel environment for advanced users or in automated applications where pop-ups might interfere with other processes.
Syntax
In xlwings, you access this property through the Application object. The property is a read/write Boolean.
- Get the current state:
current_state = xw.apps[app_key].display_function_tooltipsapp_key: The key identifier for the Excel application instance. This can be an integer index (e.g.,0for the first instance) or the PID of the process. If you have a single instance or are usingxw.Book, you can often usexw.apps.active.- Set the state:
xw.apps[app_key].display_function_tooltips = new_statenew_state: A Boolean value (TrueorFalse).
Code Examples
- Checking and Reporting the Current Setting:
This example connects to the active Excel instance, reads the currentDisplayFunctionToolTipssetting, and prints its status.
import xlwings as xw

# Connect to the active Excel application
app = xw.apps.active

# Get the current state of function tooltips
tooltips_enabled = app.display_function_tooltips

# Report the status
if tooltips_enabled:
    print("Function tooltips are currently ENABLED.")
else:
print("Function tooltips are currently DISABLED.")- Temporarily Disabling Tooltips for a Task:
This pattern is useful when performing automated data entry or manipulation where pop-ups are not needed. It saves the original state, disables tooltips, performs its task, and then restores the original setting, ensuring the user’s preference is maintained.
import xlwings as xw

# Connect to the active Excel application and workbook
app = xw.apps.active
wb = app.books.active

# 1. Store the original setting
original_setting = app.display_function_tooltips

try:
    # 2. Disable function tooltips
    app.display_function_tooltips = False
    print("Function tooltips disabled for automation.")

    # 3. Perform automated tasks (e.g., writing formulas)
    # This example writes a simple SUM formula. No tooltip will appear.
    ws = wb.sheets[0]
    ws.range("A1").value = "Data"
    ws.range("B1").value = 10
    ws.range("B2").value = 20
    ws.range("B3").formula = "=SUM(B1:B2)"

    print(f"Formula written to B3: {ws.range('B3').formula}")

finally:
    # 4. Restore the original setting reliably
    app.display_function_tooltips = original_setting
print(f"Function tooltips restored to: {original_setting}")- Ensuring Tooltips are Enabled for User Interaction:
This example explicitly enables function tooltips, which can be part of a setup routine to ensure a user-friendly environment before handing control over to a person.
import xlwings as xw

# Start or connect to Excel
app = xw.App(visible=True) # or xw.apps.active
wb = app.books.add()

# Ensure function tooltips are turned ON
app.display_function_tooltips = True
print("Function tooltips have been enabled for user interaction.")

# Guide the user (simulated here by a formula placeholder)
ws = wb.sheets[0]
ws.range("A1").value = "Enter a function (e.g., =VLOOKUP() ) in cell B1 to see the tooltip."

# The application is now ready. Tooltips will appear as the user types.
# app.visible = True # Ensure Excel is visible if it wasn't alreadyHow To Create Bivariate Kernel Density Estimation Surface Plot Using xlwings?
【Example】
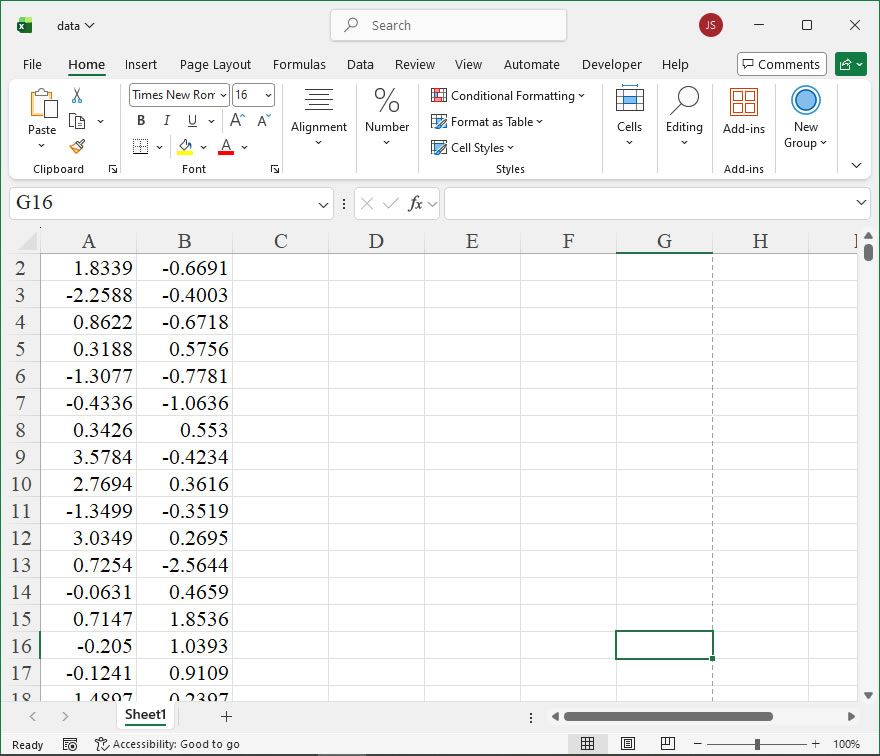
【Code】
import xlwings as xw
import numpy as np
import os

def kde2(dt1,dt2,x,y,w):
    #二元核密度估计
    my_sum=0
    count=0
    for i in dt1:
        for j in dt2:
            #Gaussian核函数(2D)
            my_sum+=np.exp(-((x-i)**2+(y-j)**2)/(2*w**2))/\
            (2*3.1416*w**2)
            count+=1
    return my_sum/count


root=os.getcwd()
app=xw.App(visible=True,add_book=False)
wb=app.books.open(root+r'/data.xlsx',read_only=False)
sht=wb.sheets('Sheet1')
dt1=sht.range('A1:A200').value
dt2=sht.range('B1:B200').value

#用Shapes创建图表
kdex=[0 for _ in range(40)]
kdey=[0 for _ in range(40)]
kdef=[[0 for _ in range(40)] for _ in range(40)]
for i in range(40):
    kdex[i]=(i- 20)/2
    kdey[i]=(i- 20)/2
for i in range(40):
    for j in range(40):
        kdef[i][j]=kde2(dt1,dt2,kdex[i],kdey[j],1.5)

sht2=wb.sheets.add()
sht2.name='plot'
for i in range(40):
    sht2.api.Cells(1, i+2).Value=kdex[i]
    sht2.api.Cells(i+2, 1).Value=kdey[i]
    for j in range(40):
        sht2.api.Cells(i+2,j+2).Value=kdef[i][j]

#创建曲面图表
shp=sht2.api.Shapes.AddChart2()
shp.Left=20
shp.Top=50
shp.Width=500
shp.Height=400
cht=shp.Chart
#设置图表数据范围
cht.SetSourceData(sht2.api.Range(sht2.api.Cells(2, 2),sht2.api.Cells(41, 41)))
#设置图表类型为三维曲面图
cht.ChartType=xw.constants.ChartType.xlSurface
#设置图表标题
cht.HasTitle=True
cht.ChartTitle.Text='Surface'
#设置轴标题
cht.Axes(1,1).HasTitle=True
cht.Axes(1,1).AxisTitle.Text='X Axis'
cht.Axes(3,1).HasTitle=True
cht.Axes(3,1).AxisTitle.Text='Y Axis'
cht.Axes(2,1).HasTitle=True
cht.Axes(2,1).AxisTitle.Text='Z Axis'

cht.Export(root+'/cht.jpg')
cht.Export(root+'/cht.svg')
cht.ExportAsFixedFormat(0,root+'/cht.pdf')

#wb.save()
#app.kill()
How to use Application.DisplayFullScreen in the xlwings API way
The DisplayFullScreen property of the Application object in Excel is a Boolean value that controls whether the Excel application window is displayed in full-screen mode. When set to True, Excel maximizes the window to occupy the entire screen, hiding elements such as the ribbon, formula bar, and status bar to provide a larger workspace for viewing or presenting data. This can be particularly useful for creating distraction-free dashboards, presentations, or when working with large datasets that require maximum screen real estate. Conversely, setting it to False restores the normal window view with all interface elements visible.
In xlwings, this property is accessed through the app object, which represents the Excel application. The syntax for getting or setting the DisplayFullScreen property is straightforward, as it behaves like a standard property in Python.
Syntax:
- Get the current state:
app.api.DisplayFullScreen - Set to full-screen mode:
app.api.DisplayFullScreen = True - Exit full-screen mode:
app.api.DisplayFullScreen = False
Parameters:
- There are no explicit parameters for this property; it is a simple Boolean attribute. The value can be either
True(to enable full-screen) orFalse(to disable it).
Example Usage:
Here are a few practical examples demonstrating how to use the DisplayFullScreen property with xlwings:
- Enabling Full-Screen Mode:
This code snippet launches Excel, opens a workbook, and switches to full-screen mode.
import xlwings as xw
app = xw.App(visible=True)
workbook = app.books.open('example.xlsx')
app.api.DisplayFullScreen = True- Toggling Full-Screen Mode:
This example shows how to check the current state and toggle it based on user input or a condition.
import xlwings as xw
app = xw.App(visible=True)
workbook = app.books.add()
# Check if currently in full-screen
if app.api.DisplayFullScreen:
    print("Currently in full-screen mode. Exiting...")
    app.api.DisplayFullScreen = False
else:
    print("Switching to full-screen mode...")
app.api.DisplayFullScreen = True- Disabling Full-Screen on Workbook Close:
This ensures that full-screen mode is turned off when closing the workbook, restoring the normal Excel interface.
import xlwings as xw
app = xw.App(visible=True)
workbook = app.books.open('data.xlsx')
app.api.DisplayFullScreen = True
# Perform some operations...
workbook.save()
app.api.DisplayFullScreen = False # Exit full-screen before closing
workbook.close()
app.quit()How To Create Ridge Plot Using xlwings? 2
【Example】
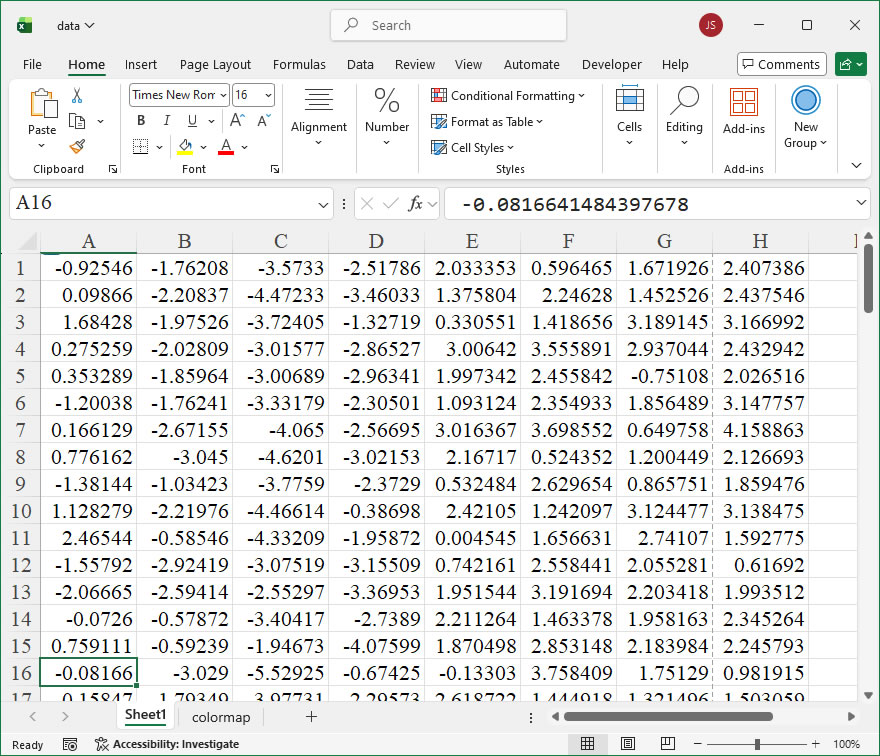
【Code】
import xlwings as xw
import numpy as np
import os

def set_style(cht):
    cht.ChartArea.Format.Line.Visible=False
    cht.PlotArea.Format.Fill.Visible = False
    cht.PlotArea.Format.Line.Visible = True
    cht.PlotArea.Format.Line.ForeColor.RGB=xw.utils.rgb_to_int((200,200,200))
    #cht.PlotArea.Format.Line.ForeColor.ObjectThemeColor = msoThemeColorText1
    ax1 = cht.Axes(1)
    ax2 = cht.Axes(2)
    ax1.HasTitle = True
    ax1.AxisTitle.Text = 'Values'
    ax1.AxisTitle.Font.Size = 10
    ax1.TickLabels.Font.Size = 8
    #ax1.TickLabels.NumberFormat = '0.00'
    ax1.HasMajorGridlines = False
    ax2.HasTitle = True
    ax2.AxisTitle.Text = 'Probability'
    ax2.AxisTitle.Font.Size = 10
    ax2.TickLabels.Font.Size = 8
    ax2.HasMajorGridlines = False
    cht.HasTitle = True
    #cht.ChartTitle.Caption = 'KDE Plot'
    #cht.ChartTitle.Font.Size = 12

def draw_kde(cht,data,y,r,g,b,minx,maxx):
    '''
    rng: 数据单元格区域
    'cht: 图表对象
    'dblX: 横坐标
    '''
    kdex=[0 for _ in range(180)]
    kdef=[0 for _ in range(180)]
    step=(maxx-minx)/180
    for i in range(180):
        kdex[i]=minx+i*step
        kdef[i]=y+kde(data,kdex[i],1.5)

    #画填充多边形
    pt=[[0 for _ in range(2)] for _ in range(183)]
    for i in range(180):
        pt[i][0]=shape_x(cht,kdex[179-i])
        pt[i][1]=shape_y(cht,kdef[179-i])
    pt[180][0]=pt[179][0]
    pt[180][1]=shape_y(cht,y)
    pt[181][0]=pt[0][0]
    pt[181][1]=shape_y(cht,y)
    pt[182][0]=pt[0][0]
    pt[182][1]=pt[0][1]

    shp=cht.Shapes.AddPolyline(pt)
    shp.Fill.ForeColor.RGB=xw.utils.rgb_to_int((r,g,b))
    shp.Fill.OneColorGradient(1,1,1)
    shp.Fill.Transparency=0.1
    shp.Line.ForeColor.RGB=xw.utils.rgb_to_int((r,g,b))
    shp.Line.Weight=1

def kde(data,x,h):
  #一元核密度估计
  my_sum=0
  count=0
  for i in data:
      my_sum+=(1/np.sqrt(2*3.1415926))*\
      np.exp(-0.5*((x-i)/h)*((x-i)/h))
      count+=1
  return my_sum/count/h


root=os.getcwd()
app=xw.App(visible=True,add_book=False)
wb=app.books.open(root+r'/data.xlsx',read_only=False)
sht=wb.sheets('Sheet1')
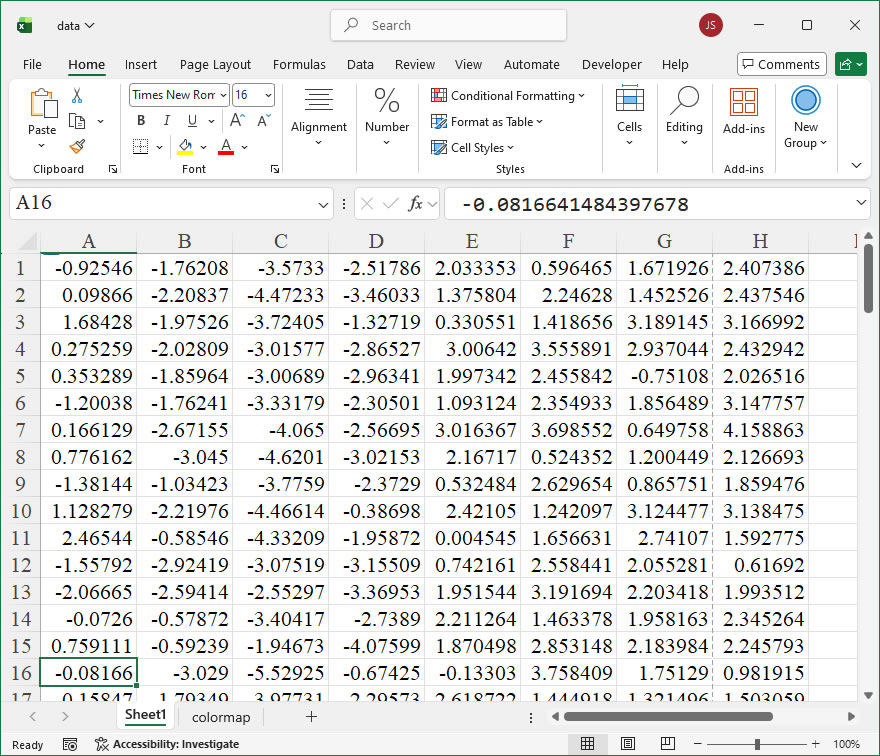
data=sht.range('A1:H100').value
cm=wb.sheets('colormap').range('A1:C256').value
app.kill()

#从comtypes包中导入CreateObject函数
from comtypes.client import CreateObject
app2=CreateObject("Excel.Application")  #创建Excel应用
app2.Visible=True  #应用窗口可见
app2.ScreenUpdating=False
wb2=app2.Workbooks.Open(root+r'/data.xlsx')  #添加工作簿
sht2=wb2.Sheets('Sheet1')  #获取第1个工作表

shp=sht2.Shapes.AddChart2()
shp.Left=20
shp.Left=300
shp.Top=20
shp.Width=350
shp.Height=400
cht=shp.Chart  #添加图表
cht.ChartType=-4169
ax1=cht.Axes(1)
ax2=cht.Axes(2)
ax1.MinimumScale=-10
ax1.MaximumScale=10
ax2.MinimumScale=0
ax2.MaximumScale=1.8
ax1.CrossesAt=ax1.MinimumScale
ax2.CrossesAt=ax2.MinimumScale

set_style(cht)

#cht.SeriesCollection().NewSeries()

dd=np.transpose(data)
dt=[0 for _ in range(8)]
for i in range(8):
    dt[i]=list(dd[i][:])

#绘制核密度估计曲线图
for i in range(7,-1,-1):
    count=int(i/7 * 256)
    if count==256:
        r=cm[255][0]
        g=cm[255][1]
        b=cm[255][2]
    else:
        r=cm[count][0]
        g=cm[count][1]
        b=cm[count][2]
    draw_kde(cht,dt[i],0.2*i,r,g,b,-10,10)

#刻度标签-纵坐标
label_pos=[0 for _ in range(8)]
for i in range(8):
    label_pos[i]=i*0.2
labels=['A','B','C','D','E','F','G','H']
for i in range(8):
    lf=shape_x(cht,-11)
    tp=shape_y(cht,label_pos[i]+0.08)
    wd=cht.PlotArea.InsideWidth/(cht.Axes(1).MaximumScale-cht.Axes(1).MinimumScale)*1.6
    ht=cht.PlotArea.InsideHeight/(cht.Axes(2).MaximumScale-cht.Axes(2).MinimumScale)*0.1
    shp2=cht.Shapes.AddLabel(1,lf,tp,wd,ht)
    shp2.TextFrame2.TextRange.Characters().Text=labels[i]
    shp2.TextFrame2.TextRange.Characters().Font.Size=8
    shp2.TextFrame2.AutoSize=1    #msoAutoSizeTextToFitShape

#刻度标签-横坐标
xlabel_pos=[0 for _ in range(11)]
xlabels=[0 for _ in range(11)]
for i in range(11):
    xlabel_pos[i]=i*2-10
    xlabels[i]=str(i*2-10)
for i in range(11):
    lf=shape_x(cht,xlabel_pos[i]-0.5)
    tp=shape_y(cht,-0.03)
    wd=cht.PlotArea.InsideWidth/(cht.Axes(1).MaximumScale-cht.Axes(1).MinimumScale)*1.8
    ht=cht.PlotArea.InsideHeight/(cht.Axes(2).MaximumScale-cht.Axes(2).MinimumScale)*0.1
    shp3=cht.Shapes.AddLabel(1,lf,tp,wd,ht)
    shp3.TextFrame2.TextRange.Characters().Text=xlabels[i]
    shp3.TextFrame2.TextRange.Characters().Font.Size=8
    shp3.TextFrame2.AutoSize=1    #msoAutoSizeTextToFitShape

#外框
lf=shape_x(cht,-10)
tp=shape_y(cht,1.8)
wd=cht.PlotArea.InsideWidth/(cht.Axes(1).MaximumScale-cht.Axes(1).MinimumScale)*20
ht=cht.PlotArea.InsideHeight/(cht.Axes(2).MaximumScale-cht.Axes(2).MinimumScale)*1.8
shp4=cht.Shapes.AddShape(1,lf,tp,wd,ht)
shp4.Fill.Visible=False
shp4.Line.Weight=1
shp4.Line.ForeColor.RGB=xw.utils.rgb_to_int((200,200,200))

app2.ScreenUpdating=True

cht.Export(root+'/cht.jpg')
cht.Export(root+'/cht.svg')
cht.ExportAsFixedFormat(0,root+'/cht.pdf')

#wb2.Save()
#os.system('taskkill /f /im EXCEL.EXE')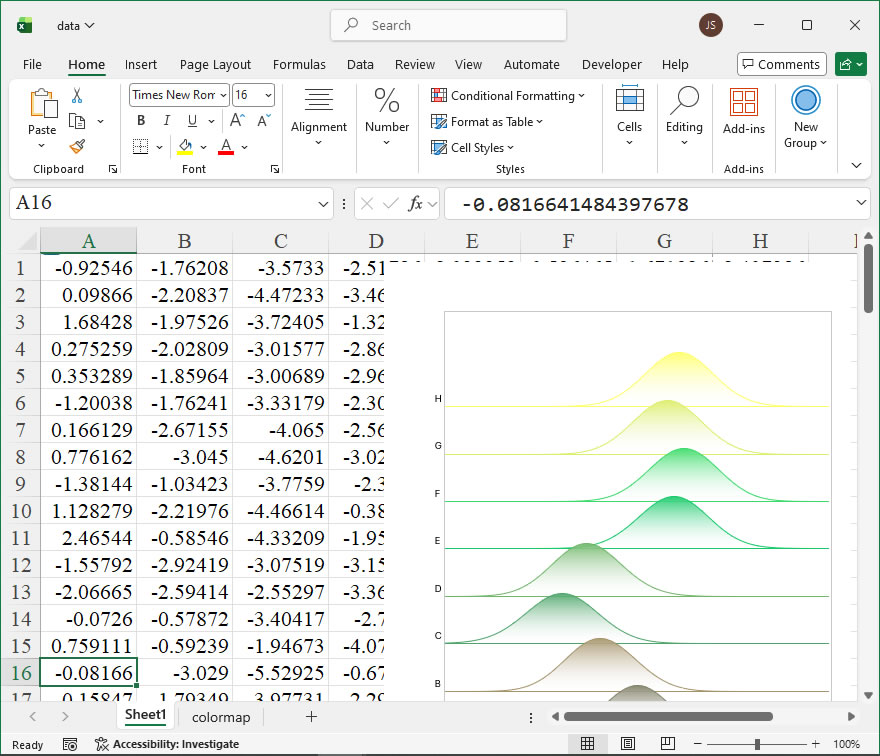
How to use Application.DisplayFormulaBar in the xlwings API way
The DisplayFormulaBar member of the Application object in Excel is a property that controls the visibility of the formula bar in the Excel application window. This feature is particularly useful when automating tasks where screen real estate needs to be managed or when creating a cleaner interface for end-users by hiding the formula bar to reduce clutter. In xlwings, this property can be accessed and modified through the api property, which provides direct access to the underlying Excel object model, allowing for precise control over the Excel application’s behavior.
Functionality
The primary function of the DisplayFormulaBar property is to toggle the display of the formula bar on or off. When set to True, the formula bar is visible; when set to False, it is hidden. This can enhance the user experience in automated reports or dashboards by minimizing distractions, or it can be used to prevent users from manually editing formulas in protected sheets, although it is not a security feature. It’s important to note that this setting applies to the entire Excel application instance, affecting all open workbooks.
Syntax
In xlwings, the syntax to access and set the DisplayFormulaBar property is straightforward, utilizing the api attribute to call the native Excel VBA object model. The property is a boolean.
- Get the current state:
formula_bar_visible = xw.apps[0].api.DisplayFormulaBarThis returns True if the formula bar is displayed, False otherwise.
- Set the state:
xw.apps[0].api.DisplayFormulaBar = False # Hides the formula baror
xw.apps[0].api.DisplayFormulaBar = True # Shows the formula barHere, xw.apps[0] refers to the first Excel application instance controlled by xlwings. If multiple instances are open, you may need to adjust the index or use xw.apps.active to target the active application.
Parameters
The DisplayFormulaBar property does not accept method parameters as it is a property, not a method. It is a read/write boolean property. The value must be a Python boolean (True or False) or an integer that evaluates to a boolean (0 for False, non-zero for True).
Code Examples
Here are practical examples of using the DisplayFormulaBar property with xlwings:
- Hiding the formula bar upon opening a workbook:
import xlwings as xw

# Start Excel and open a workbook
app = xw.App(visible=True)
workbook = app.books.open('example.xlsx')

# Hide the formula bar
app.api.DisplayFormulaBar = False

# Perform other operations...
workbook.save()
app.quit()- Toggling the formula bar visibility based on a condition:
import xlwings as xw

# Connect to the active Excel instance
app = xw.apps.active

# Check current state and toggle
if app.api.DisplayFormulaBar:
    print("Formula bar is visible. Hiding it.")
    app.api.DisplayFormulaBar = False
else:
    print("Formula bar is hidden. Showing it.")
app.api.DisplayFormulaBar = True- Ensuring the formula bar is visible before closing:
import xlwings as xw

# Assume an existing automation script
app = xw.apps[0]

# ... automation tasks ...

# Restore formula bar visibility for the user
app.api.DisplayFormulaBar = True

# Save and close
app.books[0].save()
app.quit()How To Create Ridge Plot Using xlwings?
【Example】
【Code】
import xlwings as xw
import numpy as np
import os

def set_style(cht):
    cht.ChartArea.Format.Line.Visible=False
    cht.PlotArea.Format.Fill.Visible = False
    cht.PlotArea.Format.Line.Visible = True
    cht.PlotArea.Format.Line.ForeColor.RGB=xw.utils.rgb_to_int((200,200,200))
    #cht.PlotArea.Format.Line.ForeColor.ObjectThemeColor = msoThemeColorText1
    ax1 = cht.Axes(1)
    ax2 = cht.Axes(2)
    ax1.HasTitle = True
    ax1.AxisTitle.Text = 'Values'
    ax1.AxisTitle.Font.Size = 10
    ax1.TickLabels.Font.Size = 8
    #ax1.TickLabels.NumberFormat = '0.00'
    ax1.HasMajorGridlines = False
    ax2.HasTitle = True
    ax2.AxisTitle.Text = 'Probability'
    ax2.AxisTitle.Font.Size = 10
    ax2.TickLabels.Font.Size = 8
    ax2.HasMajorGridlines = False
    cht.HasTitle = True
    #cht.ChartTitle.Caption = 'KDE Plot'
    #cht.ChartTitle.Font.Size = 12

def draw_kde(cht,data,y,r,g,b,minx,maxx):
    '''
    rng: 数据单元格区域
    'cht: 图表对象
    'dblX: 横坐标
    '''
    kdex=[0 for _ in range(180)]
    kdef=[0 for _ in range(180)]
    step=(maxx-minx)/180
    for i in range(180):
        kdex[i]=minx+i*step
        kdef[i]=y+kde(data,kdex[i],1.5)

    #画填充多边形
    pt=[[0 for _ in range(2)] for _ in range(183)]
    for i in range(180):
        pt[i][0]=shape_x(cht,kdex[179-i])
        pt[i][1]=shape_y(cht,kdef[179-i])
    pt[180][0]=pt[179][0]
    pt[180][1]=shape_y(cht,y)
    pt[181][0]=pt[0][0]
    pt[181][1]=shape_y(cht,y)
    pt[182][0]=pt[0][0]
    pt[182][1]=pt[0][1]

    shp=cht.Shapes.AddPolyline(pt)
    shp.Fill.ForeColor.RGB=xw.utils.rgb_to_int((r,g,b))
    shp.Fill.Transparency=0.1
    shp.Line.ForeColor.RGB=xw.utils.rgb_to_int((r,g,b))
    shp.Line.Weight=1

def kde(data,x,h):
  #一元核密度估计
  my_sum=0
  count=0
  for i in data:
      my_sum+=(1/np.sqrt(2*3.1415926))*\
      np.exp(-0.5*((x-i)/h)*((x-i)/h))
      count+=1
  return my_sum/count/h

root=os.getcwd()
app=xw.App(visible=True,add_book=False)
wb=app.books.open(root+r'/data.xlsx',read_only=False)
sht=wb.sheets('Sheet1')
data=sht.range('A1:H100').value
cm=wb.sheets('colormap').range('A1:C256').value
app.kill()

#从comtypes包中导入CreateObject函数
from comtypes.client import CreateObject
app2=CreateObject("Excel.Application")  #创建Excel应用
app2.Visible=True  #应用窗口可见
app2.ScreenUpdating=False
wb2=app2.Workbooks.Open(root+r'/data.xlsx')  #添加工作簿
sht2=wb2.Sheets('Sheet1')  #获取第1个工作表

shp=sht2.Shapes.AddChart2()
shp.Left=20
shp.Left=300
shp.Top=20
shp.Width=350
shp.Height=400
cht=shp.Chart  #添加图表
cht.ChartType=-4169
ax1=cht.Axes(1)
ax2=cht.Axes(2)
ax1.MinimumScale=-10
ax1.MaximumScale=10
ax2.MinimumScale=0
ax2.MaximumScale=1.8
ax1.CrossesAt=ax1.MinimumScale
ax2.CrossesAt=ax2.MinimumScale

set_style(cht)

#cht.SeriesCollection().NewSeries()

dd=np.transpose(data)
dt=[0 for _ in range(8)]
for i in range(8):
    dt[i]=list(dd[i][:])

#绘制核密度估计曲线图
for i in range(7,-1,-1):
    count=int(i/7 * 256)
    if count==256:
        r=cm[255][0]
        g=cm[255][1]
        b=cm[255][2]
    else:
        r=cm[count][0]
        g=cm[count][1]
        b=cm[count][2]
    draw_kde(cht,dt[i],0.2*i,r,g,b,-10,10)

#刻度标签-纵坐标
label_pos=[0 for _ in range(8)]
for i in range(8):
    label_pos[i]=i*0.2
labels=['A','B','C','D','E','F','G','H']
for i in range(8):
    lf=shape_x(cht,-11)
    tp=shape_y(cht,label_pos[i]+0.08)
    wd=cht.PlotArea.InsideWidth/(cht.Axes(1).MaximumScale-cht.Axes(1).MinimumScale)*1.6
    ht=cht.PlotArea.InsideHeight/(cht.Axes(2).MaximumScale-cht.Axes(2).MinimumScale)*0.1
    shp2=cht.Shapes.AddLabel(1,lf,tp,wd,ht)
    shp2.TextFrame2.TextRange.Characters().Text=labels[i]
    shp2.TextFrame2.TextRange.Characters().Font.Size=8
    shp2.TextFrame2.AutoSize=1    #msoAutoSizeTextToFitShape

#刻度标签-横坐标
xlabel_pos=[0 for _ in range(11)]
xlabels=[0 for _ in range(11)]
for i in range(11):
    xlabel_pos[i]=i*2-10
    xlabels[i]=str(i*2-10)
for i in range(11):
    lf=shape_x(cht,xlabel_pos[i]-0.5)
    tp=shape_y(cht,-0.03)
    wd=cht.PlotArea.InsideWidth/(cht.Axes(1).MaximumScale-cht.Axes(1).MinimumScale)*1.8
    ht=cht.PlotArea.InsideHeight/(cht.Axes(2).MaximumScale-cht.Axes(2).MinimumScale)*0.1
    shp3=cht.Shapes.AddLabel(1,lf,tp,wd,ht)
    shp3.TextFrame2.TextRange.Characters().Text=xlabels[i]
    shp3.TextFrame2.TextRange.Characters().Font.Size=8
    shp3.TextFrame2.AutoSize=1    #msoAutoSizeTextToFitShape

#外框
lf=shape_x(cht,-10)
tp=shape_y(cht,1.8)
wd=cht.PlotArea.InsideWidth/(cht.Axes(1).MaximumScale-cht.Axes(1).MinimumScale)*20
ht=cht.PlotArea.InsideHeight/(cht.Axes(2).MaximumScale-cht.Axes(2).MinimumScale)*1.8
shp4=cht.Shapes.AddShape(1,lf,tp,wd,ht)
shp4.Fill.Visible=False
shp4.Line.Weight=1
shp4.Line.ForeColor.RGB=xw.utils.rgb_to_int((200,200,200))

app2.ScreenUpdating=True

cht.Export(root+'/cht.jpg')
cht.Export(root+'/cht.svg')
cht.ExportAsFixedFormat(0,root+'/cht.pdf')

#wb2.Save()
#os.system('taskkill /f /im EXCEL.EXE')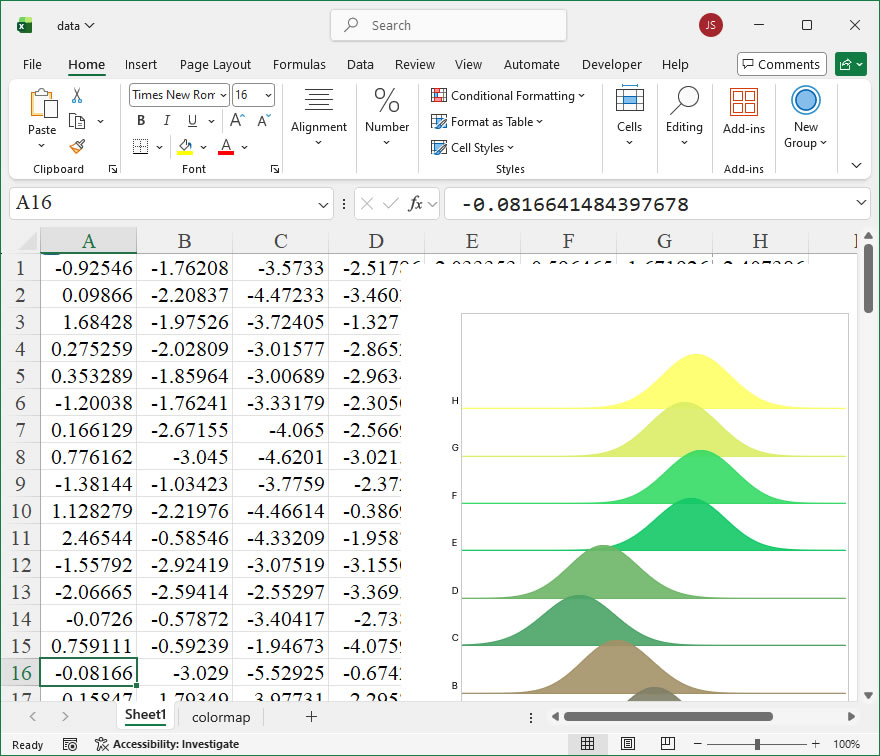
How to use Application.DisplayFormulaAutoComplete in the xlwings API way
The Application.DisplayFormulaAutoComplete property in Excel VBA is a Boolean setting that controls whether Excel shows formula AutoComplete suggestions as you type in a formula within a cell. When enabled, Excel displays a dropdown list of matching function names, defined names, and table references, aiding in formula accuracy and speeding up data entry. This feature is particularly useful when building complex formulas, as it helps avoid typographical errors in function names and provides quick access to named ranges. In xlwings, this VBA property is exposed through the api object, allowing Python scripts to get or set this application-level option programmatically, enabling automation scenarios where the user experience or formula entry behavior needs to be standardized.
Syntax in xlwings:
The property is accessed via the Application object from the xlwings api. Since it is a property, it can be both read and assigned.
- To get the current setting:
current_setting = xw.apps[0].api.DisplayFormulaAutoCompleteThis returns True if AutoComplete for formulas is turned on, or False if it is off.
- To set the property:
xw.apps[0].api.DisplayFormulaAutoComplete = True # or FalseThe property does not accept parameters; it is a simple Boolean flag. It applies to the entire Excel application instance, affecting all open workbooks. In xlwings, xw.apps[0] refers to the first Excel application instance. If multiple instances are open, you may need to adjust the index or use xw.apps.active to target the correct one.
Code Examples:
- Checking the Current Status:
This example retrieves the current DisplayFormulaAutoComplete setting and prints it, which is useful for logging or conditional logic in automation scripts.
import xlwings as xw
# Ensure Excel is running and connected
app = xw.apps.active
auto_complete_status = app.api.DisplayFormulaAutoComplete
print(f"Formula AutoComplete is currently: {'ON' if auto_complete_status else 'OFF'}")- Enabling Formula AutoComplete:
Before performing tasks that involve heavy formula entry, you might want to ensure AutoComplete is enabled for user convenience. This script turns it on if it is off.
import xlwings as xw
app = xw.apps.active
if not app.api.DisplayFormulaAutoComplete:
    app.api.DisplayFormulaAutoComplete = True
    print("Formula AutoComplete has been enabled.")
else:
print("Formula AutoComplete was already enabled.")- Temporarily Disabling for Performance:
In scenarios where a macro or script is entering many formulas programmatically and you want to minimize screen refreshes or potential distractions, disabling AutoComplete can be beneficial. Remember to restore the original setting afterward.
import xlwings as xw
app = xw.apps.active
# Store original setting
original_setting = app.api.DisplayFormulaAutoComplete
# Disable for the operation
app.api.DisplayFormulaAutoComplete = False
# ... Perform your formula insertion tasks here ...
# Restore the original setting
app.api.DisplayFormulaAutoComplete = original_setting
print(f"Restored AutoComplete to: {original_setting}")