【Example】
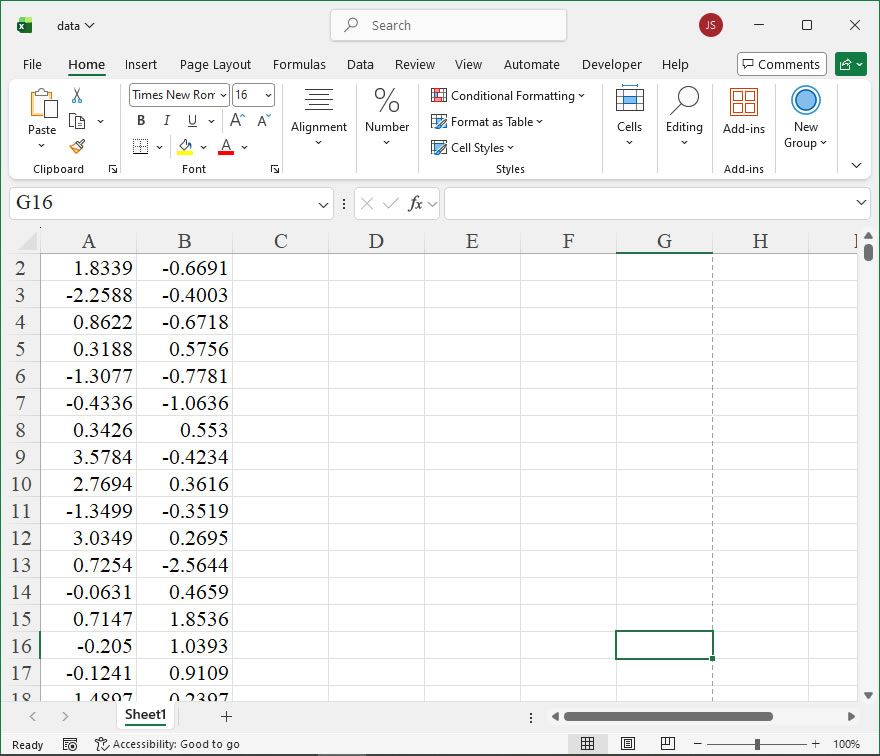
【Code】
import xlwings as xw
import numpy as np
import os

def kde2(dt1,dt2,x,y,w):
    #二元核密度估计
    my_sum=0
    count=0
    for i in dt1:
        for j in dt2:
            #Gaussian核函数(2D)
            my_sum+=np.exp(-((x-i)**2+(y-j)**2)/(2*w**2))/\
            (2*3.1416*w**2)
            count+=1
    return my_sum/count


root=os.getcwd()
app=xw.App(visible=True,add_book=False)
wb=app.books.open(root+r'/data.xlsx',read_only=False)
sht=wb.sheets('Sheet1')
dt1=sht.range('A1:A200').value
dt2=sht.range('B1:B200').value

#用Shapes创建图表
kdex=[0 for _ in range(40)]
kdey=[0 for _ in range(40)]
kdef=[[0 for _ in range(40)] for _ in range(40)]
for i in range(40):
    kdex[i]=(i- 20)/2
    kdey[i]=(i- 20)/2
for i in range(40):
    for j in range(40):
        kdef[i][j]=kde2(dt1,dt2,kdex[i],kdey[j],1.5)

sht2=wb.sheets.add()
sht2.name='plot'
for i in range(40):
    sht2.api.Cells(1, i+2).Value=kdex[i]
    sht2.api.Cells(i+2, 1).Value=kdey[i]
    for j in range(40):
        sht2.api.Cells(i+2,j+2).Value=kdef[i][j]

#创建曲面图表
shp=sht2.api.Shapes.AddChart2()
shp.Left=20
shp.Top=50
shp.Width=500
shp.Height=400
cht=shp.Chart
#设置图表数据范围
cht.SetSourceData(sht2.api.Range(sht2.api.Cells(2, 2),sht2.api.Cells(41, 41)))
#设置图表类型为三维曲面图
cht.ChartType=xw.constants.ChartType.xlSurface
#设置图表标题
cht.HasTitle=True
cht.ChartTitle.Text='Surface'
#设置轴标题
cht.Axes(1,1).HasTitle=True
cht.Axes(1,1).AxisTitle.Text='X Axis'
cht.Axes(3,1).HasTitle=True
cht.Axes(3,1).AxisTitle.Text='Y Axis'
cht.Axes(2,1).HasTitle=True
cht.Axes(2,1).AxisTitle.Text='Z Axis'

cht.Export(root+'/cht.jpg')
cht.Export(root+'/cht.svg')
cht.ExportAsFixedFormat(0,root+'/cht.pdf')

#wb.save()
#app.kill()
Leave a Reply