Flowing these steps to create 2d picture filled column chart:

First, select data in the worksheet.
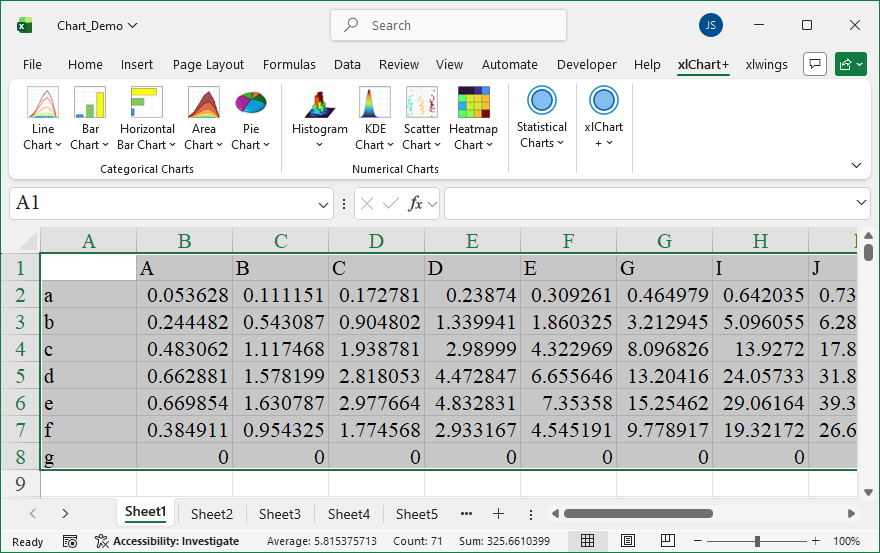
Click “2D Clustered” item in “Bar Chart” menu in xlChart+ add-in, open “Create a Bar Chart” dialog box, select “Pictured Fill” option button in “Fill” frame.
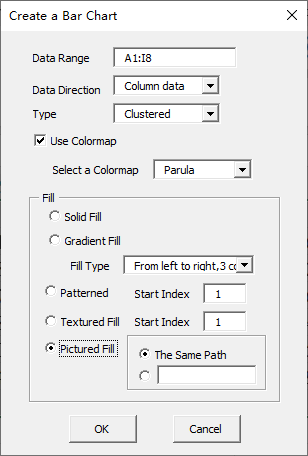
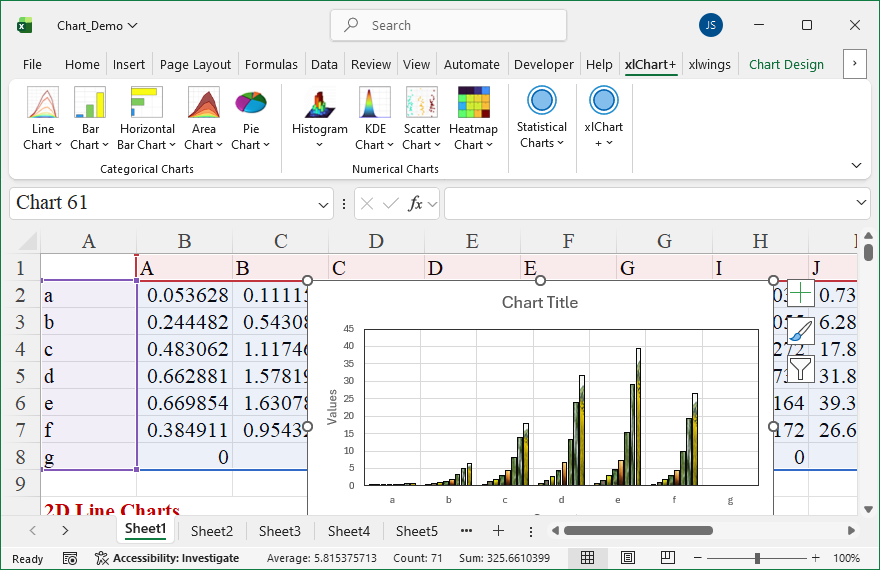
Click “OK” button.
Leave a Reply