How To Create a Colorbar Using xlwings?
【Method】

【Example】
import xlwings as xw
import os
def set_style(cht):
cht.ChartArea.Format.Line.Visible=False
cht.PlotArea.Format.Fill.Visible=False
cht.PlotArea.Format.Line.Visible=True
cht.PlotArea.Format.Line.ForeColor.RGB=xw.utils.rgb_to_int((200,200,200))
#cht.PlotArea.Format.Line.ForeColor.ObjectThemeColor = msoThemeColorText1
ax1=cht.Axes(1)
ax2=cht.Axes(2)
ax1.HasTitle=True
ax1.AxisTitle.Text='Categories'
ax1.AxisTitle.Font.Size=10
ax1.TickLabels.Font.Size=8
#ax1.TickLabels.NumberFormat='0.00'
ax1.HasMajorGridlines=False
ax2.HasTitle=True
ax2.AxisTitle.Text='Values'
ax2.AxisTitle.Font.Size=10
ax2.TickLabels.Font.Size=8
ax2.HasMajorGridlines=False
cht.HasTitle=True
#cht.ChartTitle.Caption='Plot'
#cht.ChartTitle.Font.Size=12
root=os.getcwd()
app=xw.App(visible=True,add_book=False)
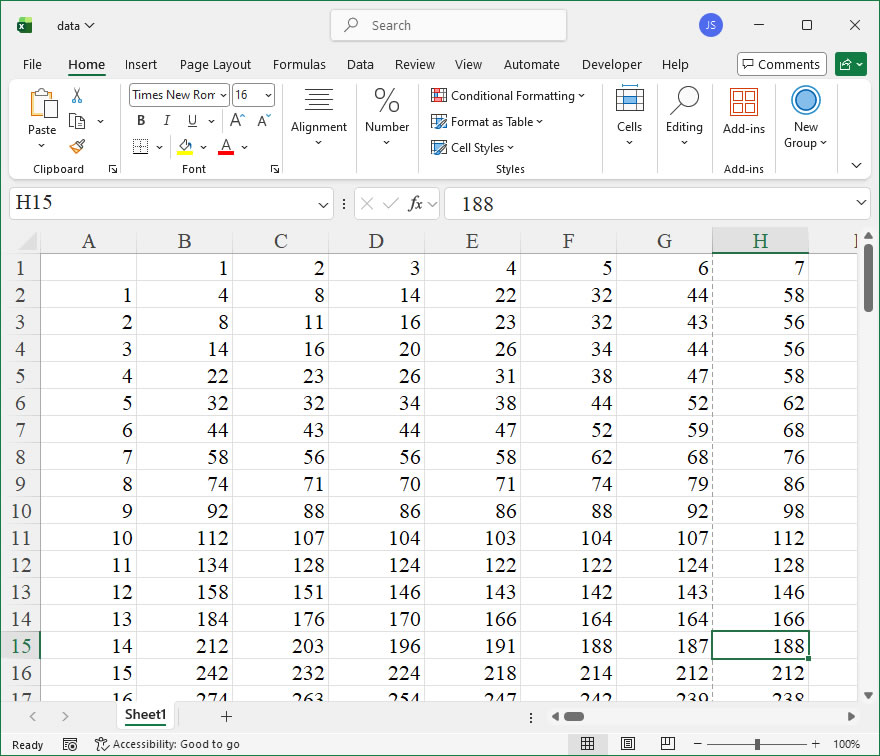
wb=app.books.open(root+r'/data.xlsx',read_only=False)
sht=wb.sheets('Sheet1')
shp=sht.api.Shapes.AddChart2()
shp.Left=20
cht=shp.Chart
cht.ChartType=xw.constants.ChartType.xlXYScatter
ax1=cht.Axes(1)
ax2=cht.Axes(2)
ax1.MinimumScale=0
ax1.MaximumScale=300
ax2.MinimumScale=0
ax2.MaximumScale=300
set_style(cht)
cht.SeriesCollection().NewSeries()
x=shape_x(cht,50)
y=shape_y(cht,250)
w=cht.PlotArea.InsideWidth/(ax1.MaximumScale-ax1.MinimumScale)*10
h=cht.PlotArea.InsideHeight/(ax2.MaximumScale-ax2.MinimumScale)*200
shp2=cht.Shapes.AddShape(1,x,y,w,h)
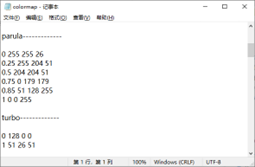
shp2.Fill.ForeColor.RGB=xw.utils.rgb_to_int((255,255,26))
shp2.Fill.OneColorGradient(1,1,1)
shp2.Fill.GradientStops.Insert(xw.utils.rgb_to_int((255,204,51)),0.25)
shp2.Fill.GradientStops.Delete(2)
shp2.Fill.GradientStops.Insert(xw.utils.rgb_to_int((204,204,51)),0.5)
shp2.Fill.GradientStops.Insert(xw.utils.rgb_to_int((0,179,179)),0.75)
shp2.Fill.GradientStops.Insert(xw.utils.rgb_to_int((51,128,255)),0.85)
shp2.Fill.GradientStops.Insert(xw.utils.rgb_to_int((255,204,51)),1)
shp2.Line.Weight=1
cm_labels=['0','0.5','1']
cm_label_pos=[50,150,250]
for i in range(3):
lf=shape_x(cht,57)
tp=shape_y(cht,cm_label_pos[i]+20)
wd=cht.PlotArea.InsideWidth/(cht.Axes(1).MaximumScale-cht.Axes(1).MinimumScale)*40
ht=cht.PlotArea.InsideHeight/(cht.Axes(2).MaximumScale-cht.Axes(2).MinimumScale)*30
shp6=cht.Shapes.AddLabel(1,lf,tp,wd,ht)
shp6.TextFrame2.TextRange.Characters.Text=cm_labels[i]
shp6.TextFrame2.TextRange.Characters.Font.Size=8
shp6.TextFrame2.AutoSize=1 #msoAutoSizeTextToFitShape
x=shape_x(cht,110)
y=shape_y(cht,250)
w=cht.PlotArea.InsideWidth/(ax1.MaximumScale-ax1.MinimumScale)*10
h=cht.PlotArea.InsideHeight/(ax2.MaximumScale-ax2.MinimumScale)*200
shp3=cht.Shapes.AddShape(1,x,y,w,h)
shp3.Fill.ForeColor.RGB=xw.utils.rgb_to_int((255,0,255))
shp3.Fill.OneColorGradient(1,1,1)
shp3.Fill.GradientStops.Insert(xw.utils.rgb_to_int((0,255,255)),1)
shp3.Fill.GradientStops.Delete(2)
shp3.Line.Weight=1
for i in range(3):
lf=shape_x(cht,117)
tp=shape_y(cht,cm_label_pos[i]+20)
wd=cht.PlotArea.InsideWidth/(cht.Axes(1).MaximumScale-cht.Axes(1).MinimumScale)*40
ht=cht.PlotArea.InsideHeight/(cht.Axes(2).MaximumScale-cht.Axes(2).MinimumScale)*30
shp6=cht.Shapes.AddLabel(1,lf,tp,wd,ht)
shp6.TextFrame2.TextRange.Characters.Text=cm_labels[i]
shp6.TextFrame2.TextRange.Characters.Font.Size=8
shp6.TextFrame2.AutoSize=1 #msoAutoSizeTextToFitShape
x=shape_x(cht,170)
y=shape_y(cht,250)
w=cht.PlotArea.InsideWidth/(ax1.MaximumScale-ax1.MinimumScale)*10
h=cht.PlotArea.InsideHeight/(ax2.MaximumScale-ax2.MinimumScale)*200
shp4=cht.Shapes.AddShape(1,x,y,w,h)
shp4.Fill.ForeColor.RGB=xw.utils.rgb_to_int((255,255,102))
shp4.Fill.OneColorGradient(1,1,1)
shp4.Fill.GradientStops.Insert(xw.utils.rgb_to_int((0,128,102)),1)
shp4.Fill.GradientStops.Delete(2)
shp4.Line.Weight=1
for i in range(3):
lf=shape_x(cht,177)
tp=shape_y(cht,cm_label_pos[i]+20)
wd=cht.PlotArea.InsideWidth/(cht.Axes(1).MaximumScale-cht.Axes(1).MinimumScale)*40
ht=cht.PlotArea.InsideHeight/(cht.Axes(2).MaximumScale-cht.Axes(2).MinimumScale)*30
shp6=cht.Shapes.AddLabel(1,lf,tp,wd,ht)
shp6.TextFrame2.TextRange.Characters.Text=cm_labels[i]
shp6.TextFrame2.TextRange.Characters.Font.Size=8
shp6.TextFrame2.AutoSize=1 #msoAutoSizeTextToFitShape
x=shape_x(cht,230)
y=shape_y(cht,250)
w=cht.PlotArea.InsideWidth/(ax1.MaximumScale-ax1.MinimumScale)*10
h=cht.PlotArea.InsideHeight/(ax2.MaximumScale-ax2.MinimumScale)*200
shp5=cht.Shapes.AddShape(1,x,y,w,h)
shp5.Fill.ForeColor.RGB=xw.utils.rgb_to_int((128,0,0))
shp5.Fill.OneColorGradient(1,1,1)
shp5.Fill.GradientStops.Insert(xw.utils.rgb_to_int((255,0,0)),0.1)
shp5.Fill.GradientStops.Delete(2)
shp5.Fill.GradientStops.Insert(xw.utils.rgb_to_int((255,255,0)),0.39)
shp5.Fill.GradientStops.Insert(xw.utils.rgb_to_int((0,255,255)),0.65)
shp5.Fill.GradientStops.Insert(xw.utils.rgb_to_int((0,0,255)),0.89)
shp5.Fill.GradientStops.Insert(xw.utils.rgb_to_int((0,0,128)),1)
shp5.Line.Weight=1
for i in range(3):
lf=shape_x(cht,237)
tp=shape_y(cht,cm_label_pos[i]+20)
wd=cht.PlotArea.InsideWidth/(cht.Axes(1).MaximumScale-cht.Axes(1).MinimumScale)*40
ht=cht.PlotArea.InsideHeight/(cht.Axes(2).MaximumScale-cht.Axes(2).MinimumScale)*30
shp6=cht.Shapes.AddLabel(1,lf,tp,wd,ht)
shp6.TextFrame2.TextRange.Characters.Text=cm_labels[i]
shp6.TextFrame2.TextRange.Characters.Font.Size=8
shp6.TextFrame2.AutoSize=1 #msoAutoSizeTextToFitShape
#wb.save()
#app.kill()