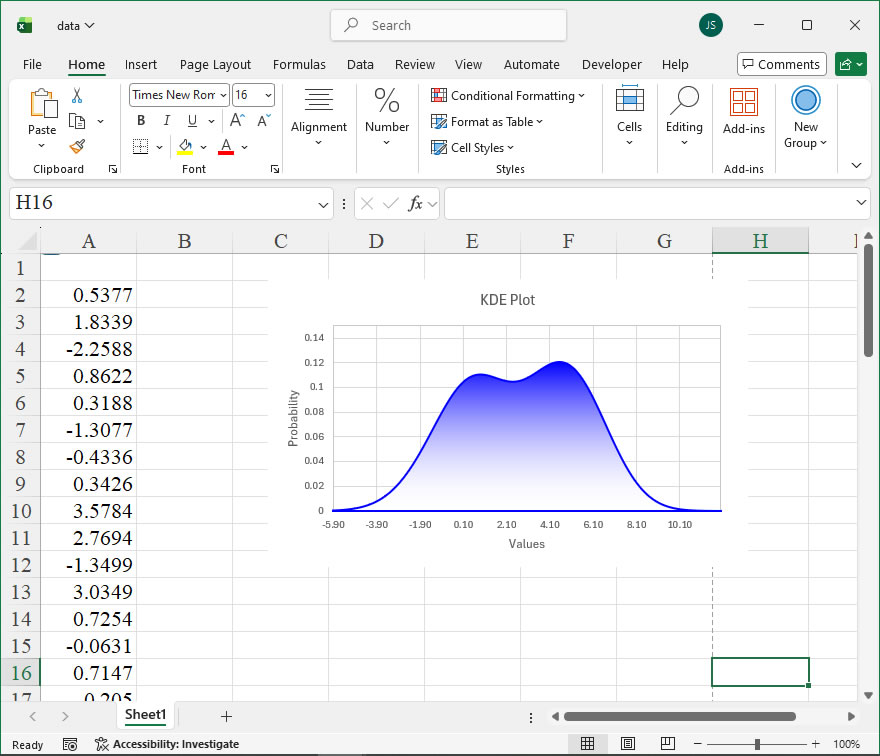
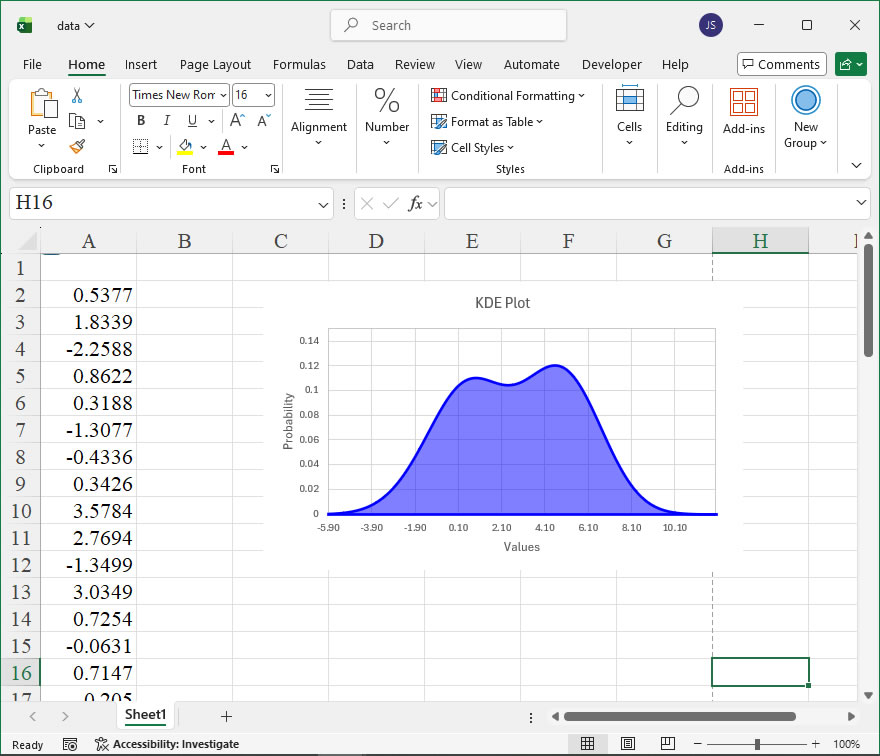
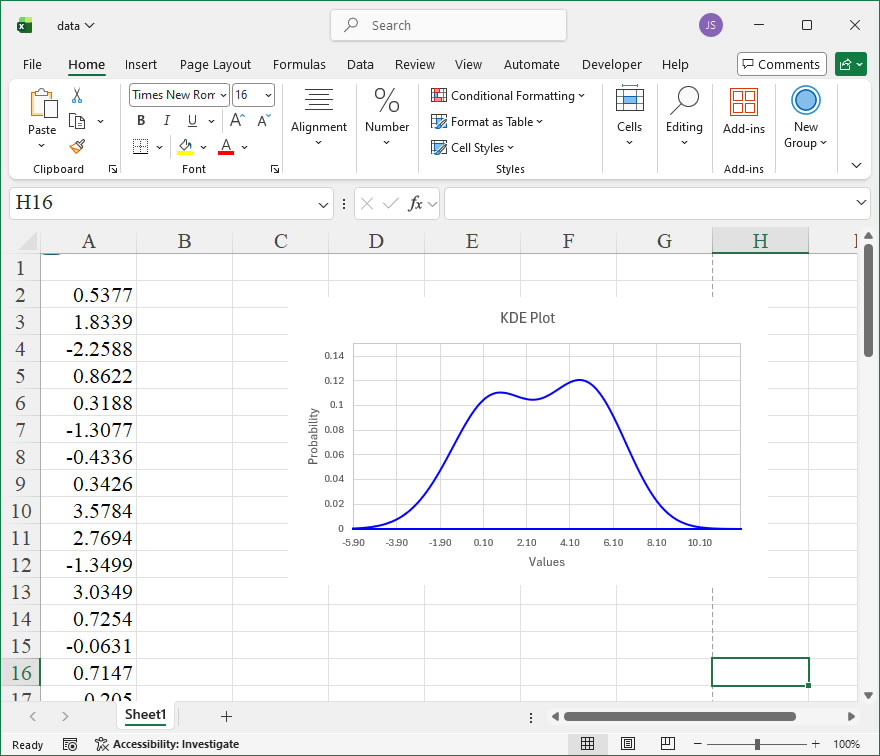
How To Create Kernel Density Estimation Curve with Color Fill Using xlwings? 2
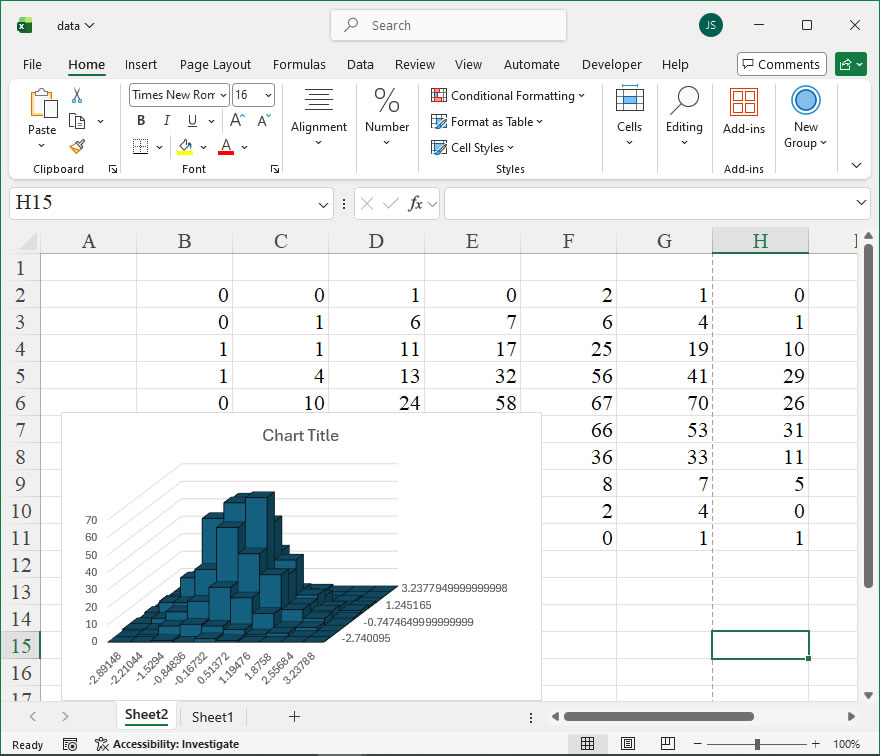
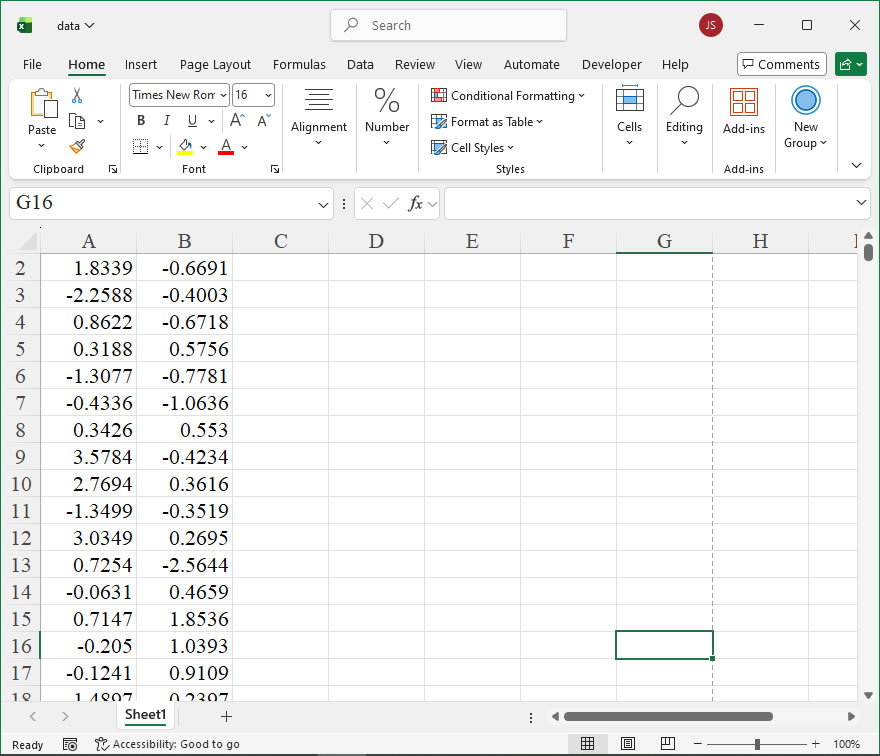
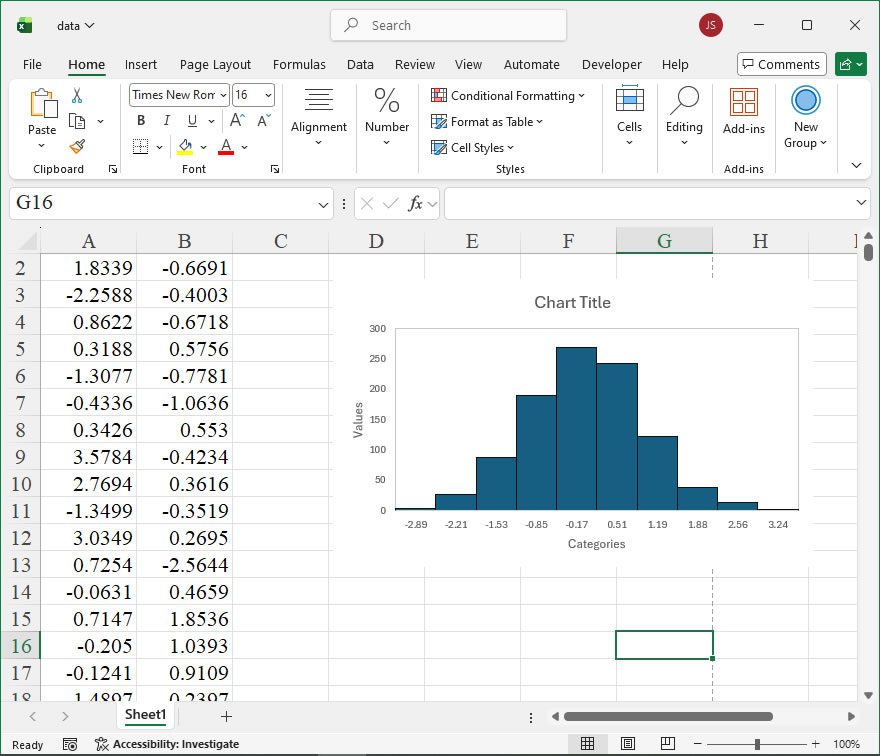
【Example】

【Code】
import xlwings as xw
import numpy as np
import os
def set_style(cht):
cht.ChartArea.Format.Line.Visible=False
cht.PlotArea.Format.Fill.Visible = False
cht.PlotArea.Format.Line.Visible = True
cht.PlotArea.Format.Line.ForeColor.RGB=xw.utils.rgb_to_int((200,200,200))
#cht.PlotArea.Format.Line.ForeColor.ObjectThemeColor = msoThemeColorText1
ax1 = cht.Axes(1)
ax2 = cht.Axes(2)
ax1.HasTitle = True
ax1.AxisTitle.Text = 'Values'
ax1.AxisTitle.Font.Size = 10
ax1.TickLabels.Font.Size = 8
ax1.TickLabels.NumberFormat = '0.00'
ax1.HasMajorGridlines = True
ax2.HasTitle = True
ax2.AxisTitle.Text = 'Probability'
ax2.AxisTitle.Font.Size = 10
ax2.TickLabels.Font.Size = 8
ax2.HasMajorGridlines = True
cht.HasTitle = True
cht.ChartTitle.Caption = 'KDE Plot'
cht.ChartTitle.Font.Size = 12
def kde(data,x,h):
#一元核密度估计
my_sum=0
count=0
for i in data:
my_sum+=(1/np.sqrt(2*3.1415926))*\
np.exp(-0.5*((x-i)/h)*((x-i)/h))
count+=1
return my_sum/count/h
root=os.getcwd()
app=xw.App(visible=True,add_book=False)
wb=app.books.open(root+r'/data.xlsx',read_only=False)
sht=wb.sheets('Sheet1')
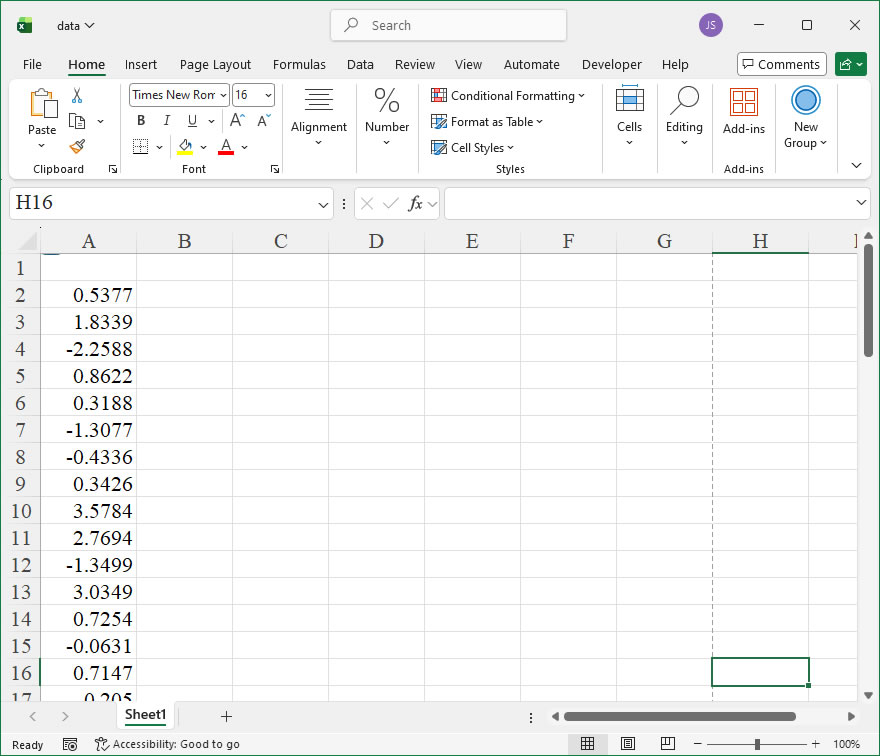
data=sht.range('A2:A61').value
app.kill()
#从comtypes包中导入CreateObject函数
from comtypes.client import CreateObject
app2=CreateObject("Excel.Application") #创建Excel应用
app2.Visible=True #应用窗口可见
app2.ScreenUpdating=False
wb2=app2.Workbooks.Open(root+r'/data.xlsx') #添加工作簿
sht2=wb2.Sheets('Sheet1') #获取第1个工作表
shp=sht2.Shapes.AddChart2()
shp.Left=20
cht=shp.Chart #添加图表
cht.ChartType=-4169
ax1=cht.Axes(1)
ax2=cht.Axes(2)
ax1.MinimumScale=-5.9
ax1.MaximumScale=12
ax2.MinimumScale=0
ax2.MaximumScale=0.15
ax1.CrossesAt=ax1.MinimumScale
ax2.CrossesAt=ax2.MinimumScale
set_style(cht)
kdex=[0 for _ in range(180)]
kdef=[0 for _ in range(180)]
for i in range(180):
kdex[i]=(i-59)/10
kdef[i]=kde(data,(i-59)/10,1.5)
cht.SeriesCollection().NewSeries()
#画填充多边形
pt=[[0 for _ in range(2)] for _ in range(183)]
for i in range(180):
pt[i][0]=shape_x(cht,kdex[179-i])
pt[i][1]=shape_y(cht,kdef[179-i])
pt[180][0]=pt[179][0]
pt[180][1]=shape_y(cht,0)
pt[181][0]=pt[0][0]
pt[181][1]=shape_y(cht,0)
pt[182][0]=pt[0][0]
pt[182][1]=pt[0][1]
shp2=cht.Shapes.AddPolyline(pt)
shp2.Fill.Transparency=0.5
shp2.Fill.ForeColor.RGB=xw.utils.rgb_to_int((0,0,255))
shp2.Fill.OneColorGradient(1,1,1)
shp2.Line.ForeColor.RGB=xw.utils.rgb_to_int((0,0,255))
shp2.Line.Weight=1.5
app2.ScreenUpdating=True
cht.Export(root+'/cht.jpg')
cht.Export(root+'/cht.svg')
cht.ExportAsFixedFormat(0,root+'/cht.pdf')
#wb2.Save()
#os.system('taskkill /f /im EXCEL.EXE')