Blog
How To Set Legend Using xlwings? 2
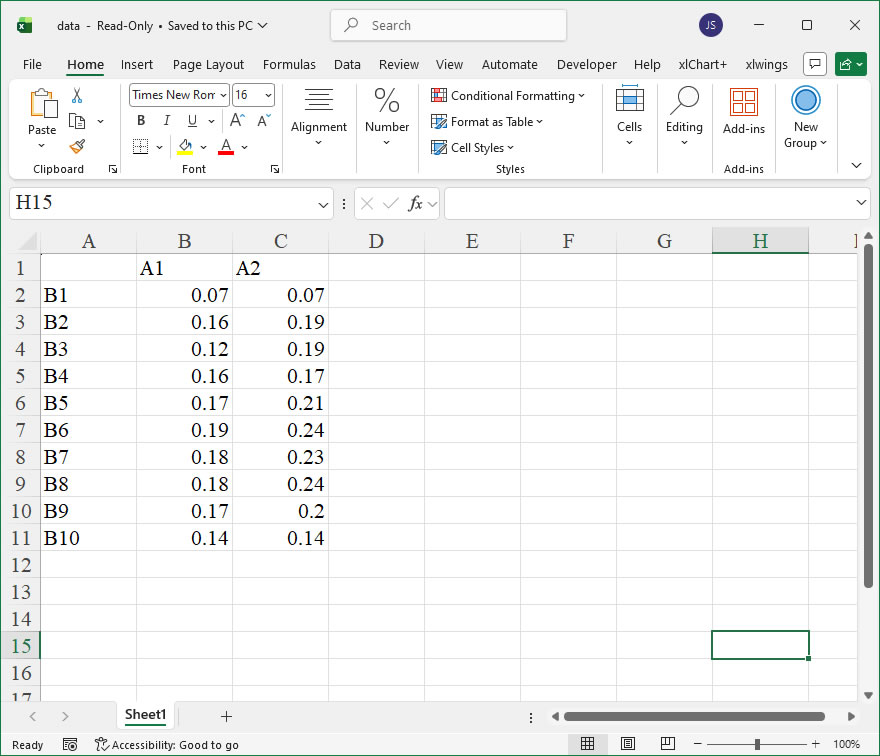
【Example】
【Code】
import xlwings as xw
import os

def set_style(cht):
    cht.ChartArea.Format.Line.Visible=False
    cht.PlotArea.Format.Fill.Visible=False
    cht.PlotArea.Format.Line.Visible=True
    cht.PlotArea.Format.Line.ForeColor.RGB=xw.utils.rgb_to_int((200,200,200))
    #cht.PlotArea.Format.Line.ForeColor.ObjectThemeColor=msoThemeColorText1
    ax1=cht.Axes(1)
    ax2=cht.Axes(2)
    ax1.HasTitle=True
    ax1.AxisTitle.Text='Categories'
    ax1.AxisTitle.Font.Size=10
    ax1.TickLabels.Font.Size=8
    #ax1.TickLabels.NumberFormat='0.00'
    ax1.HasMajorGridlines=False
    ax2.HasTitle=True
    ax2.AxisTitle.Text='Values'
    ax2.AxisTitle.Font.Size=10
    ax2.TickLabels.Font.Size=8
    ax2.HasMajorGridlines=False
    cht.HasTitle=True
    #cht.ChartTitle.Caption='Plot'
    #cht.ChartTitle.Font.Size=12

root=os.getcwd()
app=xw.App(visible=True,add_book=False)
wb=app.books.open(root+r'/data.xlsx',read_only=False)
sht=wb.sheets('Sheet1')

sht.api.Range('A1:B7').Select()    #
cht=sht.api.Shapes.AddChart2(-1, \
          xw.constants.ChartType.xlColumnClustered,20,20,350,250,True).Chart
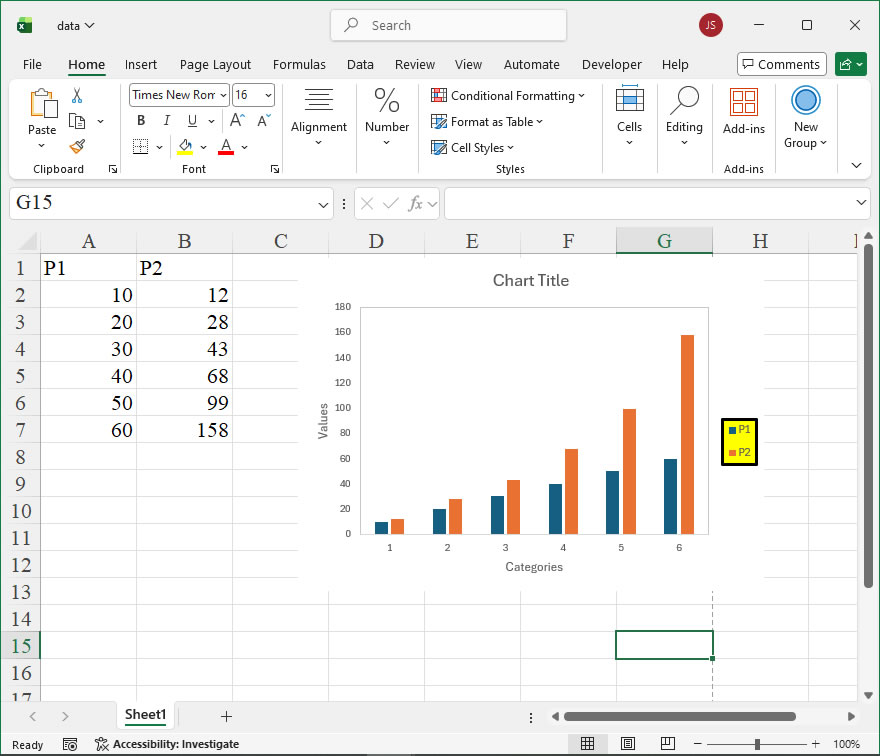
cht.HasLegend=True
leg=cht.Legend
leg.Position=xw.constants.LegendPosition.xlLegendPositionRight
leg.Format.Fill.ForeColor.RGB=xw.utils.rgb_to_int((255,255,0))
leg.Format.Line.ForeColor.RGB=xw.utils.rgb_to_int((0,0,0))
leg.Format.Line.Weight=2

set_style(cht)

cht.Export(root+'/cht.jpg')
cht.Export(root+'/cht.svg')
cht.ExportAsFixedFormat(0,root+'/cht.pdf')

#wb.save()
#app.kill()
How to use Application.GetOpenFilename in the xlwings API way
The Application.GetOpenFilename method in Excel’s object model allows users to display the standard “Open” dialog box, enabling file selection without actually opening any files. This is particularly useful for scenarios where you need to retrieve a file path for further processing, such as importing data, logging, or batch operations. In xlwings, this functionality is accessed through the api property of the App object, providing a direct bridge to Excel’s VBA methods.
Syntax in xlwings:
file_path = xw.apps.active.api.GetOpenFilename(FileFilter, FilterIndex, Title, ButtonText, MultiSelect)- FileFilter: A string specifying the file filtering criteria. For example,
"Excel Files (*.xlsx), *.xlsx"restricts selection to .xlsx files. Multiple filters can be separated by commas. - FilterIndex: An integer indicating the default filter index to use (e.g., 1 for the first filter). If omitted, the first filter is used.
- Title: A string for the dialog box’s title bar. If omitted, the default title “Open” is displayed.
- ButtonText: Reserved for Macintosh; typically ignored on Windows.
- MultiSelect: If set to
True, allows multiple file selections, returning an array of file paths; default isFalse.
Example Usage:
Here is a practical example that prompts the user to select one or more Excel files and prints their paths. This script uses xlwings to interact with an active Excel instance.
import xlwings as xw

# Connect to the active Excel application
app = xw.apps.active

# Set up file filter for Excel files
file_filter = "Excel Files (*.xlsx), *.xlsx, All Files (*.*), *.*"

# Display the Open dialog with a custom title
selected_files = app.api.GetOpenFilename(FileFilter=file_filter,
FilterIndex=1,
Title="Select Excel Files for Processing",
MultiSelect=True)

# Process the result
if selected_files:
    if isinstance(selected_files, str): # Single file selected
        print(f"Selected file: {selected_files}")
    else: # Multiple files selected (returns a tuple)
        for file in selected_files:
            print(f"Selected file: {file}")
else:
    print("No file was selected.")
Key Points:
- When
MultiSelect=True, the method returns a tuple of strings if multiple files are chosen; otherwise, it returns a single string. - If the user cancels the dialog, the method returns
False. - This method does not open the file; it only retrieves the path(s), giving full control over subsequent actions like reading with pandas or xlwings.
How To Set Legend Using xlwings?
【Method】
The legend is represented by the `Legend` object. You can use the `HasLegend` property of the `Chart` object to show or hide the legend, and the `Legend` property to return the `Legend` object. Using the properties and methods of the `Legend` object, you can modify the appearance, font, and position of the legend.
The `Format` property of the `Legend` object returns a `ChartFormat` object, which can be used to set the background and border of the legend. The `Font` property returns a `Font` object to set the font. The `Position` property determines the position of the legend. The values for the `Position` property are shown in the table below.
|
Name |
Value |
Description |
|
xlLegendPositionBottom |
-4107 |
Display legend at the bottom |
|
xlLegendPositionCorner |
2 |
Display legend at the top-right corner of the chart |
|
xlLegendPositionCustom |
-4161 |
Display legend at a custom position |
|
xlLegendPositionLeft |
-4131 |
Display legend on the left side |
|
xlLegendPositionRight |
-4152 |
Display legend on the right side |
|
xlLegendPositionTop |
-4160 |
Display legend at the top |
sht.api.Range(‘A1:B7’).Select()
sht.api.Range(‘A1:B7’).Select() #Data
cht=sht.api.Shapes.AddChart().Chart #Add chart
cht.Legend.Font.Italic=True #Legend font italicized
cht.Legend.Format.Fill.ForeColor.RGB=xw.utils.rgb_to_int((255,255,0))
cht.Legend.Format.Line.ForeColor.RGB=xw.utils.rgb_to_int((0,0,255))
cht.Legend.Position=-4107 #Legend positioned below the chart
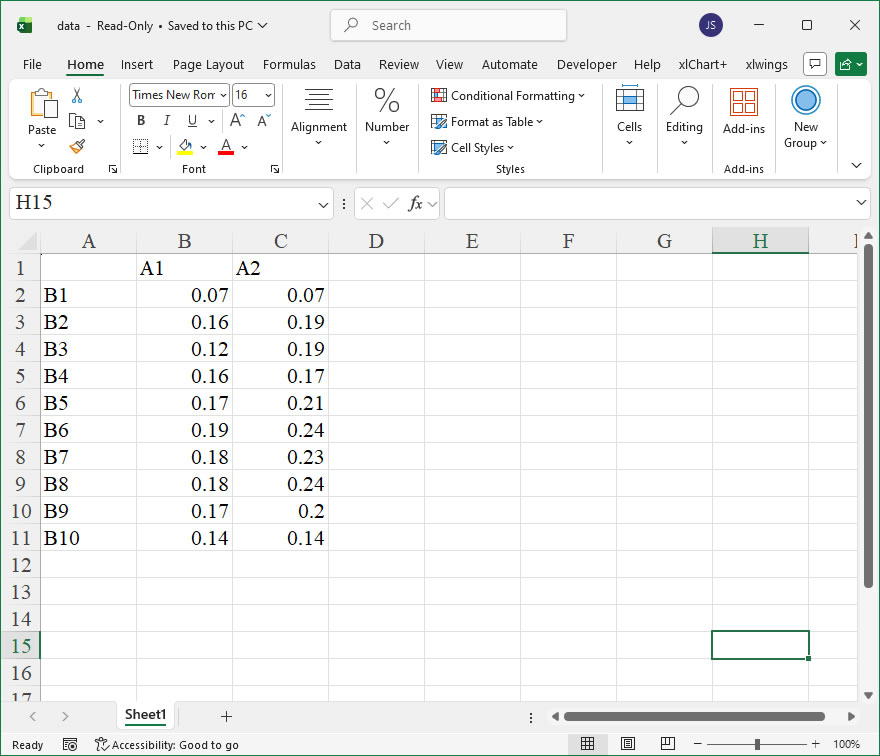
【Example】
【Code】
import xlwings as xw
import os

def set_style(cht):
    cht.ChartArea.Format.Line.Visible=False
    cht.PlotArea.Format.Fill.Visible=False
    cht.PlotArea.Format.Line.Visible=True
    cht.PlotArea.Format.Line.ForeColor.RGB=xw.utils.rgb_to_int((200,200,200))
    #cht.PlotArea.Format.Line.ForeColor.ObjectThemeColor = msoThemeColorText1
    ax1=cht.Axes(1)
    ax2=cht.Axes(2)
    ax1.HasTitle=True
    ax1.AxisTitle.Text='Categories'
    ax1.AxisTitle.Font.Size=10
    ax1.TickLabels.Font.Size=8
    #ax1.TickLabels.NumberFormat='0.00'
    ax1.HasMajorGridlines=False
    ax2.HasTitle=True
    ax2.AxisTitle.Text='Values'
    ax2.AxisTitle.Font.Size=10
    ax2.TickLabels.Font.Size=8
    ax2.HasMajorGridlines=False
    cht.HasTitle=True
    #cht.ChartTitle.Caption='Plot'
    #cht.ChartTitle.Font.Size=12

root=os.getcwd()
app=xw.App(visible=True, add_book=False)
wb=app.books.open(root+r'/data.xlsx',read_only=False)
sht=wb.sheets('Sheet1')

sht.api.Range('A1:B7').Select()    #
cht=sht.api.Shapes.AddChart2(-1, \
          xw.constants.ChartType.xlColumnClustered,20,20,350,250,True).Chart
cht.HasLegend=True
leg=cht.Legend
leg.Position=xw.constants.LegendPosition.xlLegendPositionBottom
leg.Format.Fill.ForeColor.RGB=xw.utils.rgb_to_int((255,255,0))

set_style(cht)

cht.Export(root+'/cht.jpg')
cht.Export(root+'/cht.svg')
cht.ExportAsFixedFormat(0,root+'/cht.pdf')

#wb.save()
#app.kill()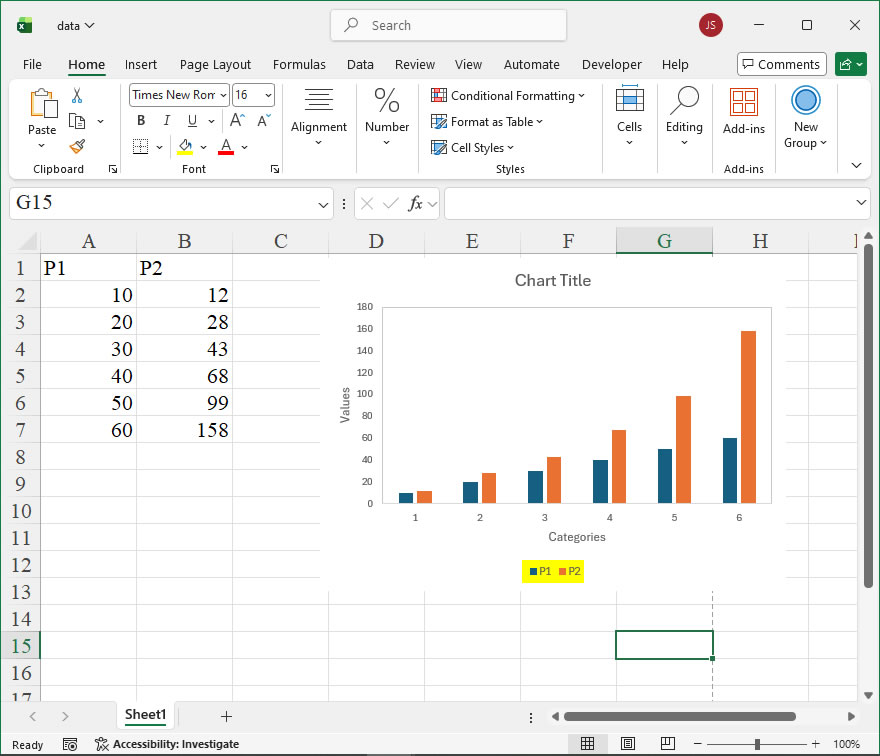
How to use Application.GetCustomListNum in the xlwings API way
The GetCustomListNum member of the Application object in Excel is a method used to retrieve the index number of a custom list that has been defined in the Excel application. Custom lists are often utilized for sorting data in a user-defined order, such as days of the week or months, and they can also be used in functions like MATCH or VLOOKUP to align data with these custom sequences. In xlwings, this functionality is accessible through the api property, which provides direct access to the underlying Excel object model. This method is particularly useful when you need to programmatically determine the position of a specific list within Excel’s custom list collection, enabling dynamic interactions with list-based operations.
FunctionalityGetCustomListNum returns a numeric value representing the index of a custom list based on a provided list array. If the specified list matches one of the custom lists defined in Excel, the method returns its index number (starting from 1 for the first custom list). If no match is found, it returns 0. This can assist in validating or identifying custom lists before performing operations like sorting or data alignment.
Syntax
In xlwings, the method is called via the Application object. The syntax is:
index = xw.apps[0].api.GetCustomListNum(list_array)list_array: This is a required parameter that specifies the list to be checked. It should be passed as an array or range of values. In xlwings, you can use a Python list or an Excel range object. For example, a Python list like["Mon", "Tue", "Wed"]or an xlwings range likesheet.range("A1:A3").value.
Parameters and Values
The list_array parameter must be a one-dimensional array of strings or numbers that correspond to the custom list entries in Excel. Excel stores custom lists in a specific order, and the method compares the input array to these stored lists. Note that custom lists are case-insensitive in Excel, so the matching process ignores letter case. If the input array is empty or invalid, the method may return an error or 0.
Code Examples
Here are some xlwings API code instances demonstrating the use of GetCustomListNum:
- Basic Example with a Python List: Check if a custom list for weekdays exists and get its index.
import xlwings as xw

# Connect to the active Excel instance
app = xw.apps.active

# Define a list to check (e.g., weekdays)
list_to_check = ["Monday", "Tuesday", "Wednesday", "Thursday", "Friday"]

# Get the custom list index
list_index = app.api.GetCustomListNum(list_to_check)
print(f"The custom list index is: {list_index}")
# Output might be 1 if this is the first custom list, or 0 if not found.- Using an Excel Range as Input: Retrieve data from a worksheet and check if it matches a custom list.
import xlwings as xw

# Open a workbook and reference a sheet
wb = xw.Book("example.xlsx")
sheet = wb.sheets["Sheet1"]

# Get values from a range (e.g., cells A1:A5)
range_values = sheet.range("A1:A5").value

# Ensure it's a flat list (xlwings returns a list of lists for 2D ranges)
if isinstance(range_values[0], list):
    range_values = [item for sublist in range_values for item in sublist]

# Check for custom list match
app = xw.apps.active
list_index = app.api.GetCustomListNum(range_values)
if list_index > 0:
    print(f"Custom list found at index: {list_index}")
else:
print("No matching custom list found.")- Dynamic List Validation: Before sorting data, verify that a custom list exists to avoid errors.
import xlwings as xw

app = xw.apps.active
custom_list = ["Low", "Medium", "High"] # Example priority list

index = app.api.GetCustomListNum(custom_list)
if index == 0:
print("Warning: Custom list not defined. Consider adding it in Excel options.")
else:
# Proceed with sorting or other operations using the list index
print(f"Using custom list index {index} for sorting.")How To Set Chart Area Using xlwings?
【Method】
The chart area is the rectangular area that contains the entire chart, while the plot area is the rectangular area defined by the two axes. In Excel, the chart area is represented by the `ChartArea` object, and the plot area is represented by the `PlotArea` object. You can access these areas using the `ChartArea` and `PlotArea` properties of the `Chart` object.
By continuously referencing the `ChartArea` and `PlotArea` objects’ `Format.Fill` property, you can set the fill properties of both areas, such as their color, transparency, gradient fills, pattern fills, picture fills, texture fills, etc.
Using the `Format.Shadow` property of the `ChartArea` and `PlotArea` objects, you can set additional shadow properties for these areas. The `Format.Shadow` property returns a `ShadowFormat` object with the following main properties:
– **Visible**: Determines whether the shadow is visible.
– **Blur**: Gets or sets the blur radius of the shadow.
– **Transparency**: Gets or sets the transparency of the shadow (from 0.0 for opaque to 1.0 for fully transparent).
– **OffsetX**: Gets or sets the horizontal offset of the shadow in points. Positive values shift the shadow to the right, while negative values shift it to the left.
– **OffsetY**: Gets or sets the vertical offset of the shadow in points. Positive values shift the shadow downward, while negative values shift it upward.
sht.api.Range(‘A1:B7’).Select()
cht=sht.api.Shapes.AddChart().Chart
cha=cht.ChartArea #Chart Area
cha.Format.Fill.ForeColor.RGB=xw.utils.rgb_to_int((155,255,0))
cha.Shadow=True #Plot area shows shadow
pla=cht.PlotArea #Plot area
pla.Format.Fill.UserPicture(root+r’/picpy2.jpg’) #Picture fill
cht.SeriesCollection(1).Format.Fill.ForeColor.RGB=xw.utils.rgb_to_int((255,255,0))
cht.Axes(2).HasMajorGridlines=False
cha.Shadow=False
pla.Format.Shadow.Visible=True #Plot area shows shadow
pla.Format.Shadow.OffsetX=3 #Horizontal offset of the shadow
pla.Format.Shadow.OffsetY=3 #Vertical offset of the shadow
【Example】

【Code】
import xlwings as xw
import os

def set_style(cht):
    cht.ChartArea.Format.Line.Visible=False
    cht.PlotArea.Format.Fill.Visible=True
    cht.PlotArea.Format.Line.Visible=True
    cht.PlotArea.Format.Line.ForeColor.RGB=xw.utils.rgb_to_int((200,200,200))
    #cht.PlotArea.Format.Line.ForeColor.ObjectThemeColor = msoThemeColorText1
    ax1=cht.Axes(1)
    ax2=cht.Axes(2)
    ax1.HasTitle=True
    ax1.AxisTitle.Text='Categories'
    ax1.AxisTitle.Font.Size=10
    ax1.AxisTitle.Font.Color = xw.utils.rgb_to_int((255,255,255))
    ax1.TickLabels.Font.Size=8
    ax1.TickLabels.Font.Color = xw.utils.rgb_to_int((255,255,255))
    #ax1.TickLabels.NumberFormat='0.00'
    ax1.HasMajorGridlines=False
    ax2.HasTitle=True
    ax2.AxisTitle.Text='Values'
    ax2.AxisTitle.Font.Size=10
    ax2.AxisTitle.Font.Color = xw.utils.rgb_to_int((255,255,255))
    ax2.TickLabels.Font.Size=8
    ax2.TickLabels.Font.Color = xw.utils.rgb_to_int((255,255,255))
    ax2.HasMajorGridlines=False
    cht.HasTitle=True
    #cht.ChartTitle.Caption='Plot'
    #cht.ChartTitle.Font.Size=12

root=os.getcwd()
app=xw.App(visible=True,add_book=False)
wb=app.books.open(root+r'/data.xlsx',read_only=False)
sht=wb.sheets('Sheet1')

sht.api.Range('A1:B7').Select()    #
cht=sht.api.Shapes.AddChart2(-1, \
          xw.constants.ChartType.xlColumnClustered,20,20,350,250,True).Chart
cht.ChartArea.Format.Fill.UserPicture('d:/pic.jpg')
cht.SeriesCollection(1).Format.Fill.ForeColor.RGB=xw.utils.rgb_to_int((255,255,0))

set_style(cht)
cht.Legend.Format.TextFrame2.TextRange.Font.Fill.ForeColor.RGB=xw.utils.rgb_to_int((255,255,255))

cht.Export(root+'/cht.jpg')
cht.Export(root+'/cht.svg')
cht.ExportAsFixedFormat(0,root+'/cht.pdf')

#wb.save()
#app.kill()
How to use Application.GetCustomListContents in the xlwings API way
The GetCustomListContents member of the Application object in Excel is a method that retrieves the contents of a custom list. Custom lists are used for custom sorting or filling series, such as a list of department names, weekdays, or months in a specific language order. In xlwings, this method allows Python scripts to access these lists programmatically, enabling dynamic data processing and automation based on user-defined sequences. This is particularly useful for applications that require consistent sorting or pattern generation across different Excel workbooks or when integrating Excel data with other systems.
Syntax:
In xlwings, the GetCustomListContents method is accessed through the app object, which represents the Excel application. The syntax is as follows:
contents = app.api.GetCustomListContents(ListNum)- ListNum: An integer parameter that specifies the index number of the custom list. In Excel, custom lists are indexed starting from 1. For example, built-in lists like days of the week or months may have specific indices, but user-defined lists are assigned indices based on their creation order. To determine the index of a custom list, you can check Excel’s options under “Advanced” > “General” > “Edit Custom Lists,” where lists are displayed in order, or use VBA to loop through lists programmatically. The method returns a string containing the list items, separated by commas.
Example:
Suppose you have a custom list in Excel containing the sequence “North, South, East, West” for sorting regional data. You can retrieve this list using xlwings to use it in a Python script for data analysis. Here’s a code example:
import xlwings as xw

# Connect to the active Excel application
app = xw.apps.active

# Assume the custom list is the first user-defined list (index might be 5 or higher, depending on built-in lists)
# In practice, you might need to determine the index dynamically
list_num = 5 # Example index; adjust based on your Excel setup
list_contents = app.api.GetCustomListContents(list_num)

# Output the retrieved list
print("Custom list contents:", list_contents)

# Split the string into a list for further processing
items = list_contents.split(',')
print("List items:", items)

# Use the list for sorting a pandas DataFrame, for instance
import pandas as pd
data = {'Region': ['South', 'East', 'North', 'West']}
df = pd.DataFrame(data)
# Create a categorical type based on the custom list for sorting
df['Region'] = pd.Categorical(df['Region'], categories=items, ordered=True)
df_sorted = df.sort_values('Region')
print("Sorted DataFrame:")
print(df_sorted)How To Set Plot Area Using xlwings? 2
【Method】
The chart area is the rectangular area that contains the entire chart, while the plot area is the rectangular area defined by the two axes. In Excel, the chart area is represented by the `ChartArea` object, and the plot area is represented by the `PlotArea` object. You can access these areas using the `ChartArea` and `PlotArea` properties of the `Chart` object.
By continuously referencing the `ChartArea` and `PlotArea` objects’ `Format.Fill` property, you can set the fill properties of both areas, such as their color, transparency, gradient fills, pattern fills, picture fills, texture fills, etc.
Using the `Format.Shadow` property of the `ChartArea` and `PlotArea` objects, you can set additional shadow properties for these areas. The `Format.Shadow` property returns a `ShadowFormat` object with the following main properties:
– **Visible**: Determines whether the shadow is visible.
– **Blur**: Gets or sets the blur radius of the shadow.
– **Transparency**: Gets or sets the transparency of the shadow (from 0.0 for opaque to 1.0 for fully transparent).
– **OffsetX**: Gets or sets the horizontal offset of the shadow in points. Positive values shift the shadow to the right, while negative values shift it to the left.
– **OffsetY**: Gets or sets the vertical offset of the shadow in points. Positive values shift the shadow downward, while negative values shift it upward.
sht.api.Range(‘A1:B7’).Select()
cht=sht.api.Shapes.AddChart().Chart
cha=cht.ChartArea #Chart Area
cha.Format.Fill.ForeColor.RGB=xw.utils.rgb_to_int((155,255,0))
cha.Shadow=True #Plot area shows shadow
pla=cht.PlotArea #Plot area
pla.Format.Fill.UserPicture(root+r’/picpy2.jpg’) #Picture fill
cht.SeriesCollection(1).Format.Fill.ForeColor.RGB=xw.utils.rgb_to_int((255,255,0))
cht.Axes(2).HasMajorGridlines=False
cha.Shadow=False
pla.Format.Shadow.Visible=True #Plot area shows shadow
pla.Format.Shadow.OffsetX=3 #Horizontal offset of the shadow
pla.Format.Shadow.OffsetY=3 #Vertical offset of the shadow
【Example】

【Code】
import xlwings as xw
import os

def set_style(cht):
    cht.ChartArea.Format.Line.Visible=False
    cht.PlotArea.Format.Fill.Visible=True
    cht.PlotArea.Format.Line.Visible=True
    cht.PlotArea.Format.Line.ForeColor.RGB=xw.utils.rgb_to_int((200,200,200))
    #cht.PlotArea.Format.Line.ForeColor.ObjectThemeColor = msoThemeColorText1
    ax1=cht.Axes(1)
    ax2=cht.Axes(2)
    ax1.HasTitle=True
    ax1.AxisTitle.Text='Categories'
    ax1.AxisTitle.Font.Size=10
    ax1.TickLabels.Font.Size=8
    #ax1.TickLabels.NumberFormat='0.00'
    ax1.HasMajorGridlines=False
    ax2.HasTitle=True
    ax2.AxisTitle.Text='Values'
    ax2.AxisTitle.Font.Size=10
    ax2.TickLabels.Font.Size=8
    ax2.HasMajorGridlines=False
    cht.HasTitle=True
    #cht.ChartTitle.Caption='Plot'
    #cht.ChartTitle.Font.Size=12

root=os.getcwd()
app=xw.App(visible=True,add_book=False)
wb=app.books.open(root+r'/data.xlsx',read_only=False)
sht=wb.sheets('Sheet1')

sht.api.Range('A1:B7').Select()    #
cht=sht.api.Shapes.AddChart2(-1, \
          xw.constants.ChartType.xlColumnClustered,20,20,350,250,True).Chart
cht.SeriesCollection(1).Format.Fill.ForeColor.RGB=xw.utils.rgb_to_int((255,255,0))
cht.PlotArea.Format.Fill.UserPicture('d:/picpy2.jpg')

set_style(cht)

cht.Export(root+'/cht.jpg')
cht.Export(root+'/cht.svg')
cht.ExportAsFixedFormat(0,root+'/cht.pdf')

#wb.save()
#app.kill()
How to use Application.FindFile in the xlwings API way
The FindFile method of the Application object in Excel is a powerful tool for programmatically opening the “Open” dialog box, allowing users to search for and select a file to open within the Excel application interface. This method mimics the action of clicking “File” > “Open” in the Excel ribbon, providing a user-interactive way to locate files without hardcoding file paths in your scripts. In xlwings, which provides a clean Pythonic interface to automate Excel, you can access this Excel method through the api property of the main App or Book objects, giving you direct access to the underlying Excel object model.
Functionality:
The primary function of FindFile is to display the standard Open dialog box. It returns a Boolean value: True if a file is successfully opened, and False if the dialog is canceled by the user. This method is particularly useful in scenarios where the script needs to prompt the user to select a file dynamically, such as in data import routines or when working with files that may change location.
Syntax in xlwings:
In xlwings, you call this method via the api property of an Application object. The typical syntax is:
result = xw.apps[0].api.FindFile()Or, if you have a specific app instance:
app = xw.App()
result = app.api.FindFile()
The method does not take any parameters. The return value result is a Boolean indicating success (True) or cancellation (False).
Parameters:FindFile has no parameters in Excel VBA, and this is directly mirrored in xlwings. The method relies entirely on user interaction within the displayed dialog.
Example Usage:
Here is a practical example using xlwings to open the Open dialog and handle the user’s selection:
import xlwings as xw

# Start or connect to Excel
app = xw.App(visible=True) # Ensure Excel is visible to see the dialog

# Display the Open dialog
file_opened = app.api.FindFile()

# Check the result
if file_opened:
    print("A file was successfully opened by the user.")
    # You can now interact with the opened workbook, e.g., get its name
active_book = app.books.active
    print(f"Opened workbook: {active_book.name}")
else:
    print("The Open dialog was canceled by the user.")

# Keep the app open or close as needed
# app.quit()How To Set Plot Area Using xlwings?
【Method】
The chart area is the rectangular area that contains the entire chart, while the plot area is the rectangular area defined by the two axes. In Excel, the chart area is represented by the `ChartArea` object, and the plot area is represented by the `PlotArea` object. You can access these areas using the `ChartArea` and `PlotArea` properties of the `Chart` object.
By continuously referencing the `ChartArea` and `PlotArea` objects’ `Format.Fill` property, you can set the fill properties of both areas, such as their color, transparency, gradient fills, pattern fills, picture fills, texture fills, etc.
Using the `Format.Shadow` property of the `ChartArea` and `PlotArea` objects, you can set additional shadow properties for these areas. The `Format.Shadow` property returns a `ShadowFormat` object with the following main properties:
– **Visible**: Determines whether the shadow is visible.
– **Blur**: Gets or sets the blur radius of the shadow.
– **Transparency**: Gets or sets the transparency of the shadow (from 0.0 for opaque to 1.0 for fully transparent).
– **OffsetX**: Gets or sets the horizontal offset of the shadow in points. Positive values shift the shadow to the right, while negative values shift it to the left.
– **OffsetY**: Gets or sets the vertical offset of the shadow in points. Positive values shift the shadow downward, while negative values shift it upward.
sht.api.Range(‘A1:B7’).Select()
cht=sht.api.Shapes.AddChart().Chart
cha=cht.ChartArea #Chart Area
cha.Format.Fill.ForeColor.RGB=xw.utils.rgb_to_int((155,255,0))
cha.Shadow=True #Plot area shows shadow
pla=cht.PlotArea #Plot area
pla.Format.Fill.UserPicture(root+r’/picpy2.jpg’) #Picture fill
cht.SeriesCollection(1).Format.Fill.ForeColor.RGB=xw.utils.rgb_to_int((255,255,0))
cht.Axes(2).HasMajorGridlines=False
cha.Shadow=False
pla.Format.Shadow.Visible=True #Plot area shows shadow
pla.Format.Shadow.OffsetX=3 #Horizontal offset of the shadow
pla.Format.Shadow.OffsetY=3 #Vertical offset of the shadow
【Example】

import xlwings as xw
import os

def set_style(cht):
    cht.ChartArea.Format.Line.Visible=False
    cht.PlotArea.Format.Fill.Visible=True
    cht.PlotArea.Format.Line.Visible=True
    cht.PlotArea.Format.Line.ForeColor.RGB=xw.utils.rgb_to_int((200,200,200))
    #cht.PlotArea.Format.Line.ForeColor.ObjectThemeColor=msoThemeColorText1
    ax1=cht.Axes(1)
    ax2=cht.Axes(2)
    ax1.HasTitle=True
    ax1.AxisTitle.Text='Categories'
    ax1.AxisTitle.Font.Size=10
    ax1.TickLabels.Font.Size=8
    #ax1.TickLabels.NumberFormat='0.00'
    ax1.HasMajorGridlines=False
    ax2.HasTitle=True
    ax2.AxisTitle.Text='Values'
    ax2.AxisTitle.Font.Size=10
    ax2.TickLabels.Font.Size=8
    ax2.HasMajorGridlines=False
    cht.HasTitle=True
    #cht.ChartTitle.Caption='Plot'
    #cht.ChartTitle.Font.Size=12

root=os.getcwd()
app=xw.App(visible=True, add_book=False)
wb=app.books.open(root+r'/data.xlsx',read_only=False)
sht=wb.sheets('Sheet1')

sht.api.Range('A1:B7').Select()    #
cht=sht.api.Shapes.AddChart2(-1, \
          xw.constants.ChartType.xlColumnClustered,20,20,350,250,True).Chart
cht.PlotArea.Format.Fill.ForeColor.RGB=xw.utils.rgb_to_int((255,255,26))
cht.PlotArea.Format.Fill.OneColorGradient(1,1,1)    #msoGradientHorizontal

set_style(cht)

cht.Export(root+'/cht.jpg')
cht.Export(root+'/cht.svg')
cht.ExportAsFixedFormat(0,root+'/cht.pdf')

#wb.save()
#app.kill()
How to use Application.ExecuteExcel4Macro in the xlwings API way
The ExecuteExcel4Macro member of the Application object in Excel’s object model provides a way to run Excel 4.0 macro functions, which are legacy commands from older versions of Excel. While modern Excel primarily uses VBA, these functions can still be useful for specific tasks that are not directly supported by newer APIs, such as certain financial or engineering calculations. In xlwings, this functionality is accessed through the api property, which exposes the underlying Excel object model, allowing Python scripts to interact with Excel in a manner similar to VBA.
The syntax for calling ExecuteExcel4Macro via xlwings is straightforward. First, you need to obtain the Application object from an xlwings App or Book instance. Then, you can invoke the method. The method takes a single string argument, String, which represents the Excel 4.0 macro function you want to execute. This string should be formatted exactly as it would be in Excel 4.0, including any required arguments. For example, a common function is GET.CELL, which retrieves information about a cell. The parameter is provided as a plain string, and you must ensure it is correctly quoted and concatenated if variables are involved. There is no return value specification in the syntax itself; the output depends on the macro function called.
Here is a basic example that demonstrates how to use ExecuteExcel4Macro with xlwings to get the full path of the active workbook, using the Excel 4.0 function GET.DOCUMENT(1):
import xlwings as xw

# Connect to the active Excel instance
app = xw.apps.active

# Execute the Excel 4.0 macro function to get the full path
full_path = app.api.ExecuteExcel4Macro("GET.DOCUMENT(1)")

print(f"Full path of active workbook: {full_path}")
Another example involves retrieving a specific cell’s value using GET.CELL. This can be useful for getting properties like the cell’s format or formula. In this case, you need to construct a reference string:
import xlwings as xw

# Connect to the active workbook and sheet
wb = xw.books.active
sheet = wb.sheets.active

# Define the cell address, e.g., A1
cell_address = "A1"

# Execute GET.CELL(6, A1) to get the formula in the cell (6 is the type_num for formula)
# Note: The reference must be provided as an R1C1-style reference or a named range
formula_result = wb.app.api.ExecuteExcel4Macro(f'GET.CELL(6, {cell_address})')

print(f"Formula in {cell_address}: {formula_result}")