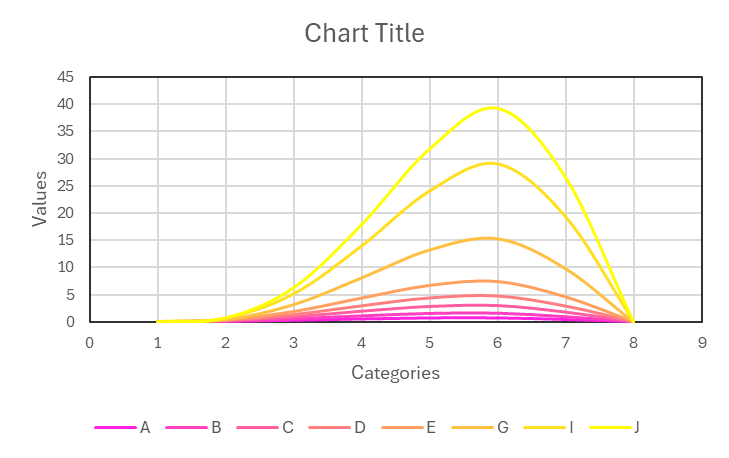
Flowing these steps to create smoothed curve chart:

Select data in the worksheet:

Click “Smoothed Curve” item in “Line Chart” menu in xlChart+ add-in, open “Create a Smoothed Line Chart” dialog box.

Click “OK” button.

You can change the colormap by selecting another item in “Select a colormap” dropbox in “Create a Line Chart” dialog box.


Leave a Reply