【Example】
【Code】
import xlwings as xw
import numpy as np
import os
def set_style(cht):
cht.ChartArea.Format.Line.Visible=False
cht.PlotArea.Format.Fill.Visible = False
cht.PlotArea.Format.Line.Visible = True
cht.PlotArea.Format.Line.ForeColor.RGB=xw.utils.rgb_to_int((200,200,200))
#cht.PlotArea.Format.Line.ForeColor.ObjectThemeColor = msoThemeColorText1
ax1 = cht.Axes(1)
ax2 = cht.Axes(2)
ax1.HasTitle = True
ax1.AxisTitle.Text = 'Categories'
ax1.AxisTitle.Font.Size = 10
ax1.TickLabels.Font.Size = 8
#ax1.TickLabels.NumberFormat = '0.00'
ax1.HasMajorGridlines = False
ax2.HasTitle = True
ax2.AxisTitle.Text = 'Values'
ax2.AxisTitle.Font.Size = 10
ax2.TickLabels.Font.Size = 8
ax2.HasMajorGridlines = False
cht.HasTitle = True
#cht.ChartTitle.Caption = 'Plot'
#cht.ChartTitle.Font.Size = 12
def draw_rnd_scatter(cht,x,y,n,w):
cht.SeriesCollection().NewSeries()
count=cht.SeriesCollection().Count
rd=[]
for i in range(n):
rd.append(x-w/2+w*np.random.rand(1)[0])
cht.SeriesCollection(count).ChartType=-4169
cht.SeriesCollection(count).XValues=rd
cht.SeriesCollection(count).Values=y
root=os.getcwd()
app=xw.App(visible=True,add_book=False)
wb=app.books.open(root+r'/data.xlsx',read_only=False)
sht=wb.sheets('Sheet1')
shp=sht.api.Shapes.AddChart2()
shp.Left=20
cht=shp.Chart
cht.ChartType=xw.constants.ChartType.xlXYScatter
ax1=cht.Axes(1)
ax2=cht.Axes(2)
ax1.MinimumScale=0.5
ax1.MaximumScale=4.5
ax2.MinimumScale=0
ax2.MaximumScale=0.35
set_style(cht)
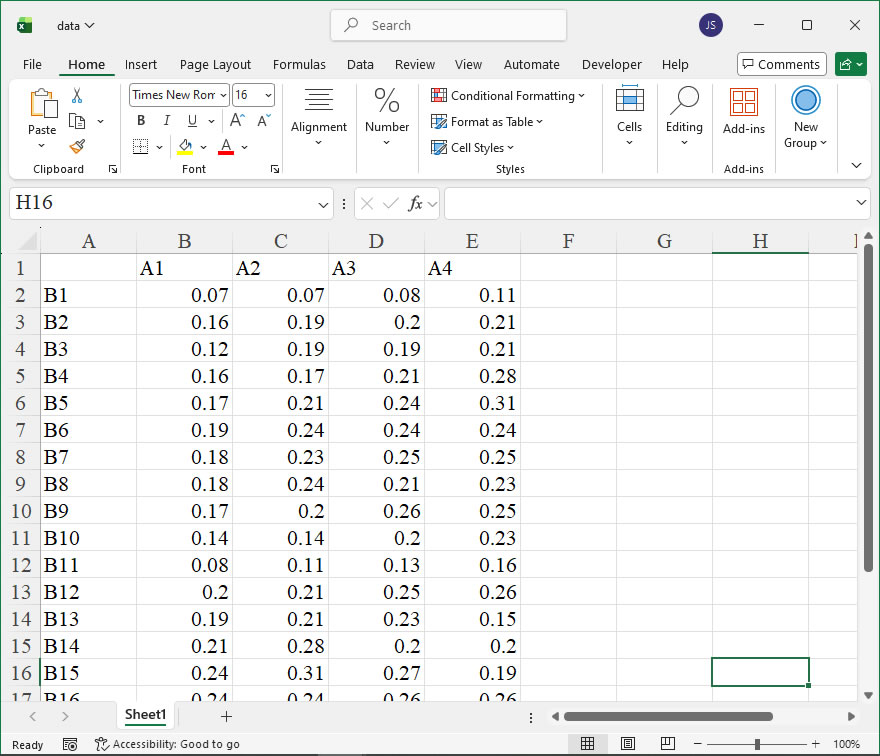
data=sht.range('B2:E21').value
dt=np.transpose(data)
dt1=dt[0]
dt2=dt[1]
dt3=dt[2]
dt4=dt[3]
aveg=[0 for _ in range(4)]
aveg[0]=app.api.WorksheetFunction.Average(dt1)
aveg[1]=app.api.WorksheetFunction.Average(dt2)
aveg[2]=app.api.WorksheetFunction.Average(dt3)
aveg[3]=app.api.WorksheetFunction.Average(dt4)
cht.SeriesCollection().NewSeries()
n=cht.SeriesCollection().Count
cht.SeriesCollection(n).ChartType=xw.constants.ChartType.xlColumnClustered
cht.SeriesCollection(n).XValues=[1,2,3,4]
cht.SeriesCollection(n).Values=aveg
cht.SeriesCollection(n).Format.Fill.ForeColor.RGB=xw.utils.rgb_to_int((76,200,132))
cht.ChartGroups(1).GapWidth=100
draw_rnd_scatter(cht,1,dt1,20,0.5)
draw_rnd_scatter(cht, 2, dt2, 20, 0.5)
draw_rnd_scatter(cht, 3, dt3, 20, 0.5)
draw_rnd_scatter(cht, 4, dt4, 20, 0.5)
#wb.save()
#app.kill()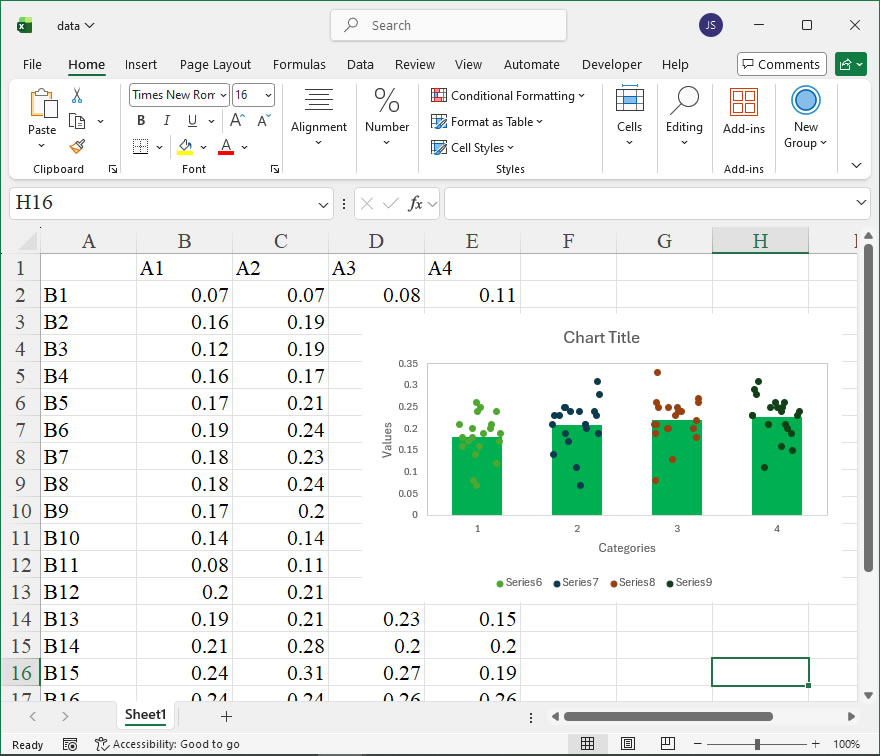
Leave a Reply