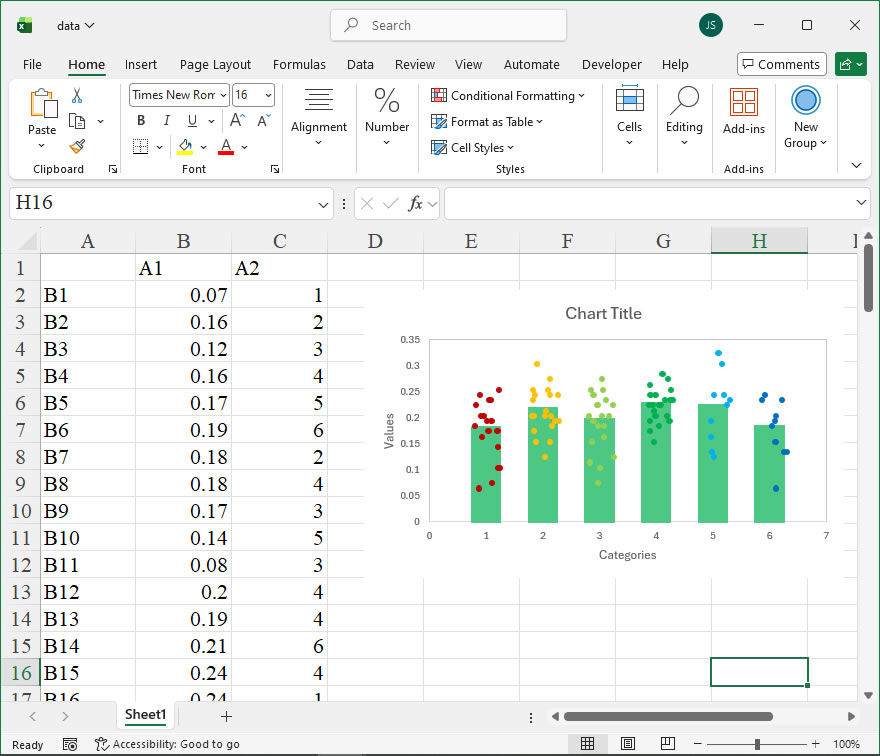
How To Create Custom Scatter Bar Chart Using xlwings?
【Example】
【Code】
import xlwings as xw
import numpy as np
import os
def set_style(cht):
cht.ChartArea.Format.Line.Visible=False
cht.PlotArea.Format.Fill.Visible = False
cht.PlotArea.Format.Line.Visible = True
cht.PlotArea.Format.Line.ForeColor.RGB=xw.utils.rgb_to_int((200,200,200))
#cht.PlotArea.Format.Line.ForeColor.ObjectThemeColor = msoThemeColorText1
ax1 = cht.Axes(1)
ax2 = cht.Axes(2)
ax1.HasTitle = True
ax1.AxisTitle.Text = 'Categories'
ax1.AxisTitle.Font.Size = 10
ax1.TickLabels.Font.Size = 8
#ax1.TickLabels.NumberFormat = '0.00'
ax1.HasMajorGridlines = False
ax2.HasTitle = True
ax2.AxisTitle.Text = 'Values'
ax2.AxisTitle.Font.Size = 10
ax2.TickLabels.Font.Size = 8
ax2.HasMajorGridlines = False
cht.HasTitle = True
#cht.ChartTitle.Caption = 'Plot'
#cht.ChartTitle.Font.Size = 12
def draw_bar(cht,y,n,x,r,g,b,w,grad):
aveg=np.mean(y)
pt=[[0 for _ in range(2)] for _ in range(5)]
pt[0][0]=shape_x(cht,x-w/2)
pt[0][1]=shape_y(cht,cht.Axes(2).MinimumScale)
pt[1][0]=shape_x(cht,x+w/2)
pt[1][1]=shape_y(cht,cht.Axes(2).MinimumScale)
pt[2][0]=shape_x(cht,x+w/2)
pt[2][1]=shape_y(cht,aveg)
pt[3][0]=shape_x(cht,x-w/2)
pt[3][1]=shape_y(cht,aveg)
pt[4][0]=pt[0][0]
pt[4][1]=pt[0][1]
shp=cht.Shapes.AddPolyline(pt)
if grad:
shp.Fill.ForeColor.RGB=xw.utils.rgb_to_int((r,g,b))
shp.Fill.OneColorGradient(1,1,1)
shp.Line.ForeColor.RGB=xw.utils.rgb_to_int((r,g,b))
shp.Line.Weight=1.5
else:
shp.Fill.ForeColor.RGB=xw.utils.rgb_to_int((r,g,b))
shp.Line.ForeColor.RGB=xw.utils.rgb_to_int((r,g,b))
shp.Line.Weight=1.5
def draw_rnd_scatter(cht,x,y,n,w,r,g,b):
rd=[]
for i in range(n):
rd.append(x-w/2+w*np.random.rand(1)[0])
for i in range(n):
bx=shape_x(cht,rd[i])
by=shape_y(cht,y[i])
ex=cht.PlotArea.InsideWidth/(cht.Axes(1).MaximumScale- \
cht.Axes(1).MinimumScale)*0.09
ey=ex
shp=cht.Shapes.AddShape(9,bx,by,ex,ey)
shp.Fill.ForeColor.RGB=xw.utils.rgb_to_int((r,g,b))
shp.Line.Weight=1
shp.Line.ForeColor.RGB=xw.utils.rgb_to_int((r,g,b))
root=os.getcwd()
app=xw.App(visible=True,add_book=False)
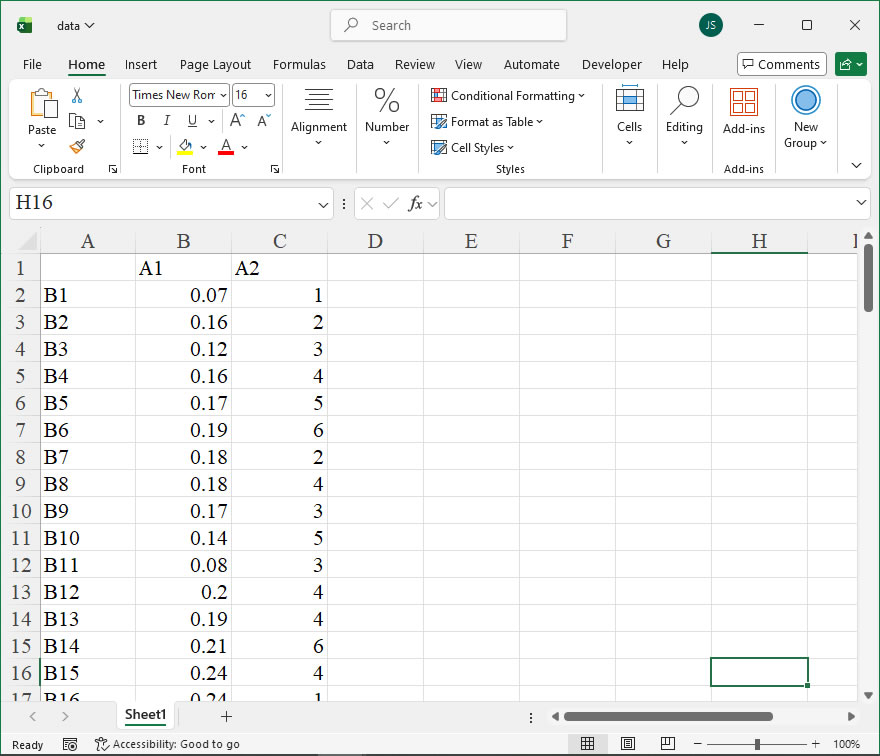
wb=app.books.open(root+r'/data.xlsx',read_only=False)
sht=wb.sheets('Sheet1')
data=sht.range('B2:C101').value
app.kill()
from comtypes.client import CreateObject
app2=CreateObject("Excel.Application")
app2.Visible=True
wb2=app2.Workbooks.Open(root+r'/data.xlsx')
sht2=wb2.Sheets('Sheet1')
shp=sht2.Shapes.AddChart2()
shp.Left=20
cht=shp.Chart
cht.ChartType=-4169
ax1=cht.Axes(1)
ax2=cht.Axes(2)
ax1.MinimumScale=0
ax1.MaximumScale=7
ax2.MinimumScale=0
ax2.MaximumScale=0.35
set_style(cht)
cht.SeriesCollection().NewSeries()
count1=count2=count3=count4=count5=count6=0
d1=[];d2=[];d3=[];d4=[];d5=[];d6=[]
for i in range(100):
if data[i][1]==1:
count1+=1
d1.append(data[i][0])
elif data[i][1]==2:
count2+=1
d2.append(data[i][0])
elif data[i][1]==3:
count3+=1
d3.append(data[i][0])
elif data[i][1]==4:
count4+=1
d4.append(data[i][0])
elif data[i][1]==5:
count5+=1
d5.append(data[i][0])
elif data[i][1]==6:
count6+=1
d6.append(data[i][0])
draw_bar(cht,d1,count1,1,76,200,132,0.5,False)
draw_bar(cht,d2,count2,2,76,200,132,0.5,False)
draw_bar(cht,d3,count3,3,76,200,132,0.5,False)
draw_bar(cht,d4,count4,4,76,200,132,0.5,False)
draw_bar(cht,d5,count5,5,76,200,132,0.5,False)
draw_bar(cht,d6,count6,6,76,200,132,0.5,False)
draw_rnd_scatter(cht,1,d1,count1,0.5,192,0,0)
draw_rnd_scatter(cht,2,d2,count2,0.5,255,192,0)
draw_rnd_scatter(cht,3,d3,count3,0.5,146,208,80)
draw_rnd_scatter(cht,4,d4,count4,0.5,0,176,80)
draw_rnd_scatter(cht,5,d5,count5,0.5,0,176,240)
draw_rnd_scatter(cht,6,d6,count6,0.5,0,112,192)
#wb2.Save()
#os.system('taskkill /f /im EXCEL.EXE')