【Example】
【Code】
import xlwings as xw
import numpy as np
import os
def set_style(cht):
cht.ChartArea.Format.Line.Visible=False
cht.PlotArea.Format.Fill.Visible = False
cht.PlotArea.Format.Line.Visible = True
cht.PlotArea.Format.Line.ForeColor.RGB=xw.utils.rgb_to_int((200,200,200))
#cht.PlotArea.Format.Line.ForeColor.ObjectThemeColor = msoThemeColorText1
ax1 = cht.Axes(1)
ax2 = cht.Axes(2)
ax1.HasTitle = True
ax1.AxisTitle.Text = 'Values'
ax1.AxisTitle.Font.Size = 10
ax1.TickLabels.Font.Size = 8
#ax1.TickLabels.NumberFormat = '0.00'
ax1.HasMajorGridlines = False
ax2.HasTitle = True
ax2.AxisTitle.Text = 'Probability'
ax2.AxisTitle.Font.Size = 10
ax2.TickLabels.Font.Size = 8
ax2.HasMajorGridlines = False
cht.HasTitle = True
#cht.ChartTitle.Caption = 'KDE Plot'
#cht.ChartTitle.Font.Size = 12
def draw_kde(cht,data,y,r,g,b,minx,maxx):
'''
rng: 数据单元格区域
'cht: 图表对象
'dblX: 横坐标
'''
kdex=[0 for _ in range(180)]
kdef=[0 for _ in range(180)]
step=(maxx-minx)/180
for i in range(180):
kdex[i]=minx+i*step
kdef[i]=y+kde(data,kdex[i],1.5)
#画填充多边形
pt=[[0 for _ in range(2)] for _ in range(183)]
for i in range(180):
pt[i][0]=shape_x(cht,kdex[179-i])
pt[i][1]=shape_y(cht,kdef[179-i])
pt[180][0]=pt[179][0]
pt[180][1]=shape_y(cht,y)
pt[181][0]=pt[0][0]
pt[181][1]=shape_y(cht,y)
pt[182][0]=pt[0][0]
pt[182][1]=pt[0][1]
shp=cht.Shapes.AddPolyline(pt)
shp.Fill.ForeColor.RGB=xw.utils.rgb_to_int((r,g,b))
shp.Fill.OneColorGradient(1,1,1)
shp.Fill.Transparency=0.1
shp.Line.ForeColor.RGB=xw.utils.rgb_to_int((r,g,b))
shp.Line.Weight=1
def kde(data,x,h):
#一元核密度估计
my_sum=0
count=0
for i in data:
my_sum+=(1/np.sqrt(2*3.1415926))*\
np.exp(-0.5*((x-i)/h)*((x-i)/h))
count+=1
return my_sum/count/h
root=os.getcwd()
app=xw.App(visible=True,add_book=False)
wb=app.books.open(root+r'/data.xlsx',read_only=False)
sht=wb.sheets('Sheet1')
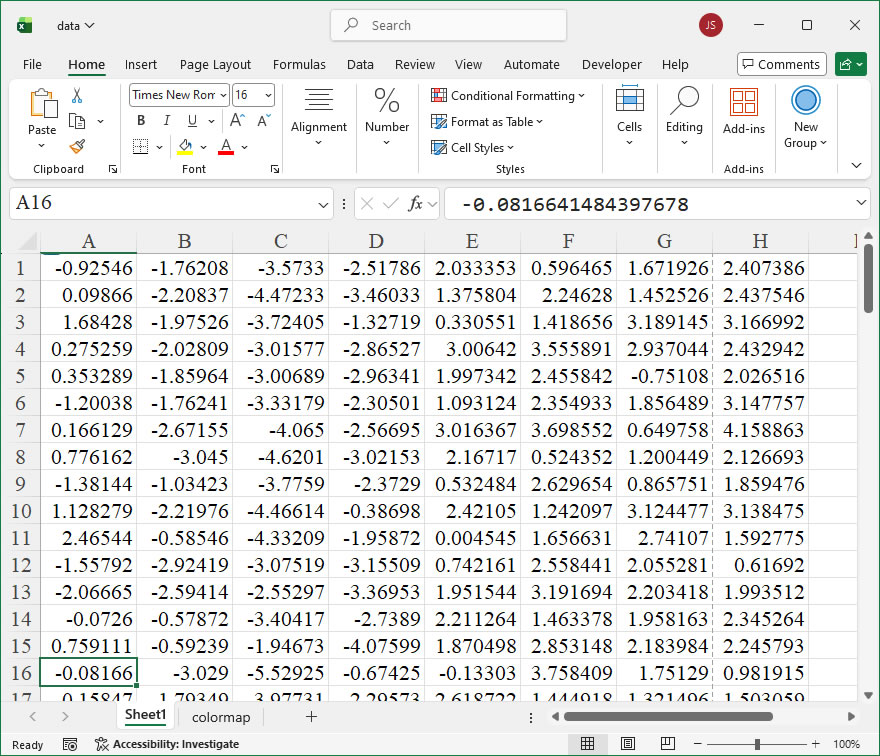
data=sht.range('A1:H100').value
cm=wb.sheets('colormap').range('A1:C256').value
app.kill()
#从comtypes包中导入CreateObject函数
from comtypes.client import CreateObject
app2=CreateObject("Excel.Application") #创建Excel应用
app2.Visible=True #应用窗口可见
app2.ScreenUpdating=False
wb2=app2.Workbooks.Open(root+r'/data.xlsx') #添加工作簿
sht2=wb2.Sheets('Sheet1') #获取第1个工作表
shp=sht2.Shapes.AddChart2()
shp.Left=20
shp.Left=300
shp.Top=20
shp.Width=350
shp.Height=400
cht=shp.Chart #添加图表
cht.ChartType=-4169
ax1=cht.Axes(1)
ax2=cht.Axes(2)
ax1.MinimumScale=-10
ax1.MaximumScale=10
ax2.MinimumScale=0
ax2.MaximumScale=1.8
ax1.CrossesAt=ax1.MinimumScale
ax2.CrossesAt=ax2.MinimumScale
set_style(cht)
#cht.SeriesCollection().NewSeries()
dd=np.transpose(data)
dt=[0 for _ in range(8)]
for i in range(8):
dt[i]=list(dd[i][:])
#绘制核密度估计曲线图
for i in range(7,-1,-1):
count=int(i/7 * 256)
if count==256:
r=cm[255][0]
g=cm[255][1]
b=cm[255][2]
else:
r=cm[count][0]
g=cm[count][1]
b=cm[count][2]
draw_kde(cht,dt[i],0.2*i,r,g,b,-10,10)
#刻度标签-纵坐标
label_pos=[0 for _ in range(8)]
for i in range(8):
label_pos[i]=i*0.2
labels=['A','B','C','D','E','F','G','H']
for i in range(8):
lf=shape_x(cht,-11)
tp=shape_y(cht,label_pos[i]+0.08)
wd=cht.PlotArea.InsideWidth/(cht.Axes(1).MaximumScale-cht.Axes(1).MinimumScale)*1.6
ht=cht.PlotArea.InsideHeight/(cht.Axes(2).MaximumScale-cht.Axes(2).MinimumScale)*0.1
shp2=cht.Shapes.AddLabel(1,lf,tp,wd,ht)
shp2.TextFrame2.TextRange.Characters().Text=labels[i]
shp2.TextFrame2.TextRange.Characters().Font.Size=8
shp2.TextFrame2.AutoSize=1 #msoAutoSizeTextToFitShape
#刻度标签-横坐标
xlabel_pos=[0 for _ in range(11)]
xlabels=[0 for _ in range(11)]
for i in range(11):
xlabel_pos[i]=i*2-10
xlabels[i]=str(i*2-10)
for i in range(11):
lf=shape_x(cht,xlabel_pos[i]-0.5)
tp=shape_y(cht,-0.03)
wd=cht.PlotArea.InsideWidth/(cht.Axes(1).MaximumScale-cht.Axes(1).MinimumScale)*1.8
ht=cht.PlotArea.InsideHeight/(cht.Axes(2).MaximumScale-cht.Axes(2).MinimumScale)*0.1
shp3=cht.Shapes.AddLabel(1,lf,tp,wd,ht)
shp3.TextFrame2.TextRange.Characters().Text=xlabels[i]
shp3.TextFrame2.TextRange.Characters().Font.Size=8
shp3.TextFrame2.AutoSize=1 #msoAutoSizeTextToFitShape
#外框
lf=shape_x(cht,-10)
tp=shape_y(cht,1.8)
wd=cht.PlotArea.InsideWidth/(cht.Axes(1).MaximumScale-cht.Axes(1).MinimumScale)*20
ht=cht.PlotArea.InsideHeight/(cht.Axes(2).MaximumScale-cht.Axes(2).MinimumScale)*1.8
shp4=cht.Shapes.AddShape(1,lf,tp,wd,ht)
shp4.Fill.Visible=False
shp4.Line.Weight=1
shp4.Line.ForeColor.RGB=xw.utils.rgb_to_int((200,200,200))
app2.ScreenUpdating=True
cht.Export(root+'/cht.jpg')
cht.Export(root+'/cht.svg')
cht.ExportAsFixedFormat(0,root+'/cht.pdf')
#wb2.Save()
#os.system('taskkill /f /im EXCEL.EXE')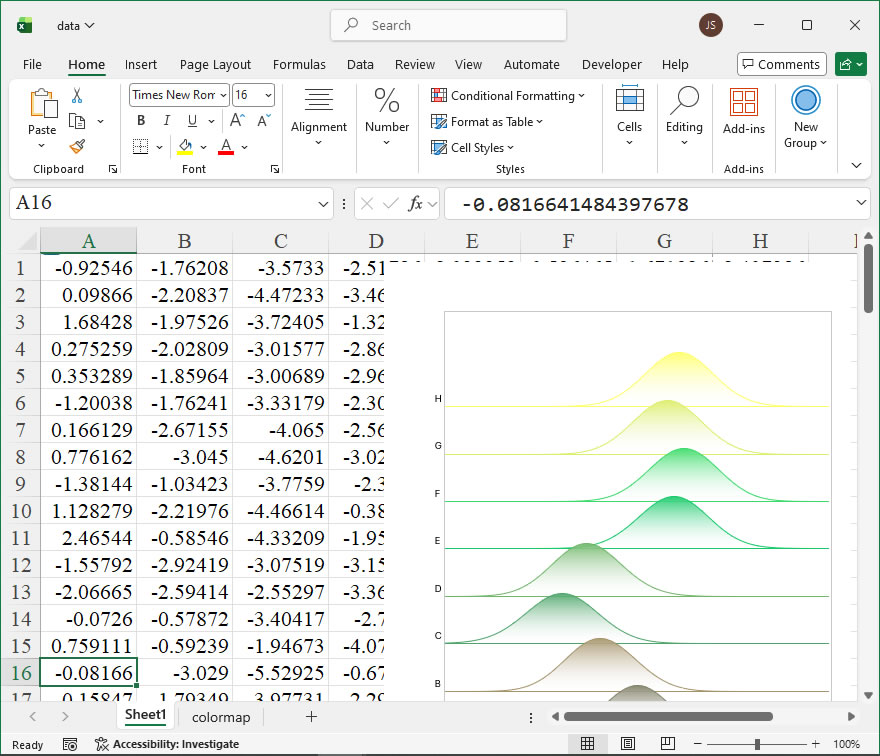
Leave a Reply