【Method】
Tick marks are short lines on the axis used to help determine the position of data points on the chart. There are major and minor tick marks. Use the **MajorTickMark** and **MinorTickMark** properties of the **Axis** object to set the major and minor tick marks.
The possible values for **MajorTickMark** and **MinorTickMark** are as follows:
|
Name |
Value |
Description |
|
xlTickMarkCross |
4 |
Across the axis |
|
xlTickMarkInside |
2 |
Inside the axis |
|
xlTickMarkNone |
-4142 |
No marker |
|
xlTickMarkOutside |
3 |
Outside the axis |
Use the **TickMarkSpacing** property to return or set the spacing of major tick marks, indicating how often a major tick mark is displayed for every set of data points. This is only applicable for category axes and series axes and can be a value between 1 and 31999.
Use the **MajorUnit** and **MinorUnit** properties to set the units for the major and minor tick marks on the value axis.
Set **MajorUnitIsAuto** and **MinorUnitIsAuto** properties to `True` to have Excel automatically calculate the major and minor tick units for the value axis.
sht.api.Range(‘A1:B7’).Select() #Data
cht=sht.api.Shapes.AddChart().Chart #Add chart
axs=cht.Axes(1) #Horizontal axis
axs2=cht.Axes(2) #Vertical axis
axs.MajorTickMark = 4
axs.MinorTickMark = 2
axs.TickMarkSpacing = 1
axs2.MajorUnit = 40
axs2.MinorUnit = 10
axs2.MajorUnitIsAuto=True
axs2.MinorUnitIsAuto=True
【Example】
【Code】
#Axis - Major tick marks
import xlwings as xw
import os
root = os.getcwd()
app = xw.App(visible=True, add_book=False)
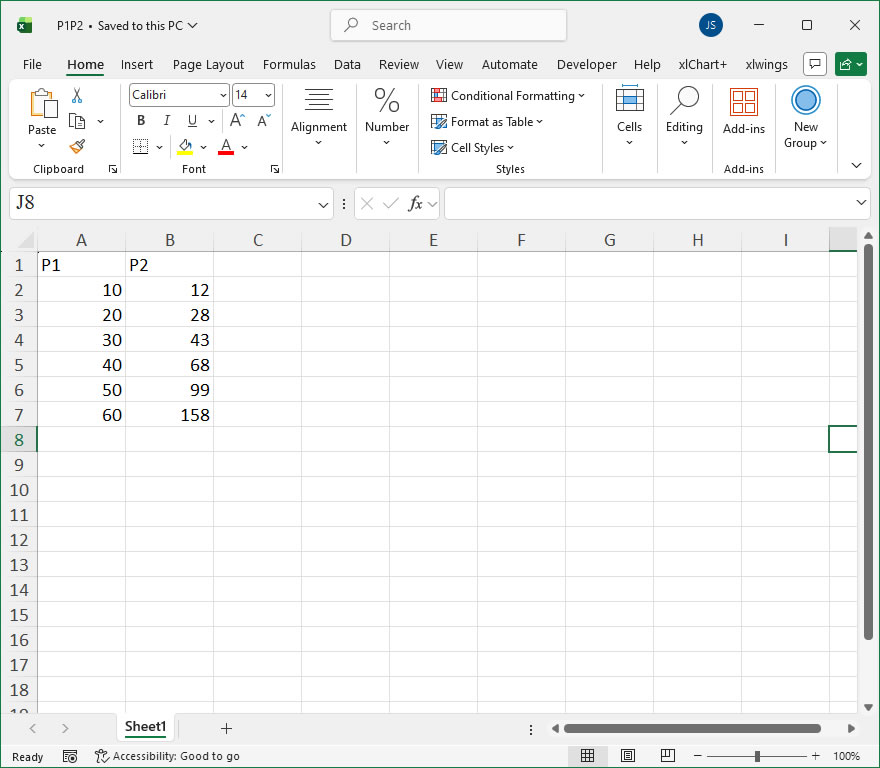
wb=app.books.open(root+r"/P1P2.xlsx",read_only=False)
sht=wb.sheets(1)
sht.api.Range('A1:B7').Select() #Data
cht=sht.api.Shapes.AddChart().Chart #Add chart
axs=cht.Axes(1) #Horizontal axis
axs2=cht.Axes(2) #Vertical axis
axs.MajorTickMark = 4
axs.MinorTickMark = 2
axs.TickMarkSpacing = 1
axs2.MinorTickMark = 2
axs2.MajorUnit = 40
axs2.MinorUnit = 10
#axs2.MajorUnitIsAuto=True
#axs2.MinorUnitIsAuto=True
#wb.save()
#wb.close()
#app.kill()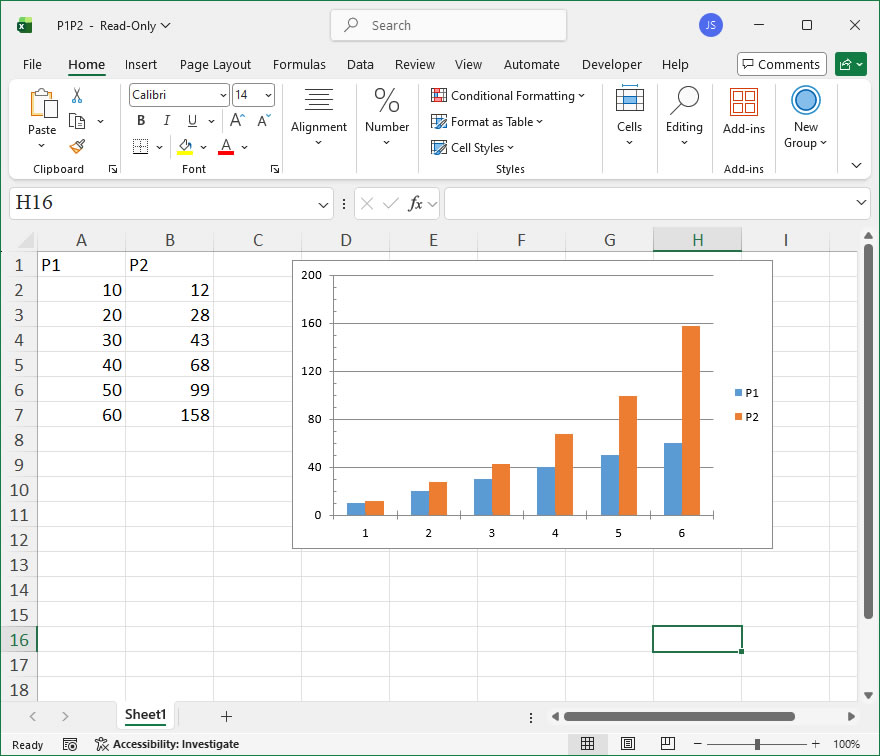
Leave a Reply