Method
|
Name |
Meaning |
|
BackWall |
Returns the Walls object, which allows users to format the background wall of a 3D chart individually. |
|
BarShape |
Shape of the bars |
|
ChartArea |
Returns the ChartArea object, representing the entire chart area |
|
ChartStyle |
Returns or sets the chart style. You can use a number between 1 and 48 to set the chart style |
|
ChartTitle |
Returns the ChartTitle object, representing the title of the specified chart |
|
ChartType |
Returns or sets the chart type |
|
Copy |
Copies the chart worksheet to another location in the workbook |
|
CopyPicture |
Copies the chart as an image to the clipboard |
|
DataTable |
Returns the DataTable object, representing the data table of this chart |
|
Delete |
Deletes the chart |
|
Export |
Exports the chart as an image file |
|
HasAxis |
Returns or sets the axis displayed on the chart |
|
HasDataTable |
Returns True if the chart has a data table, otherwise False |
|
HasTitle |
Sets whether to display the title |
|
Legend |
Returns a Legend object, representing the chart legend |
|
Move |
Moves the chart worksheet to another location in the workbook |
|
Name |
The name of the chart |
|
PlotArea |
Returns a PlotArea object, representing the plot area of the chart |
|
PlotBy |
Returns or sets the way rows or columns are used as data series in the chart. This can be one of the XlRowCol constants: xlColumns or xlRows |
|
SaveAs |
Saves the chart to a different file |
|
Select |
Selects the chart |
|
SeriesCollection |
Returns a collection containing all series in the chart |
|
SetElement |
Sets chart elements |
|
SetSourceData |
Binds the data used to draw the chart |
|
Visible |
Returns or sets an XlSheetVisibility value to determine whether the object is visible |
|
Walls |
Returns a Walls object, representing the background walls of a 3D chart |
sht.api.Range(‘A1:B7’).Select() #Data
cht=sht.api.Shapes.AddChart2().Chart #Add chart
axs=cht.Axes(1) #Horizontal axis
axs2=cht.Axes(2) #Vertical axis
axs.HasTitle=True #X axis title
axs.AxisTitle.Caption=’X Axis Title’ #Title text
axs.AxisTitle.Font.Italic=True #Font Italic
axs.AxisTitle.Font.Color=xw.utils.rgb_to_int((255, 0, 0)) #Font color is red
axs2.HasTitle=True #Vertical axis has title
axs2.AxisTitle.Caption=’Y Axis Title’ #Title text
axs2.AxisTitle.Font.Bold=True #Font bold
Sample Code
#Other Members of Chart Object

import xlwings as xw
import os

root=os.getcwd()
app=xw.App(visible=True,add_book=False)
wb=app.books.open('GDP.xlsx',read_only=False)
sht=wb.sheets('Sheet1')

sht.api.Range('A1:B7').Select()    #Data
cht=sht.api.Shapes.AddChart2().Chart    #Add chart
axs=cht.Axes(1)    #Horizontal axis
axs2=cht.Axes(2)    #Vertical axis
axs.HasTitle=True    #X axis title
axs.AxisTitle.Caption='X Axis Title'    #Title text
axs.AxisTitle.Font.Italic=True    #Font Italic
axs.AxisTitle.Font.Color=xw.utils.rgb_to_int((255, 0, 0))    #Font color is red
axs2.HasTitle=True    #Vertical axis has title
axs2.AxisTitle.Caption='Y Axis Title'    #Title text
axs2.AxisTitle.Font.Bold=True    #Font bold

#wb.save()
#wb.close()
#app.kill()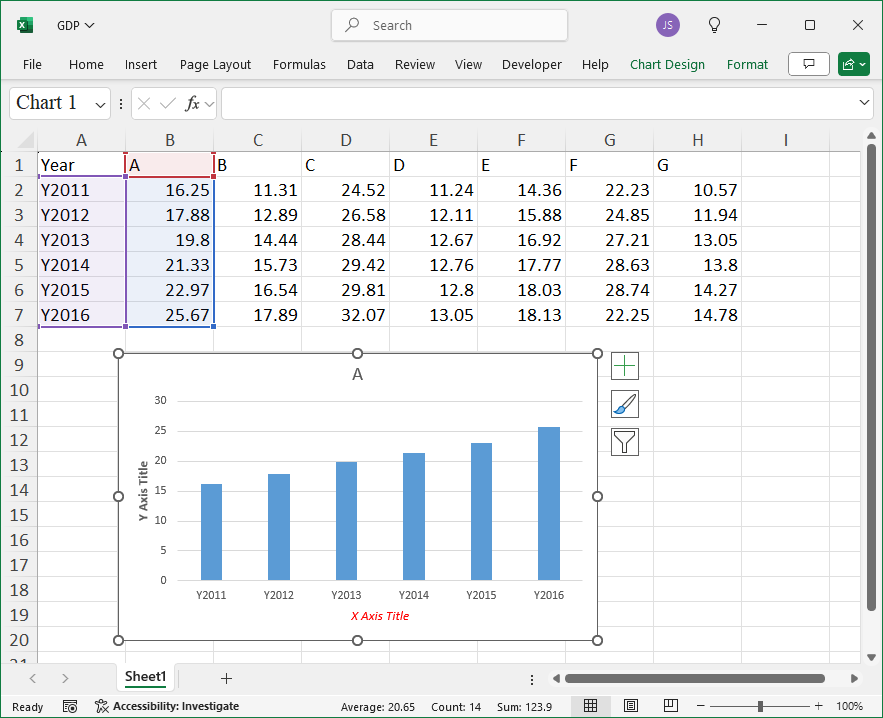
Leave a Reply