Method
You can set the chart type using the `chart_type` property of the chart object or the `ChartType` property of the Chart object. For a chart object `cht`, set the chart type as shown below:
【xlwings】
cht.chart_type=”column_clustered”
【xlwings API】
cht.ChartType=xw.constants.ChartType.xlColumnClustered
The values for the `chart_type` or `ChartType` property are as shown in the table below.
|
API Constant Name |
API Value |
xlwings Value |
Description |
|
xl3DArea |
-4098 |
“3d_area” |
3D Area Chart |
|
xl3DAreaStacked |
78 |
“3d_area_stacked” |
3D Stacked Area Chart |
|
xl3DAreaStacked100 |
79 |
“3d_area_stacked_100” |
Percentage Stacked Area Chart |
|
xl3DBarClustered |
60 |
“3d_bar_clustered” |
3D Clustered Bar Chart |
|
xl3DBarStacked |
61 |
“3d_bar_stacked” |
3D Stacked Bar Chart |
|
xl3DBarStacked100 |
62 |
“3d_bar_stacked_100” |
3D Percentage Stacked Bar Chart |
|
xl3DColumn |
-4100 |
“3d_column” |
3D Column Chart |
|
xl3DColumnClustered |
54 |
“3d_column_clustered” |
3D Clustered Column Chart |
|
xl3DColumnStacked |
55 |
“3d_column_stacked” |
3D Stacked Column Chart |
|
xl3DColumnStacked100 |
56 |
“3d_column_stacked_100” |
3D Percentage Stacked Column Chart |
|
xl3DLine |
-4101 |
“3d_line” |
3D Line Chart |
|
xl3DPie |
-4102 |
“3d_pie” |
3D Pie Chart |
|
xl3DPieExploded |
70 |
“3d_pie_exploded” |
Exploded 3D Pie Chart |
|
xlArea |
1 |
“area” |
Area Chart |
|
xlAreaStacked |
76 |
“area_stacked” |
Stacked Area Chart |
|
xlAreaStacked100 |
77 |
“area_stacked_100” |
Percentage Stacked Area Chart |
|
xlBarClustered |
57 |
“bar_clustered” |
Clustered Bar Chart |
|
xlBarOfPie |
71 |
“bar_of_pie” |
Bar of Pie Chart |
|
xlBarStacked |
58 |
“bar_stacked” |
Stacked Bar Chart |
|
xlBarStacked100 |
59 |
“bar_stacked_100” |
Percentage Stacked Bar Chart |
|
xlBubble |
个 |
“bubble” |
Bubble Chart |
|
xlBubble3DEffect |
87 |
“bubble_3d_effect” |
3D Bubble Chart |
|
xlColumnClustered |
51 |
“column_clustered” |
Clustered Column Chart |
|
xlColumnStacked |
52 |
“column_stacked” |
Stacked Column Chart |
|
xlColumnStacked100 |
53 |
“column_stacked_100” |
Percentage Stacked Column Chart |
|
xlConeBarClustered |
102 |
“cone_bar_clustered” |
Clustered Cone Bar Chart |
|
xlConeBarStacked |
103 |
“cone_bar_stacked” |
Stacked Cone Bar Chart |
|
xlConeBarStacked100 |
104 |
“cone_bar_stacked_100” |
Percentage Stacked Cone Bar Chart |
|
xlConeCol |
105 |
“cone_col” |
3D Cone Column Chart |
|
xlConeColClustered |
99 |
“cone_col_clustered” |
Clustered Cone Column Chart |
|
xlConeColStacked |
100 |
“cone_col_stacked” |
Stacked Cone Column Chart |
|
xlConeColStacked100 |
101 |
“cone_col_stacked_100” |
Percentage Stacked Cone Column Chart |
|
xlCylinderBarClustered |
95 |
“cylinder_bar_clustered” |
Clustered Cylinder Bar Chart |
|
xlCylinderBarStacked |
96 |
“cylinder_bar_stacked” |
Stacked Cylinder Bar Chart |
|
xlCylinderBarStacked100 |
97 |
“cylinder_bar_stacked_100” |
Percentage Stacked Cylinder Bar Chart |
|
xlCylinderCol |
98 |
“cylinder_col” |
3D Cylinder Column Chart |
|
xlCylinderColClustered |
92 |
“cylinder_col_clustered” |
Clustered Cylinder Column Chart |
|
xlCylinderColStacked |
93 |
“cylinder_col_stacked” |
Stacked Cylinder Column Chart |
|
xlCylinderColStacked100 |
94 |
“cylinder_col_stacked_100” |
Percentage Stacked Cylinder Column Chart |
|
xlDoughnut |
-4120 |
“doughnut” |
Doughnut Chart |
|
xlDoughnutExploded |
80 |
“doughnut_exploded” |
Exploded Doughnut Chart |
|
xlLine |
4 |
“line” |
Line Chart |
|
xlLineMarkers |
65 |
“line_markers” |
Line Chart with Data Markers |
|
xlLineMarkersStacked |
66 |
“line_markers_stacked” |
Stacked Line Chart with Data Markers |
|
xlLineMarkersStacked100 |
67 |
“line_markers_stacked_100” |
Percentage Stacked Line Chart with Data Markers |
|
xlLineStacked |
63 |
“line_stacked” |
Stacked Line Chart |
|
xlLineStacked100 |
64 |
“line_stacked_100” |
Percentage Stacked Line Chart |
|
xlPie |
5 |
“pie” |
Pie Chart |
|
xlPieExploded |
69 |
“pie_exploded” |
Exploded Pie Chart |
|
xlPieOfPie |
68 |
“pie_of_pie” |
Pie of Pie Chart |
|
xlPyramidBarClustered |
109 |
“pyramid_bar_clustered” |
Compound Bar Pyramid Chart |
|
xlPyramidBarStacked |
110 |
“pyramid_bar_stacked” |
Stacked Bar Pyramid Chart |
|
xlPyramidBarStacked100 |
111 |
“pyramid_bar_stacked_100” |
Percentage Stacked Bar Pyramid Chart |
|
xlPyramidCol |
112 |
“pyramid_col” |
3D Column Pyramid Chart |
|
xlPyramidColClustered |
106 |
“pyramid_col_clustered” |
Compound Column Pyramid Chart |
|
xlPyramidColStacked |
107 |
“pyramid_col_stacked” |
Stacked Column Pyramid Chart |
|
xlPyramidColStacked100 |
108 |
“pyramid_col_stacked_100” |
Percentage Stacked Column Pyramid Chart |
|
xlRadar |
-4151 |
“radar” |
Radar Chart. |
|
xlRadarFilled |
82 |
“radar_filled” |
Filled Radar Chart |
|
xlRadarMarkers |
81 |
“radar_markers” |
Radar Chart with Data Markers |
|
xlRegionMap |
140 |
|
Map Chart |
|
xlStockHLC |
88 |
“stock_hlc” |
High-Low-Close Stock Chart |
|
xlStockOHLC |
89 |
“stock_ohlc” |
Open-High-Low-Close Stock Chart |
|
xlStockVHLC |
90 |
“stock_vhlc” |
Volume-High-Low-Close Stock Chart |
|
xlStockVOHLC |
91 |
“stock_vohlc” |
Volume-Open-High-Low-Close Stock Chart |
|
xlSurface |
83 |
“surface” |
3D Surface Chart |
|
xlSurfaceTopView |
85 |
“surface_top_view” |
Surface Chart (Top View) |
|
xlSurfaceTopViewWireframe |
86 |
“surface_top_view_wireframe” |
Surface Chart (Top View Wireframe) |
|
xlSurfaceWireframe |
84 |
“surface_wireframe” |
3D Surface Chart (Wireframe) |
|
xlXYScatter |
-4169 |
“xy_scatter” |
Scatter Plot |
|
xlXYScatterLines |
74 |
“xy_scatter_lines” |
Line Scatter Plot |
|
xlXYScatterLinesNoMarkers |
75 |
“xy_scatter_lines_no_markers” |
Line Scatter Plot Without Markers |
|
xlXYScatterSmooth |
72 |
“xy_scatter_smooth” |
Smooth Line Scatter Plot |
|
xlXYScatterSmoothNoMarkers |
73 |
“xy_scatter_smooth_no_markers” |
Smooth Line Scatter Plot Without Markers |
sht.api.Range(‘A1’).CurrentRegion.Select() #Data
sht.api.Shapes.AddChart2(-1,xw.constants.ChartType.xlColumnClustered,20,150,300,200,True)
Sample Code
#Chart type

import xlwings as xw
import os

root = os.getcwd()
app = xw.App(visible=True, add_book=False)
wb=app.books.open('GDP.xlsx',read_only=False)
sht=wb.sheets(1)

sht.api.Range('A1').CurrentRegion.Select()    #Data
sht.api.Shapes.AddChart2(-1,xw.constants.ChartType.xlColumnClustered,20,150,300,200,True)
sht.api.Shapes.AddChart2(-1,xw.constants.ChartType.xlBarClustered,400,150,300,200,True)
sht.api.Shapes.AddChart2(-1,xw.constants.ChartType.xlConeBarStacked,20,400,300,200,True)
sht.api.Shapes.AddChart2(-1,xw.constants.ChartType.xlLineMarkersStacked,400,400,300,200,True)
sht.api.Shapes.AddChart2(-1,xw.constants.ChartType.xlXYScatter,20,650,300,200,True)
sht.api.Shapes.AddChart2(-1,xw.constants.ChartType.xlPieOfPie,400,650,300,200,True)

#wb.save()
#wb.close()
#app.kill()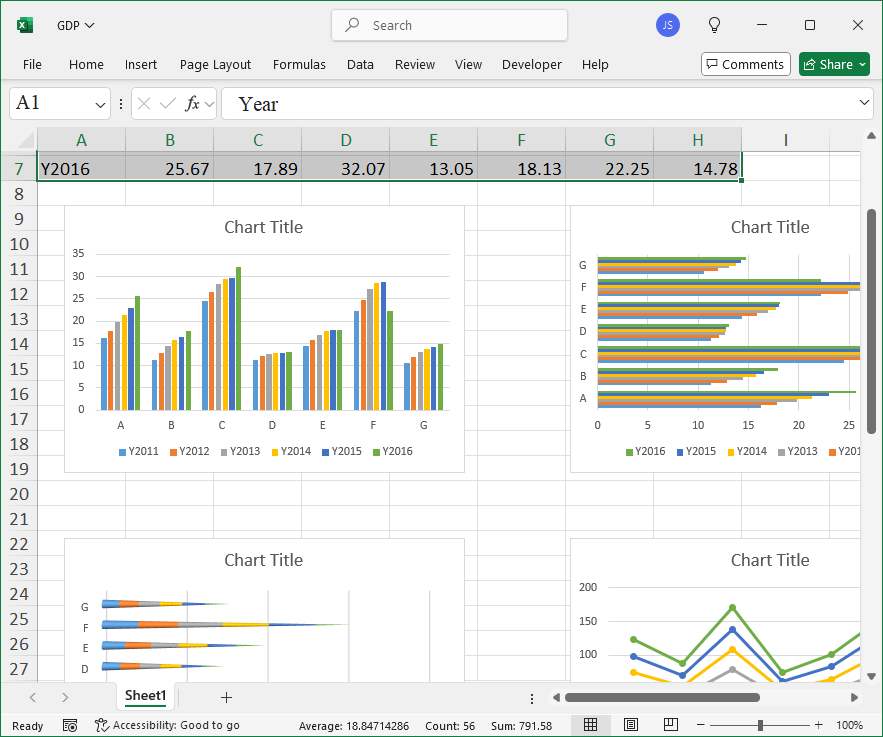
Leave a Reply